


Business Quality Score
A Study of U.S. and International Stocks
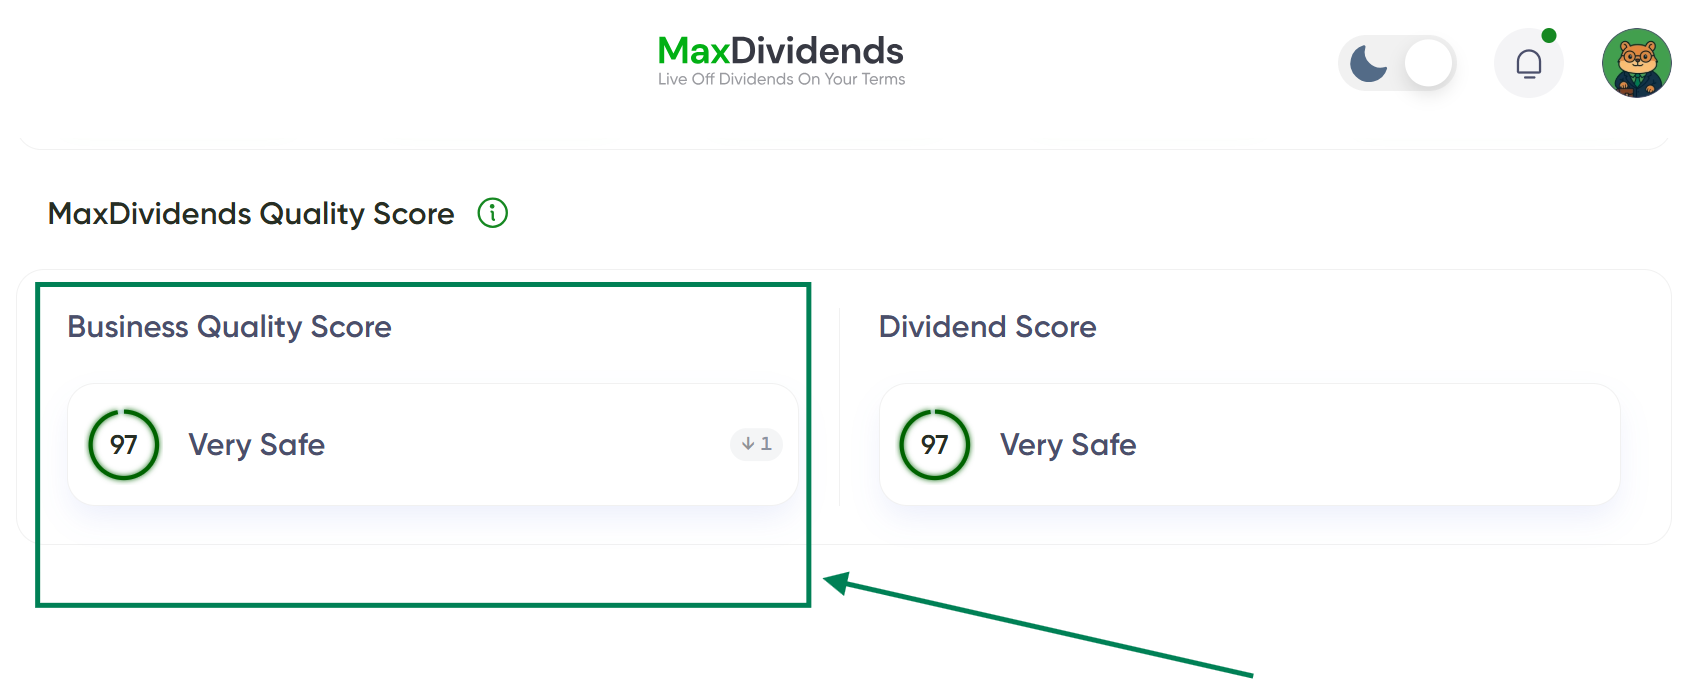
We analyzed 3,782 U.S. and international stocks to explore a simple question: Does business quality make a measurable difference in investment outcomes?
Using Business Quality Score (BQS), we compared companies scoring 80 or higher with those scoring below 80.
We also examined progressively lower score groups and constructed thousands of hypothetical 25-stock portfolios.
The findings suggest a consistent pattern: higher-quality businesses delivered stronger typical returns, a greater likelihood of positive performance, and substantially fewer catastrophic losses.

1. Downside Protection: The Biggest Difference
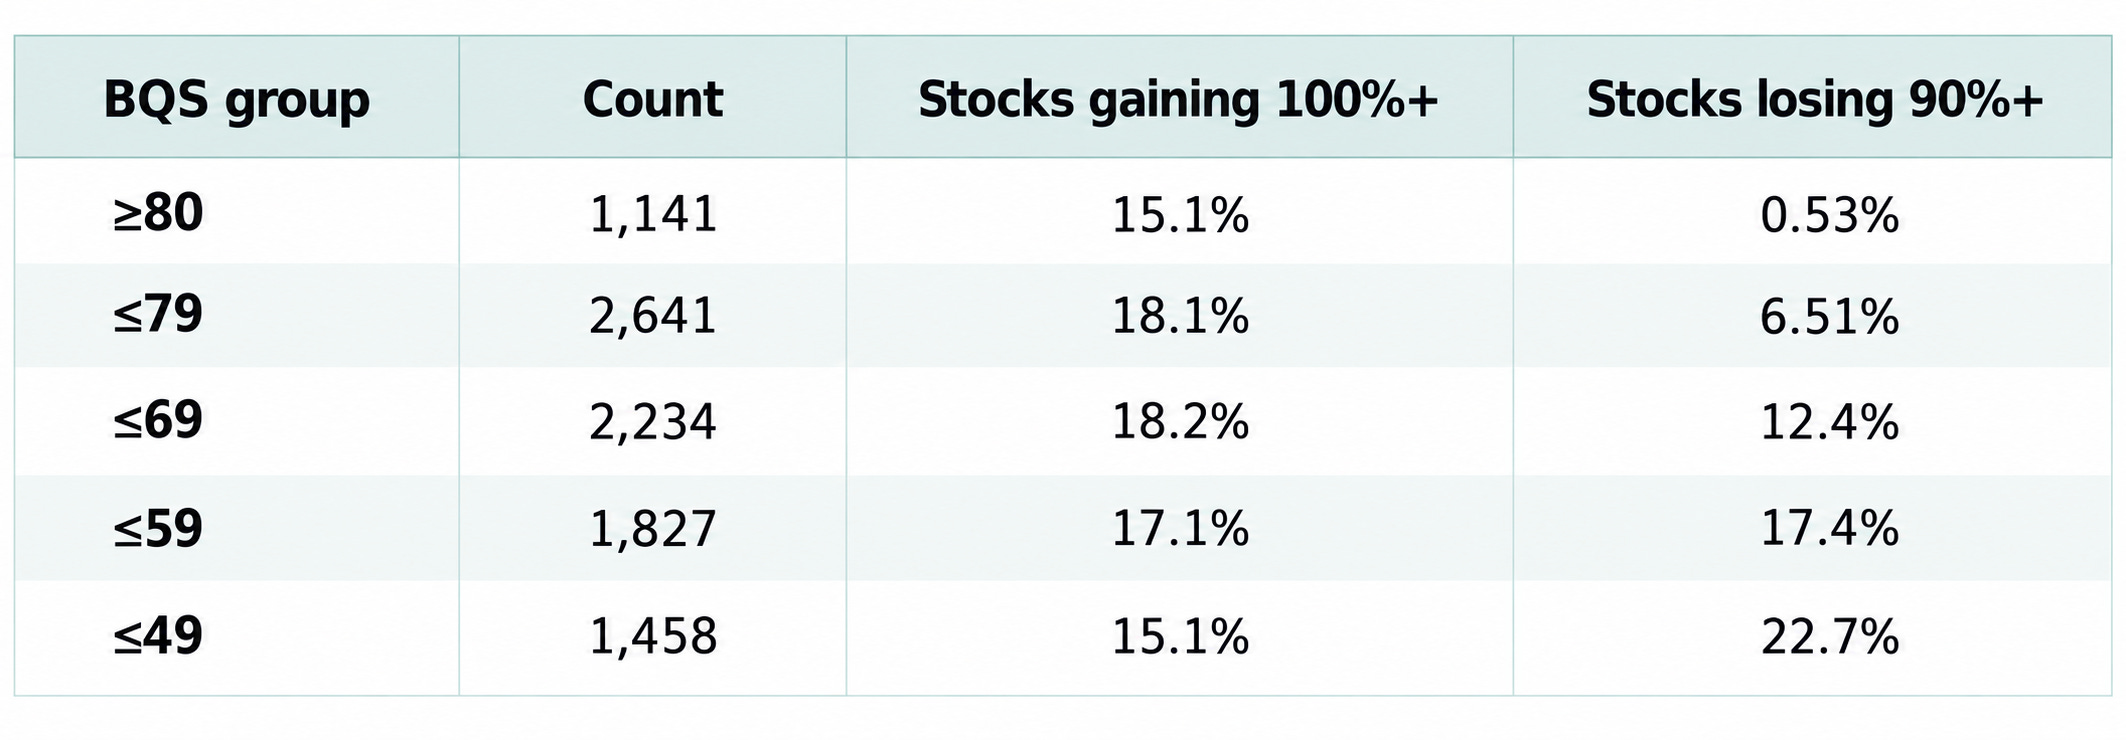
The strongest signal in our research wasn’t how many stocks doubled. It was how few high-quality companies suffered near-total capital destruction.
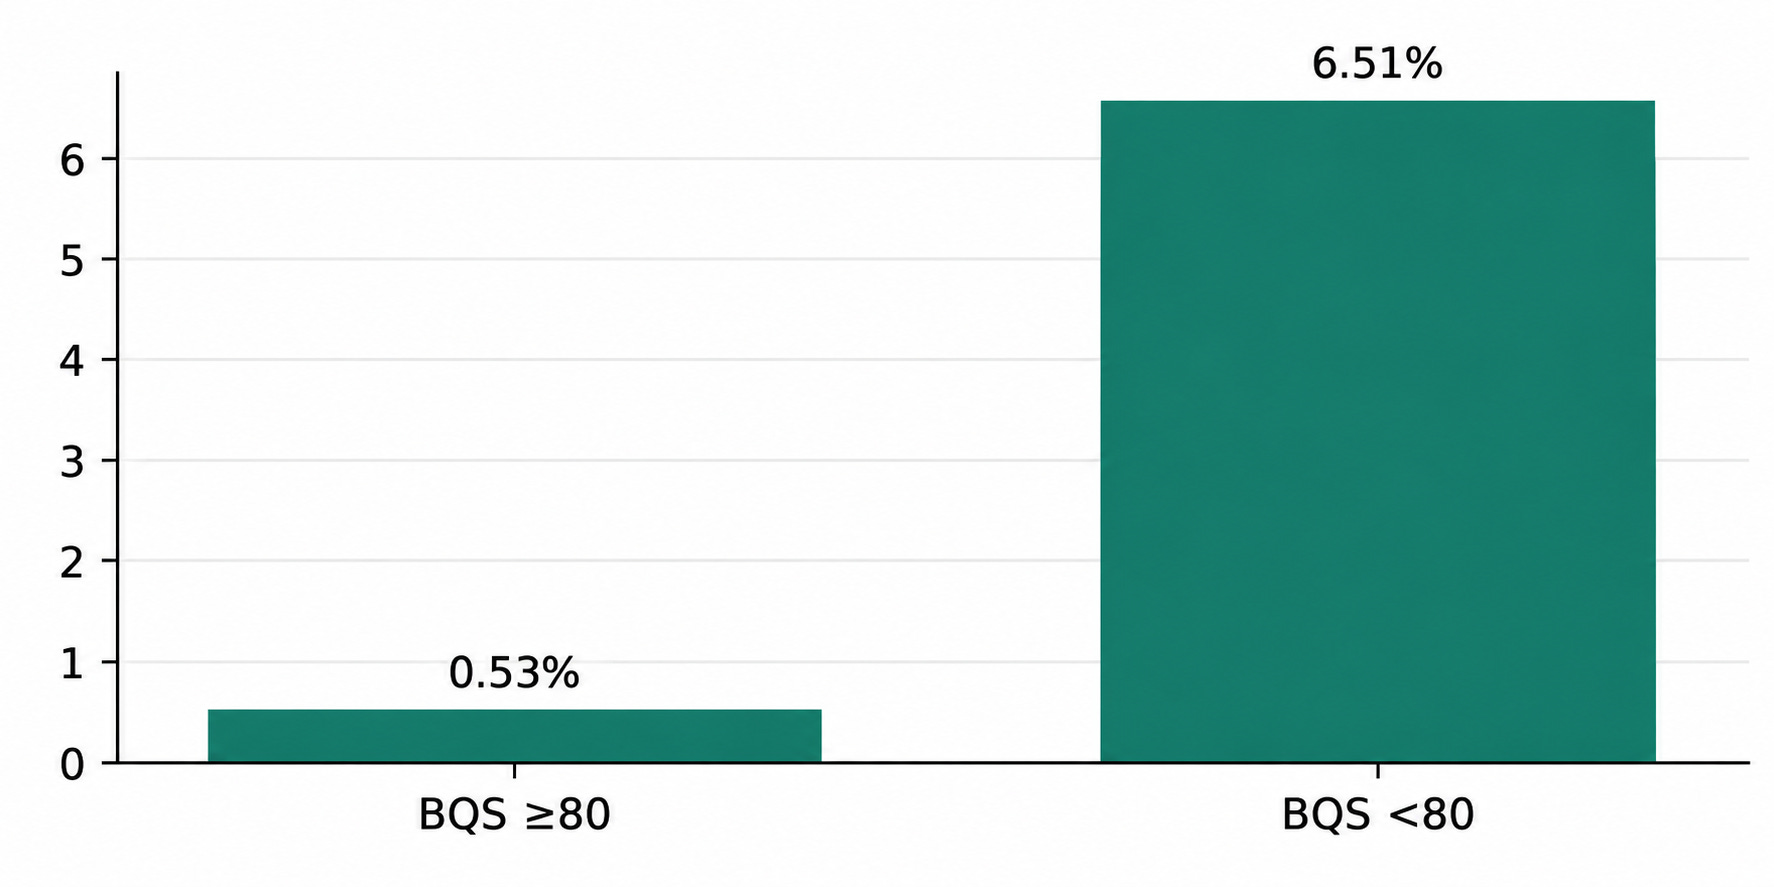
BQS ≥80: approximately 1 in 190 stocks lost 90% or more. BQS below 80: approximately 1 in 15 did.
Lower-quality stocks were about 12.4 times as likely to experience a near-total loss.
A single severe loser need not destroy a diversified portfolio. But repeatedly owning impaired businesses makes long-term compounding harder.
2. Rockets vs. Wipeouts: How Many Big Winners for Every Disaster?
Lower-quality stocks actually produced a slightly higher percentage of companies whose prices doubled. But their balance of big winners to near-total losers was far less favorable.
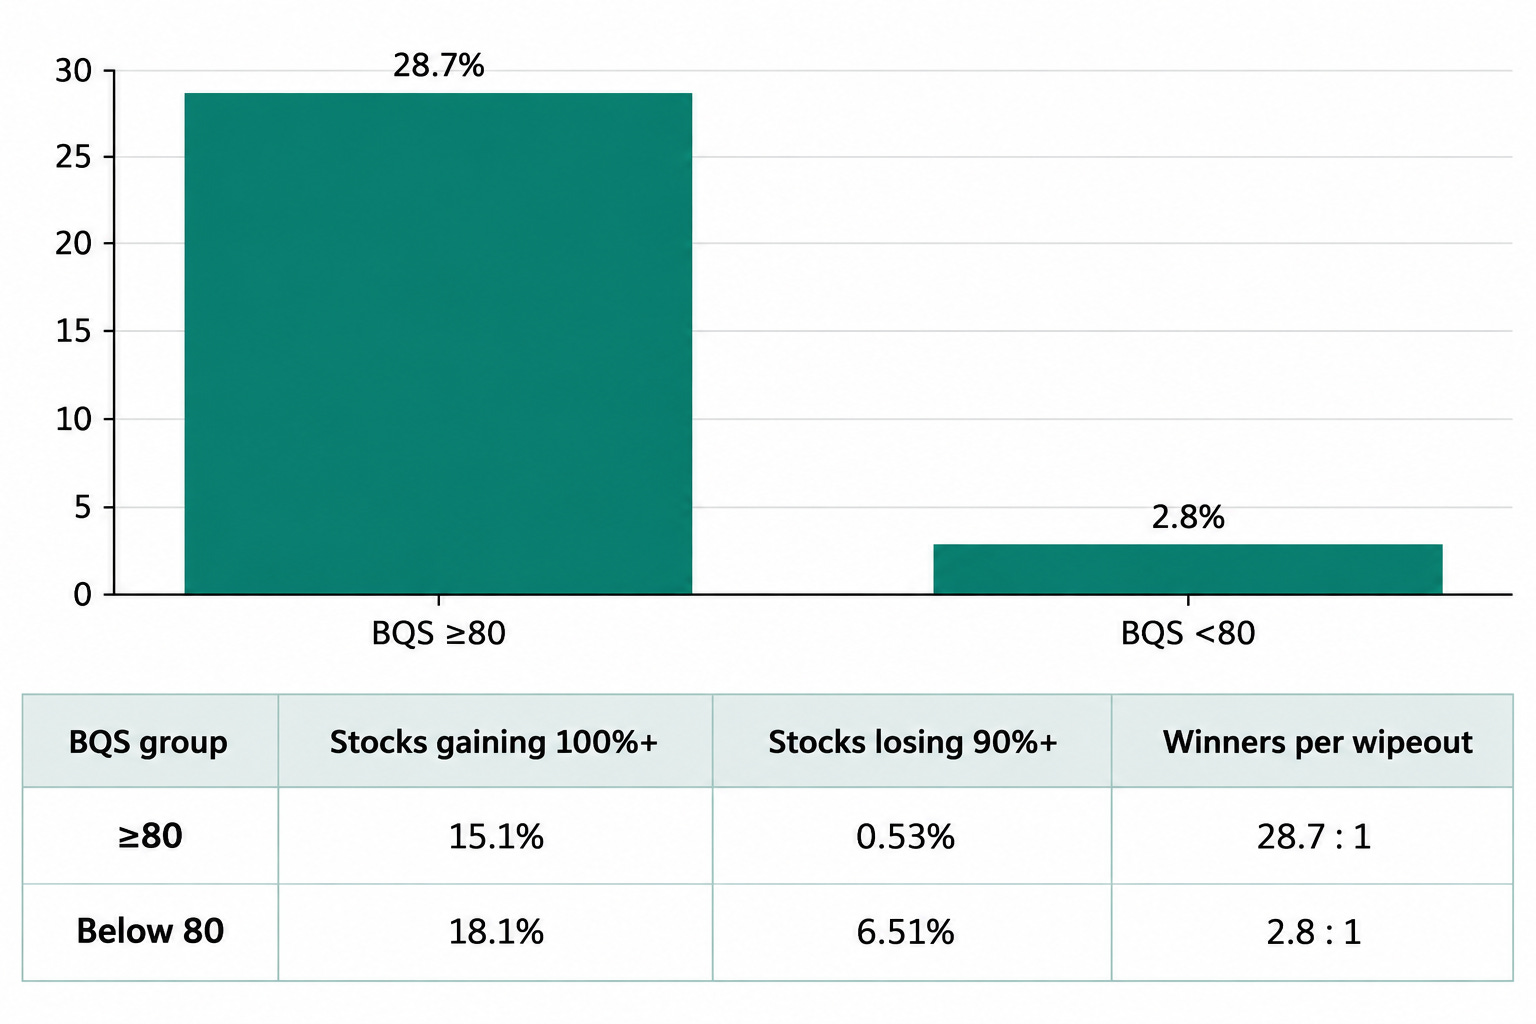
For every near-total loser, the higher-quality group had approximately 29 stocks that doubled. In the lower-quality group, that ratio was closer to three. This is a descriptive frequency ratio, not a formal risk-adjusted return measure.
3. Overall Performance: BQS ≥80 vs. Below 80
Downside protection matters, but did higher-quality stocks deliver better returns? In this sample, they did.
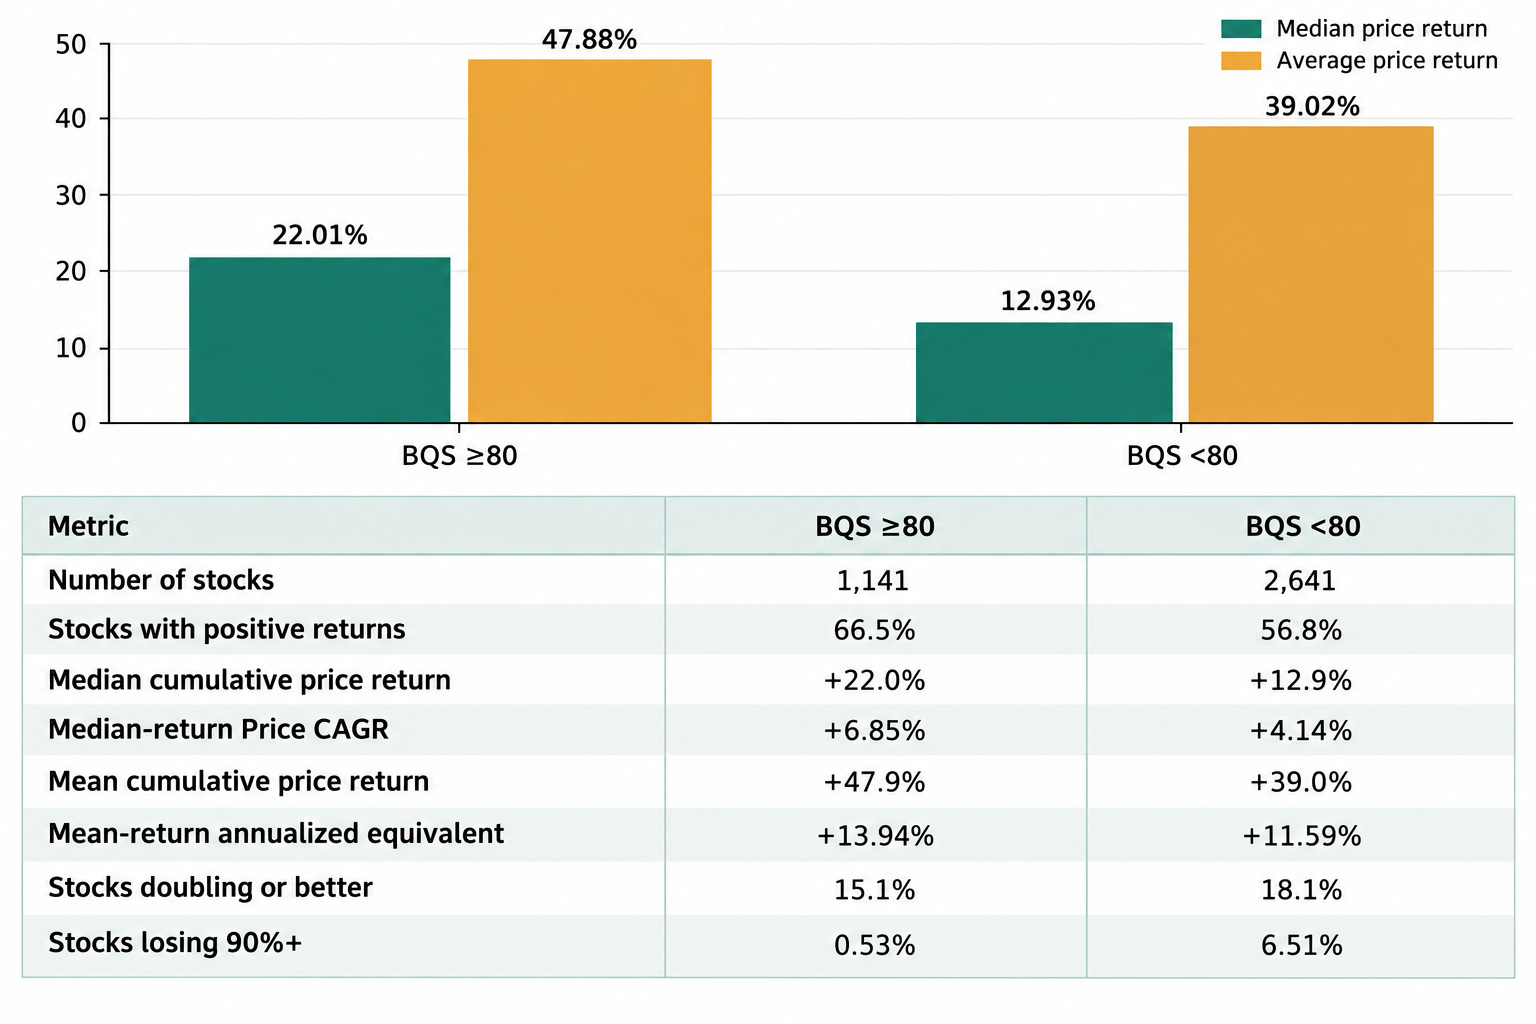
The typical BQS ≥80 stock gained approximately 22%, compared with 13% for stocks below 80: about nine percentage points more over the study period.
Higher-quality stocks were also more likely to finish positive: 66.5% versus 56.8%.
Price CAGR figures annualize the displayed cumulative returns using an approximate three-year holding period; the annualized mean-return equivalent is not the mean of stock-level CAGRs. Dividends are excluded.
4. How Performance Changes as Business Quality Declines
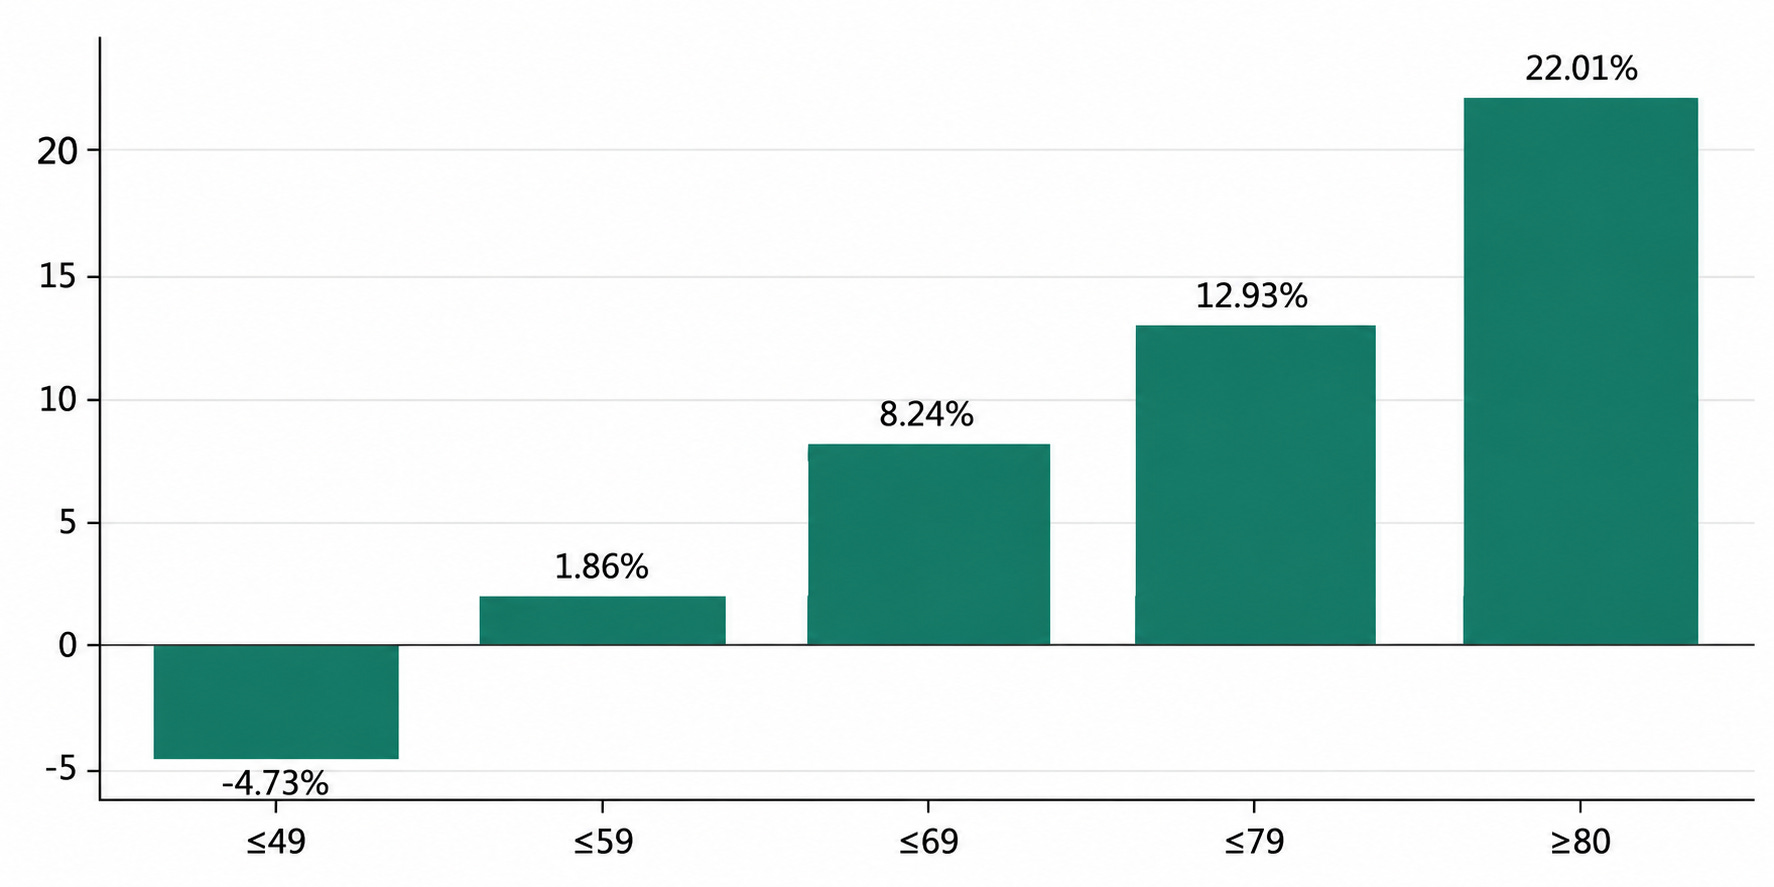
We examined progressively lower BQS thresholds to see how investment outcomes changed as quality deteriorated.
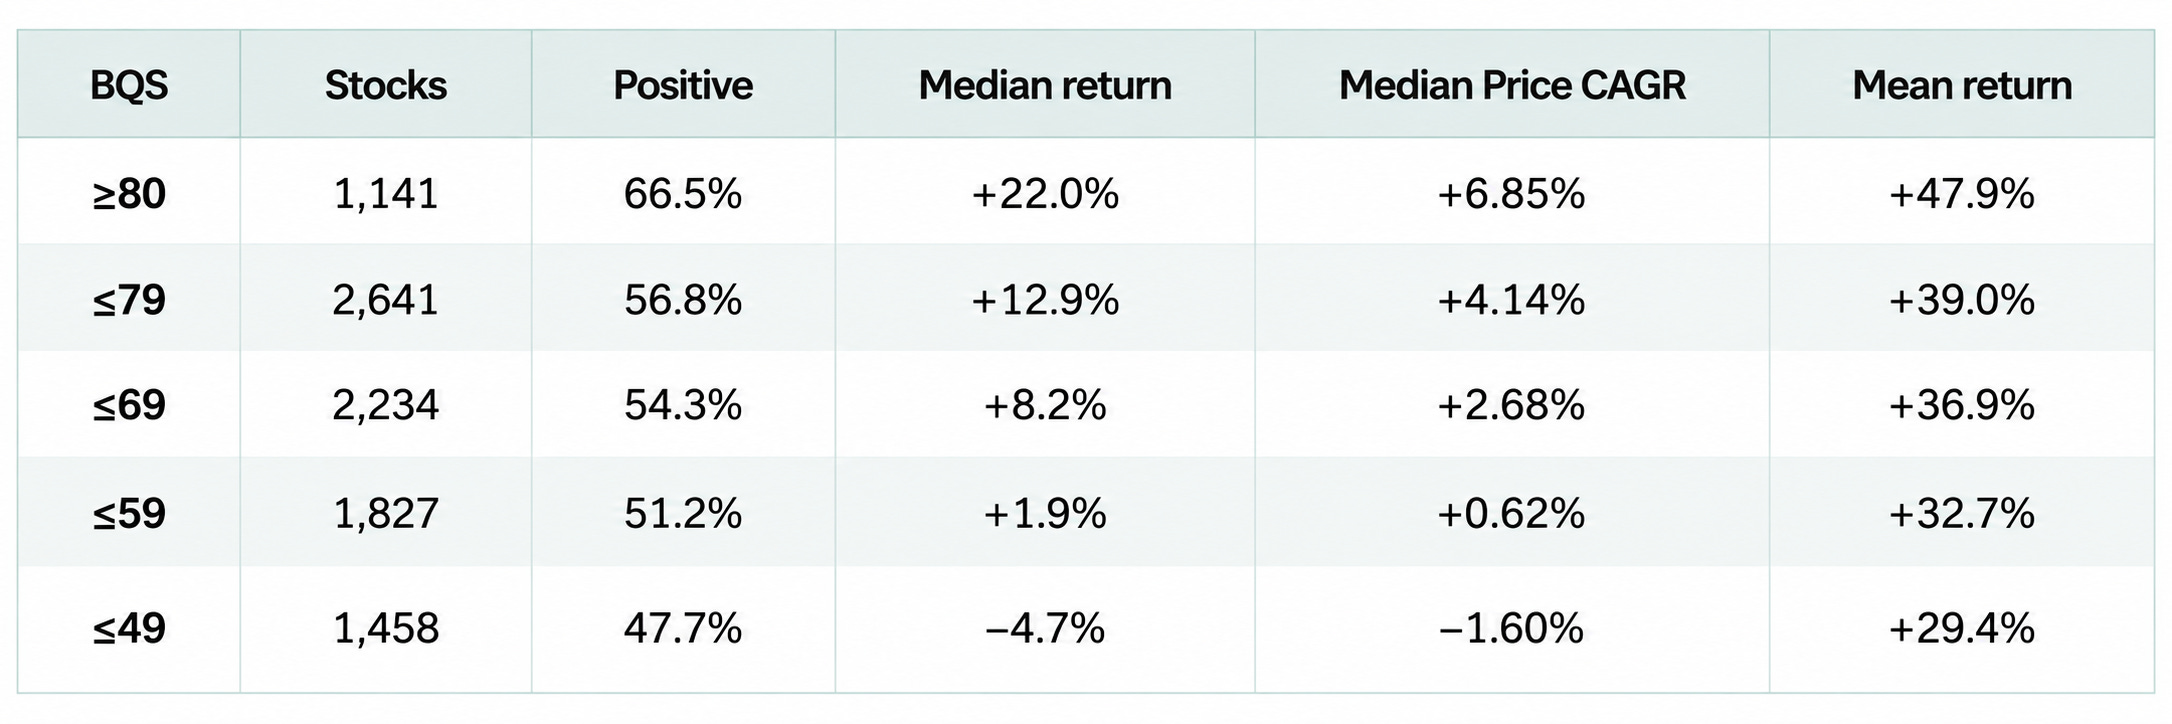
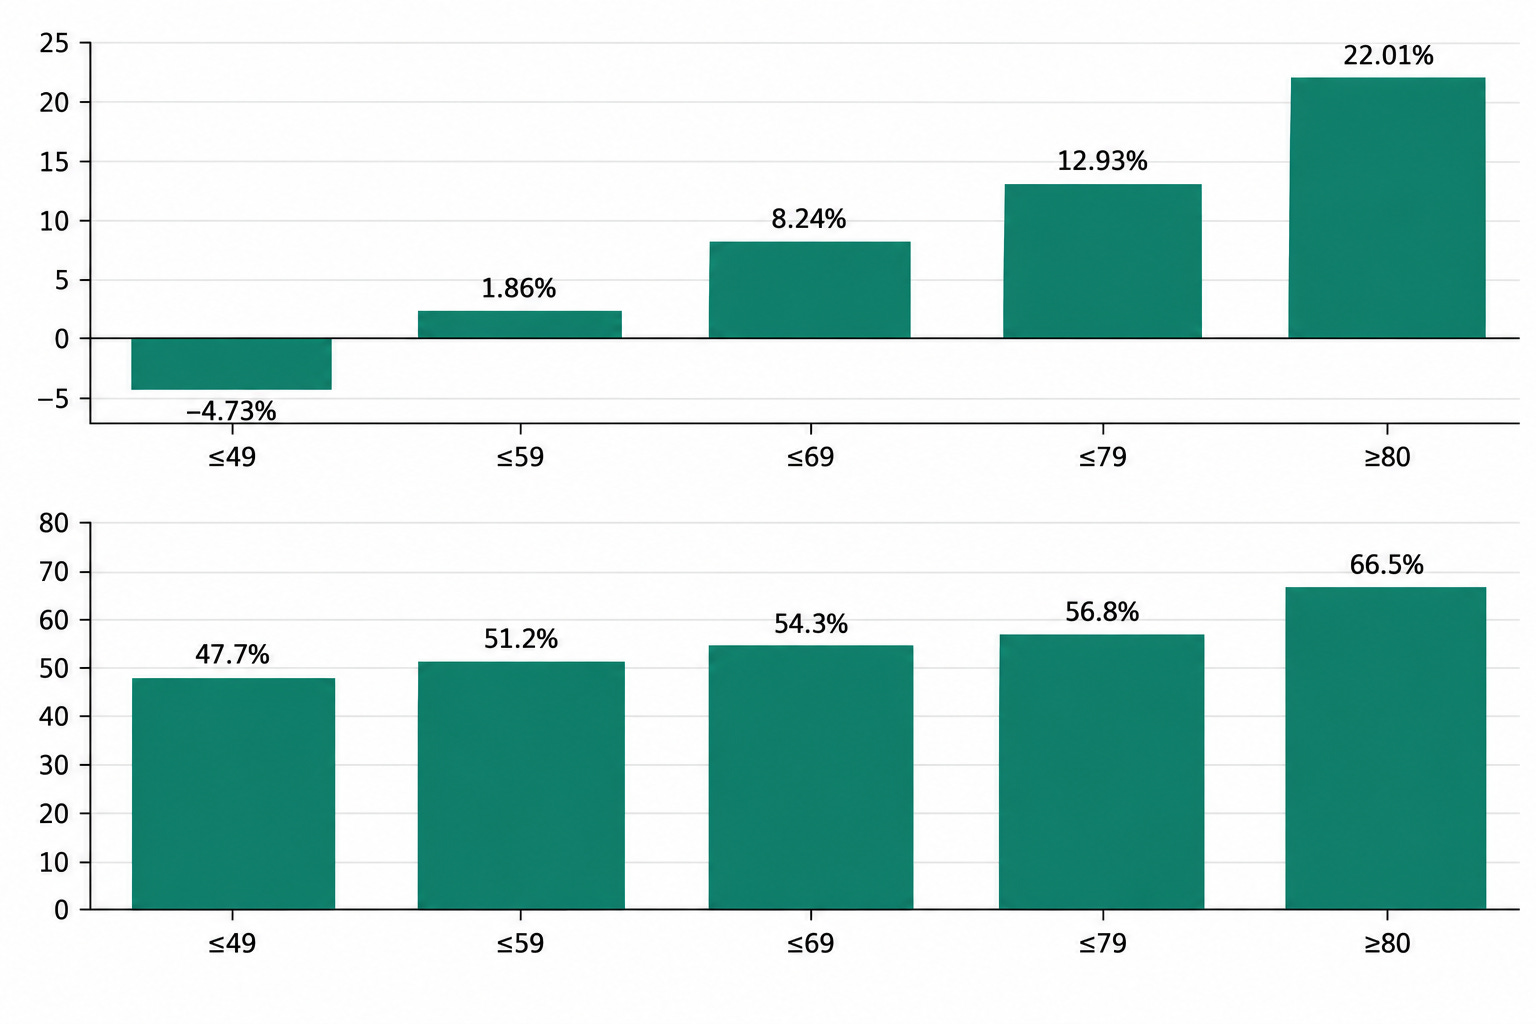
As business quality declined, the typical stock’s performance deteriorated.
At BQS ≤49, the median stock lost money.
At BQS ≥80, the median stock gained approximately 22%.
These are overlapping cumulative groups, not independent score buckets.
5. What Happens When We Build 25-Stock Portfolios?
We constructed 1,000 randomly selected, equal-weighted portfolios of 25 stocks for each BQS group: 5,000 simulated portfolios in total. Each portfolio held its initial stocks without rebalancing or replacement.
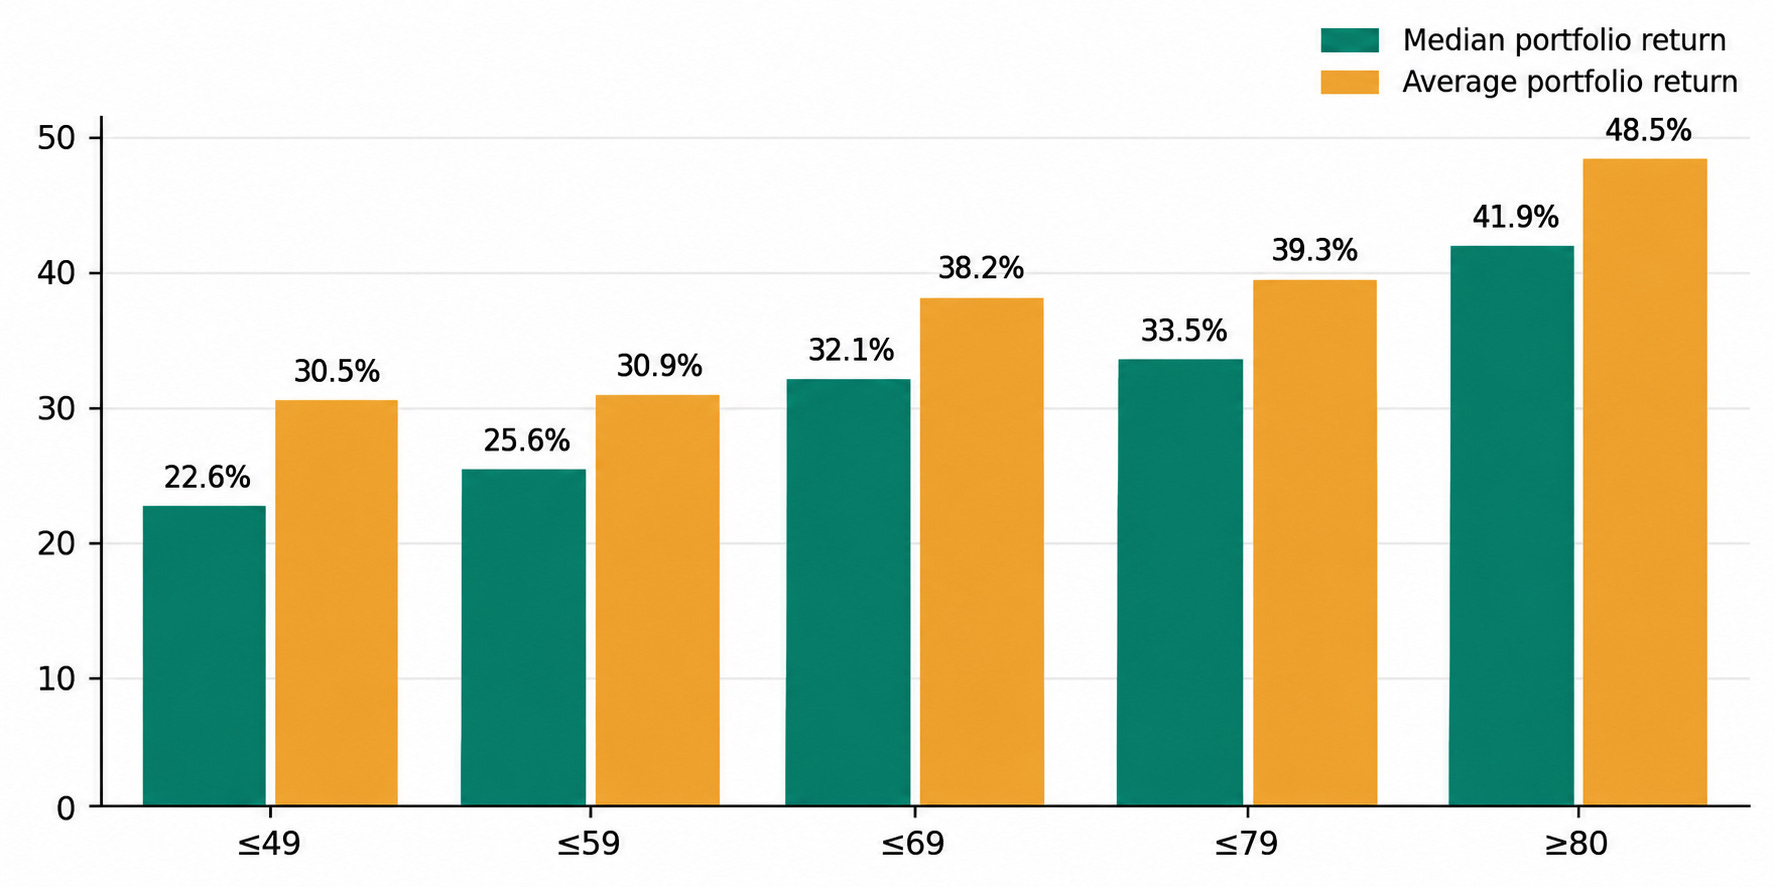
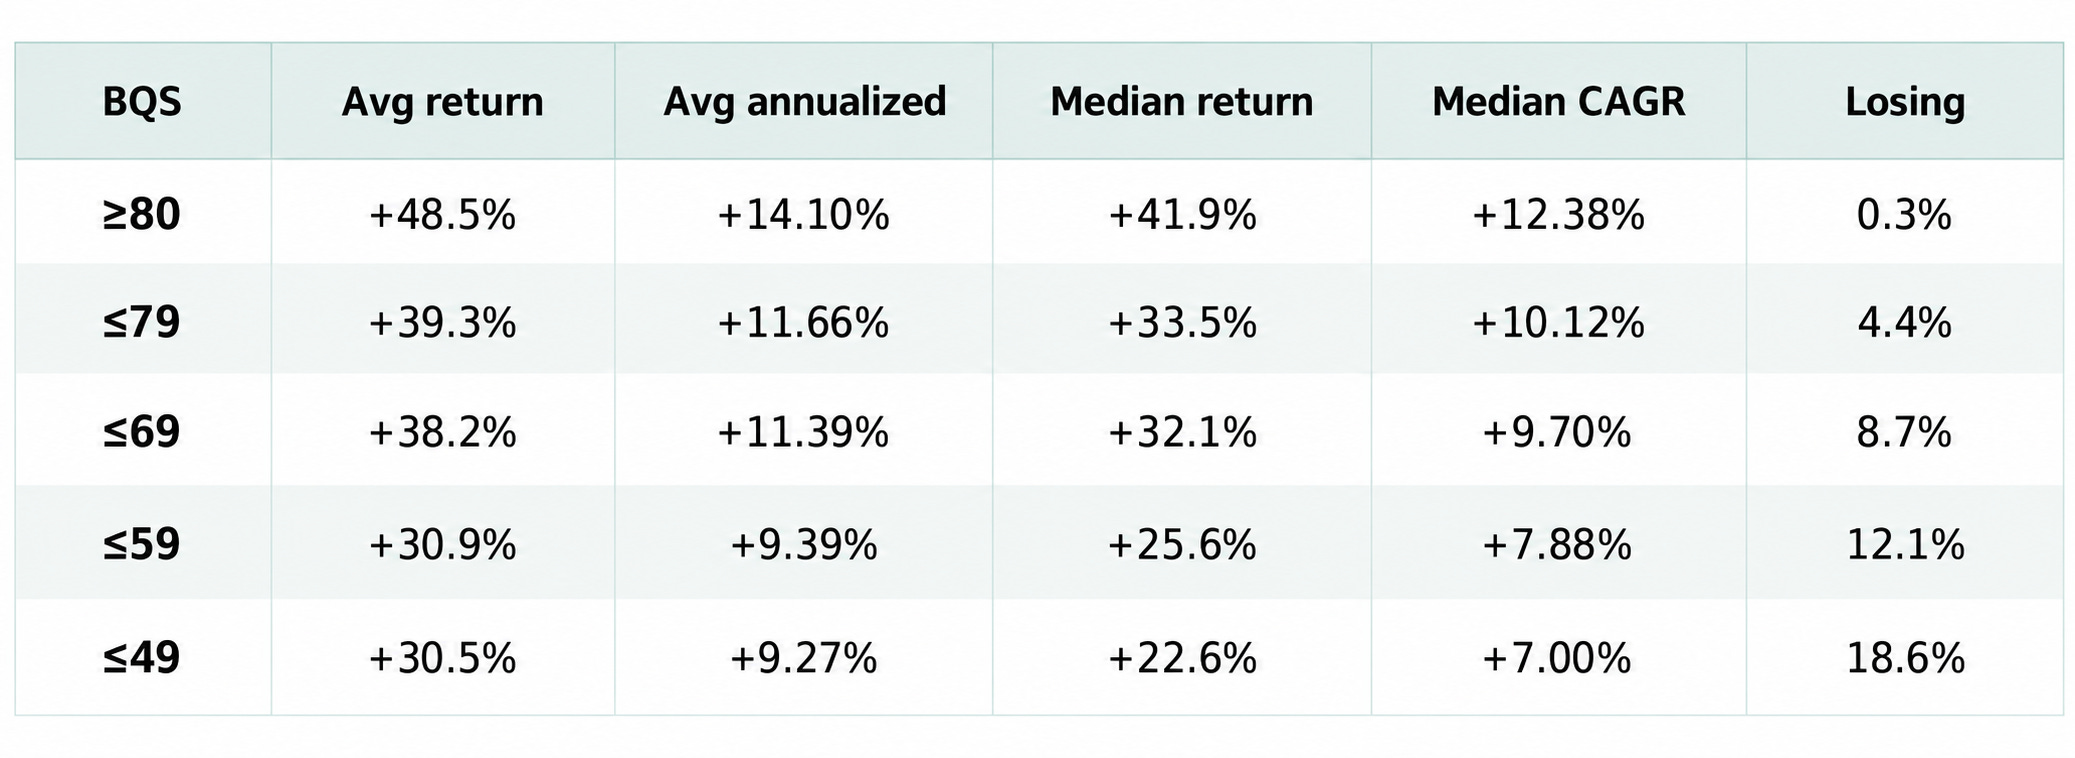
The BQS ≥80 portfolios had the strongest average and median returns.
Just three of their 1,000 simulated portfolios finished in the red, compared with 44 of the BQS ≤79 portfolios.
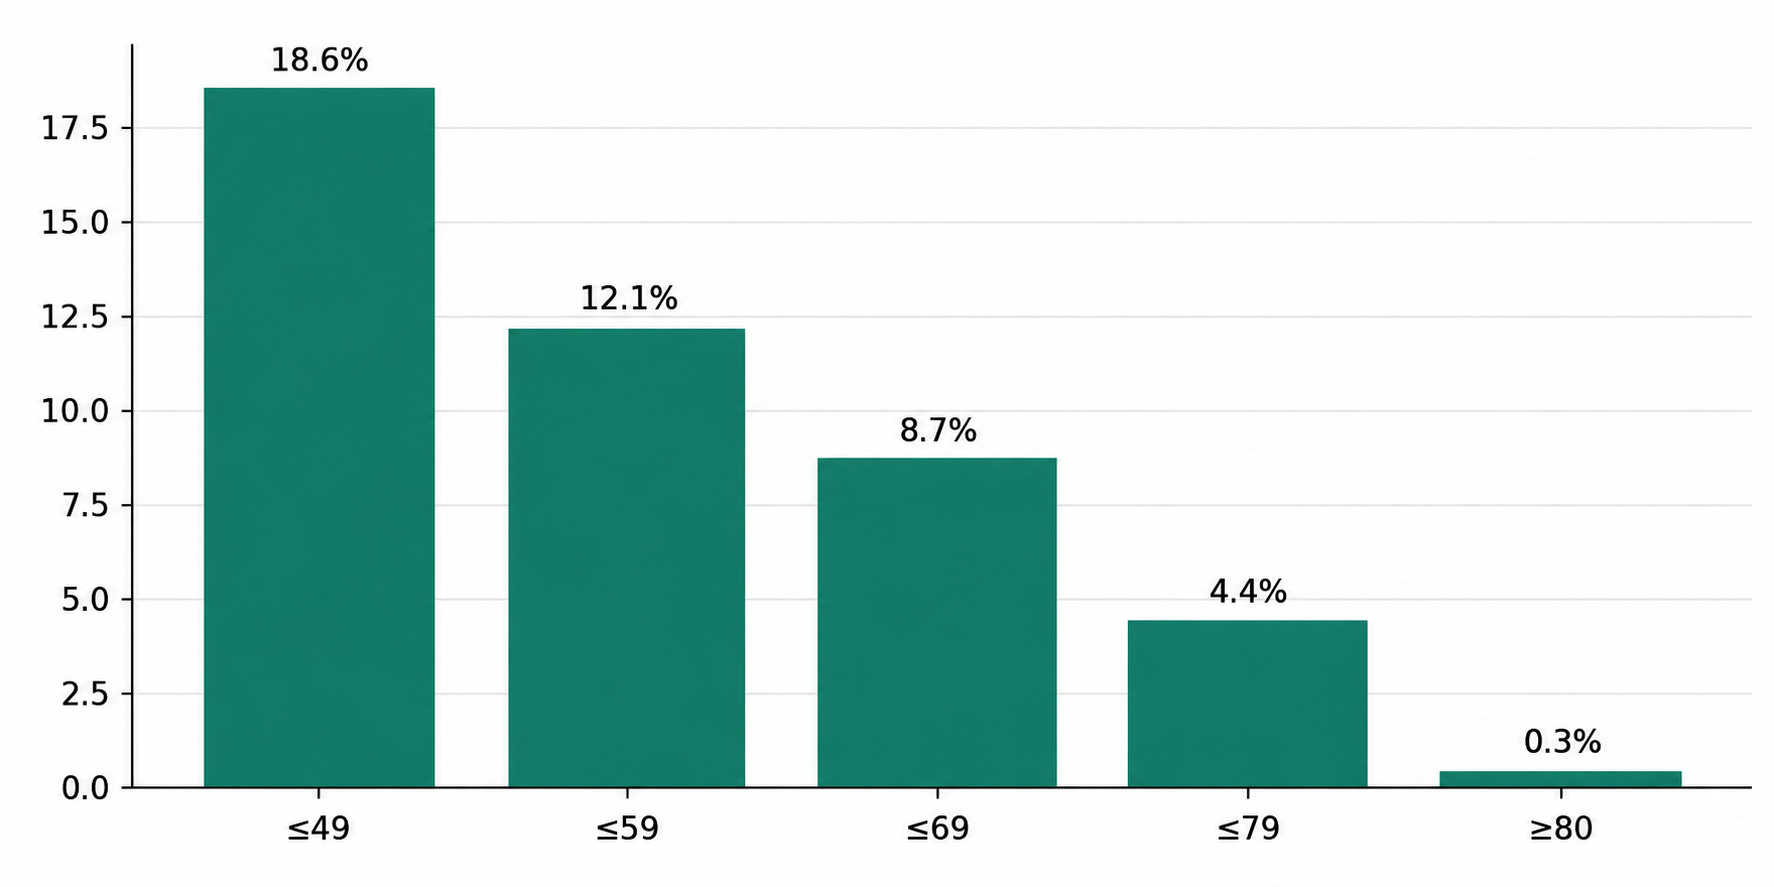
That is approximately 14.7 times as many losing portfolios in the lower-quality group. Historical resampling of one stock universe does not establish future probabilities.
6. The Worst 5% of Portfolios
Average performance can conceal a painful downside tail. We therefore examined the fifth-percentile portfolio outcome.
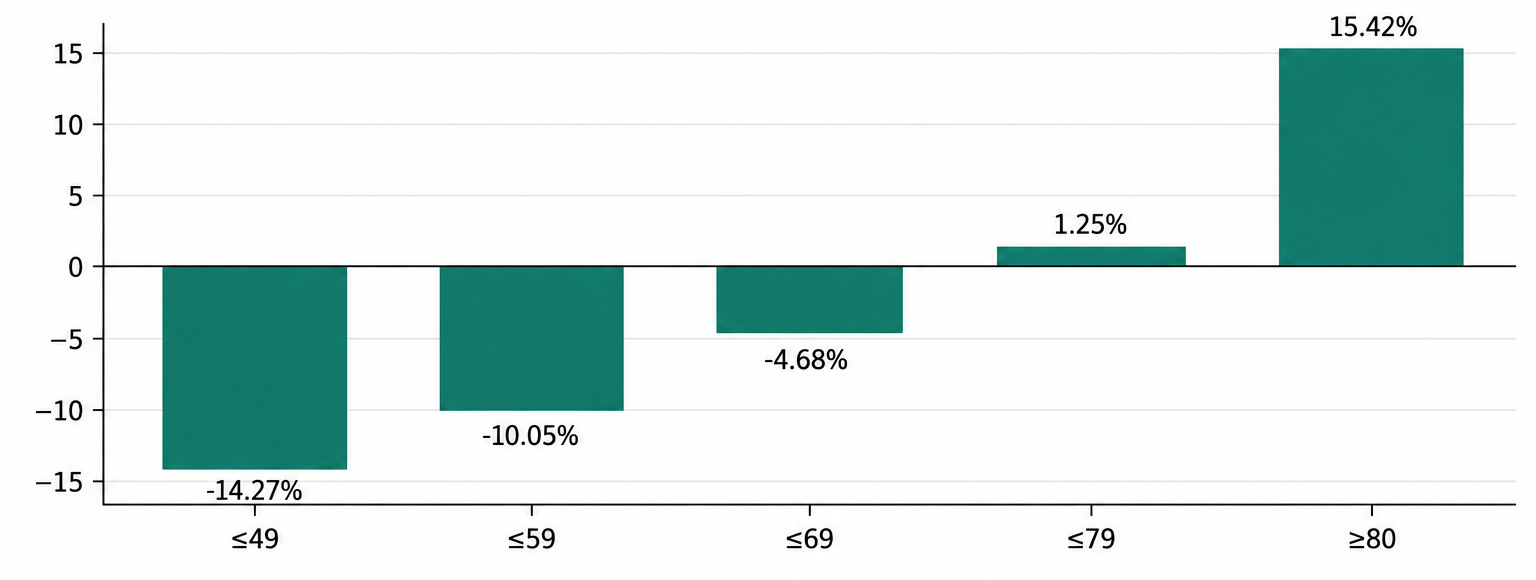
The BQS ≥80 group had a fifth-percentile portfolio return of +15.4%, compared with +1.3% below 80 and −14.3% for BQS ≤49.
Disappointing outcomes were considerably less severe in the high-quality group.
7. How Often Does a Portfolio Contain a Near-Total Loser?
How often did at least one of the 25 stocks in a simulated portfolio lose 90% or more?
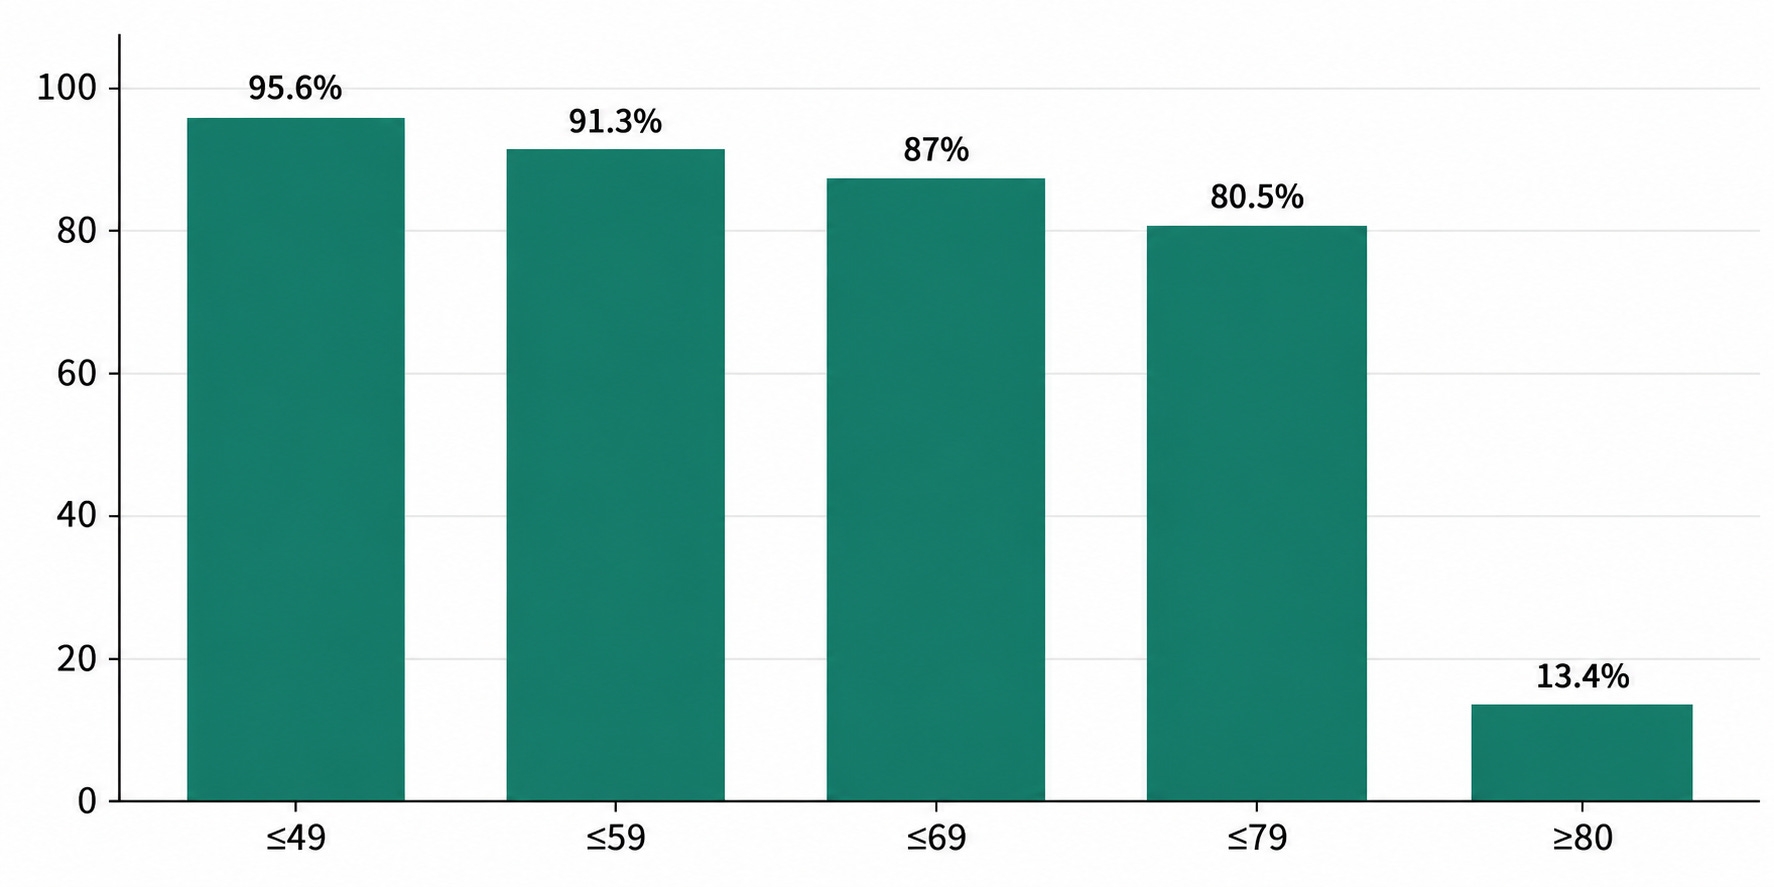
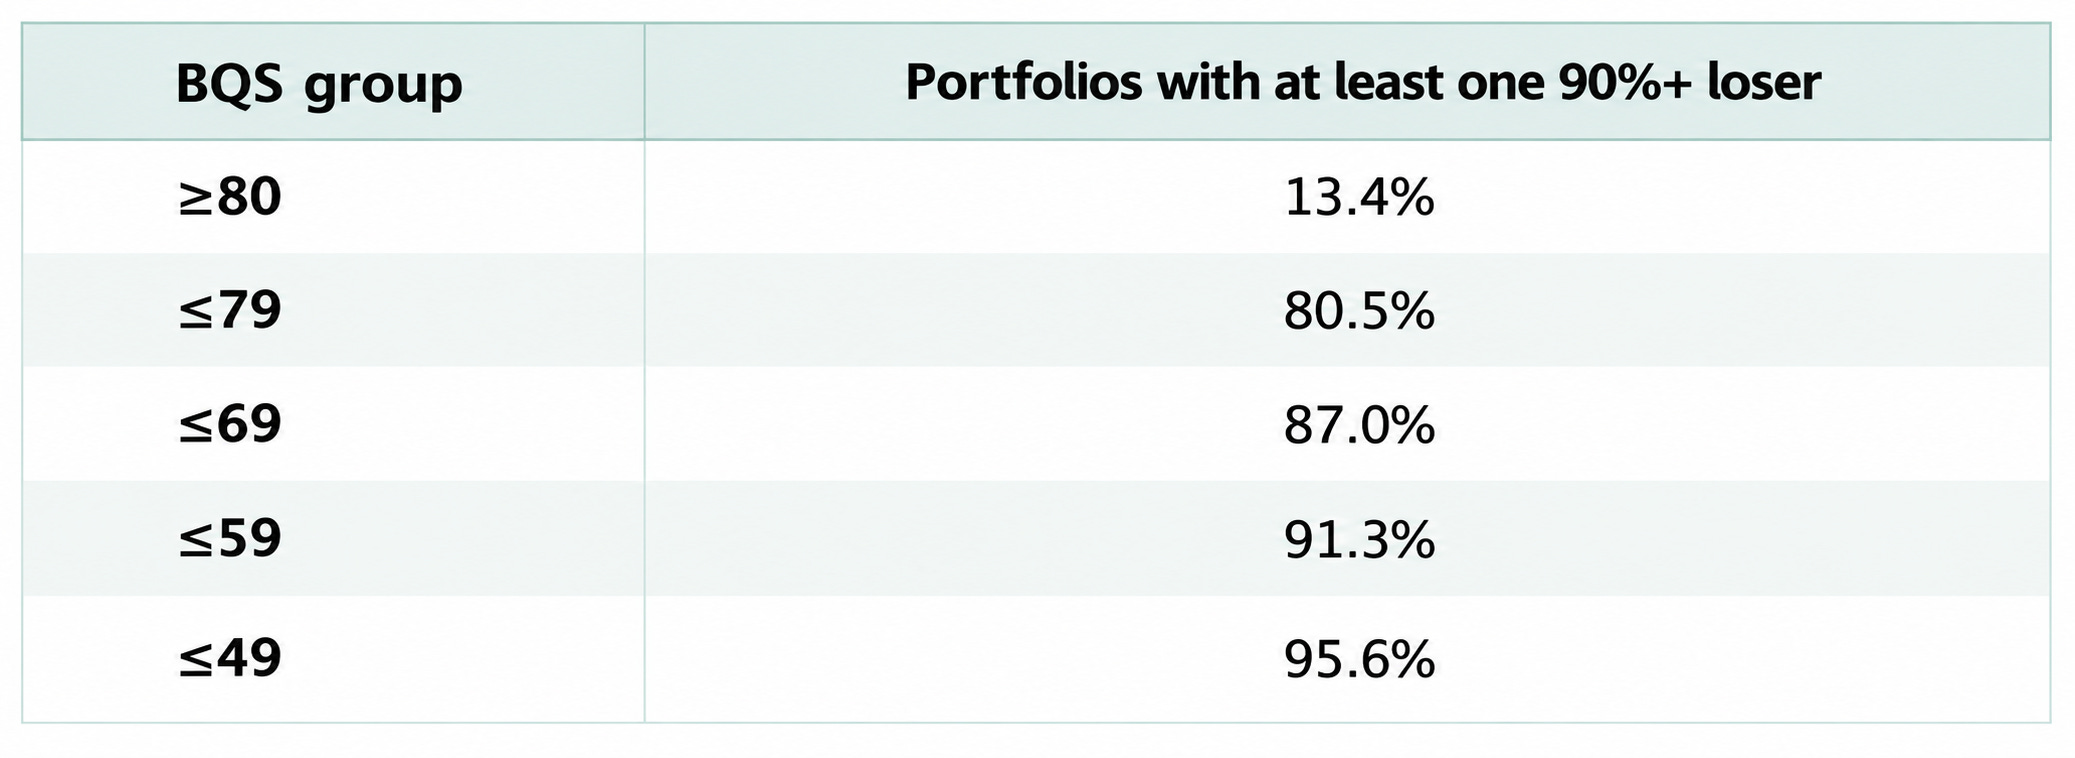
For BQS ≤79, approximately 805 out of 1,000 portfolios contained a catastrophic stock. For BQS ≥80, that figure was 134. This does not mean the entire portfolio lost 90%; it means at least one holding did.
8. Final Thoughts: What the BQS Results Really Tell Us
There are a few important things worth highlighting before drawing conclusions from this research.
First, we did not find a clear return advantage from requiring BQS ≥90 instead of BQS ≥80. A higher score did not automatically translate into better stock performance in this sample.
What stood out much more clearly was the difference between companies scoring 80 or higher and those below 80. Across the dataset, BQS ≥80 delivered stronger typical returns and substantially fewer severe losses. And as scores declined, investment outcomes generally got worse.
That does not mean there are no great companies or promising opportunities among lower-scoring businesses. There absolutely can be.
It means those investments deserve a much more careful approach: understanding financial position, competitive advantages, risks, and potential for improvement.
The cost of being wrong can be dramatically higher.
One Important Limitation:
Time Our dataset spans approximately four calendar years, from 2023 through 2026. That is relatively short for long-term investing and insufficient for definitive conclusions across market cycles, recessions, and different economic environments.
At the same time, the patterns provide useful early guidance. BQS ≥80 may be a practical threshold for identifying stronger businesses, and declining scores are associated with increasingly unfavorable outcomes in this sample.
These are early findings, not final conclusions.
Where We Go From Here
This is an ongoing research project. We will continue collecting data, tracking company performance, and expanding the historical sample. Our plan is to update the study once a year as new results become available.
Over time, that will help us determine whether the observed relationships persist across different market conditions. The goal is not to prove BQS is a perfect formula; it is to understand how business quality relates to long-term investment outcomes using data rather than assumptions.
Good businesses can exist at any score. But the lower the quality score, the more important it becomes to know exactly what you are buying—and why. BQS Research | 2023–2026
— MaxDividends Team