


Dividend Score
MaxDividends Interim Study, 2023–2026
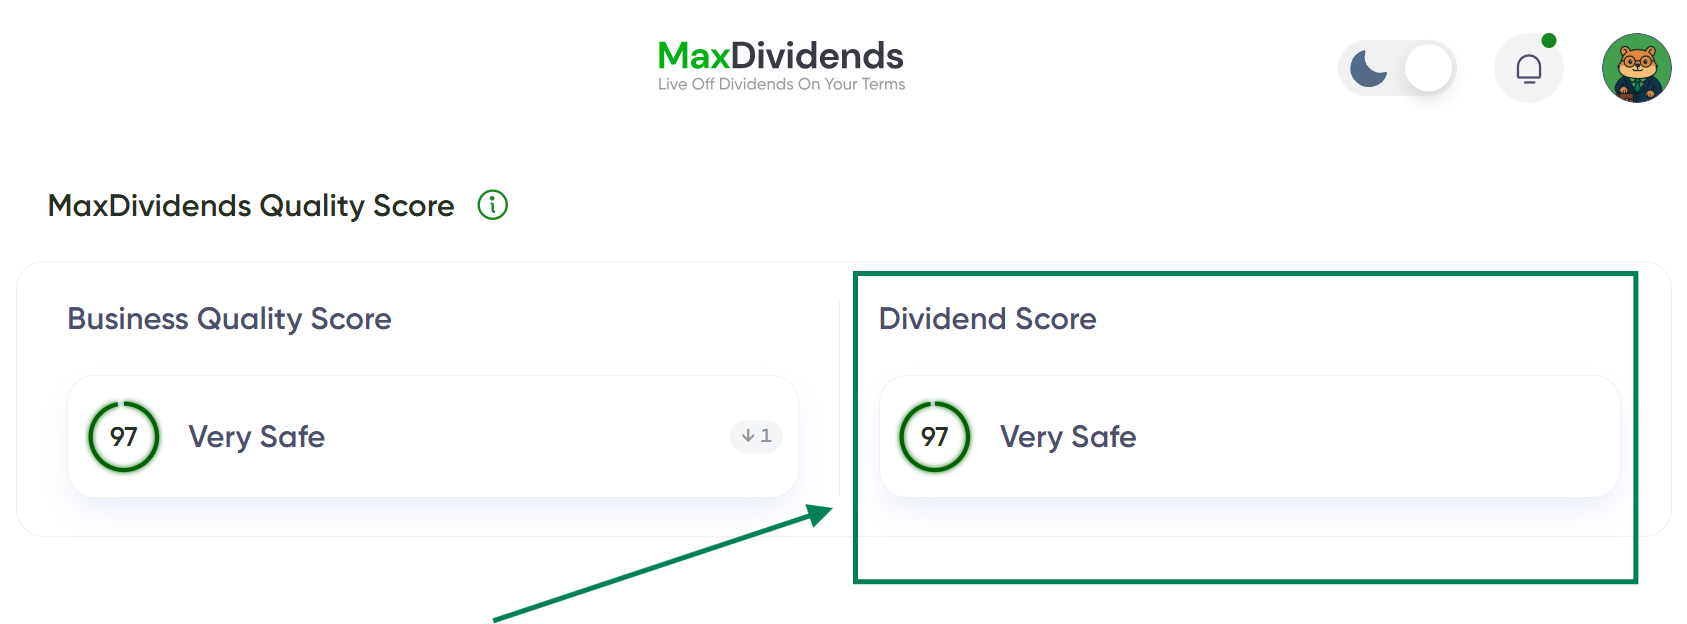
In late 2022, MaxDividends began recording and tracking our proprietary metrics within the project. Since then, we have collected data as the metrics are updated, building a history of scores recorded during our ongoing work.
We now have data covering the beginning of 2023 through October 2026. We used this history to conduct our Dividend Score study and plan to update it annually using the same methodology.
We set out to examine how Dividend Score relates to two outcomes that matter to dividend investors: payout stability and growth in dividend income.
The study has three sections: the U.S. market, global markets excluding the U.S., and combined results. Each section compares three groups: Dividend Score 90+, Dividend Score 80+, and Dividend Score 80−.
Long Story Short: What Does a Dividend Score Mean for Your Money?
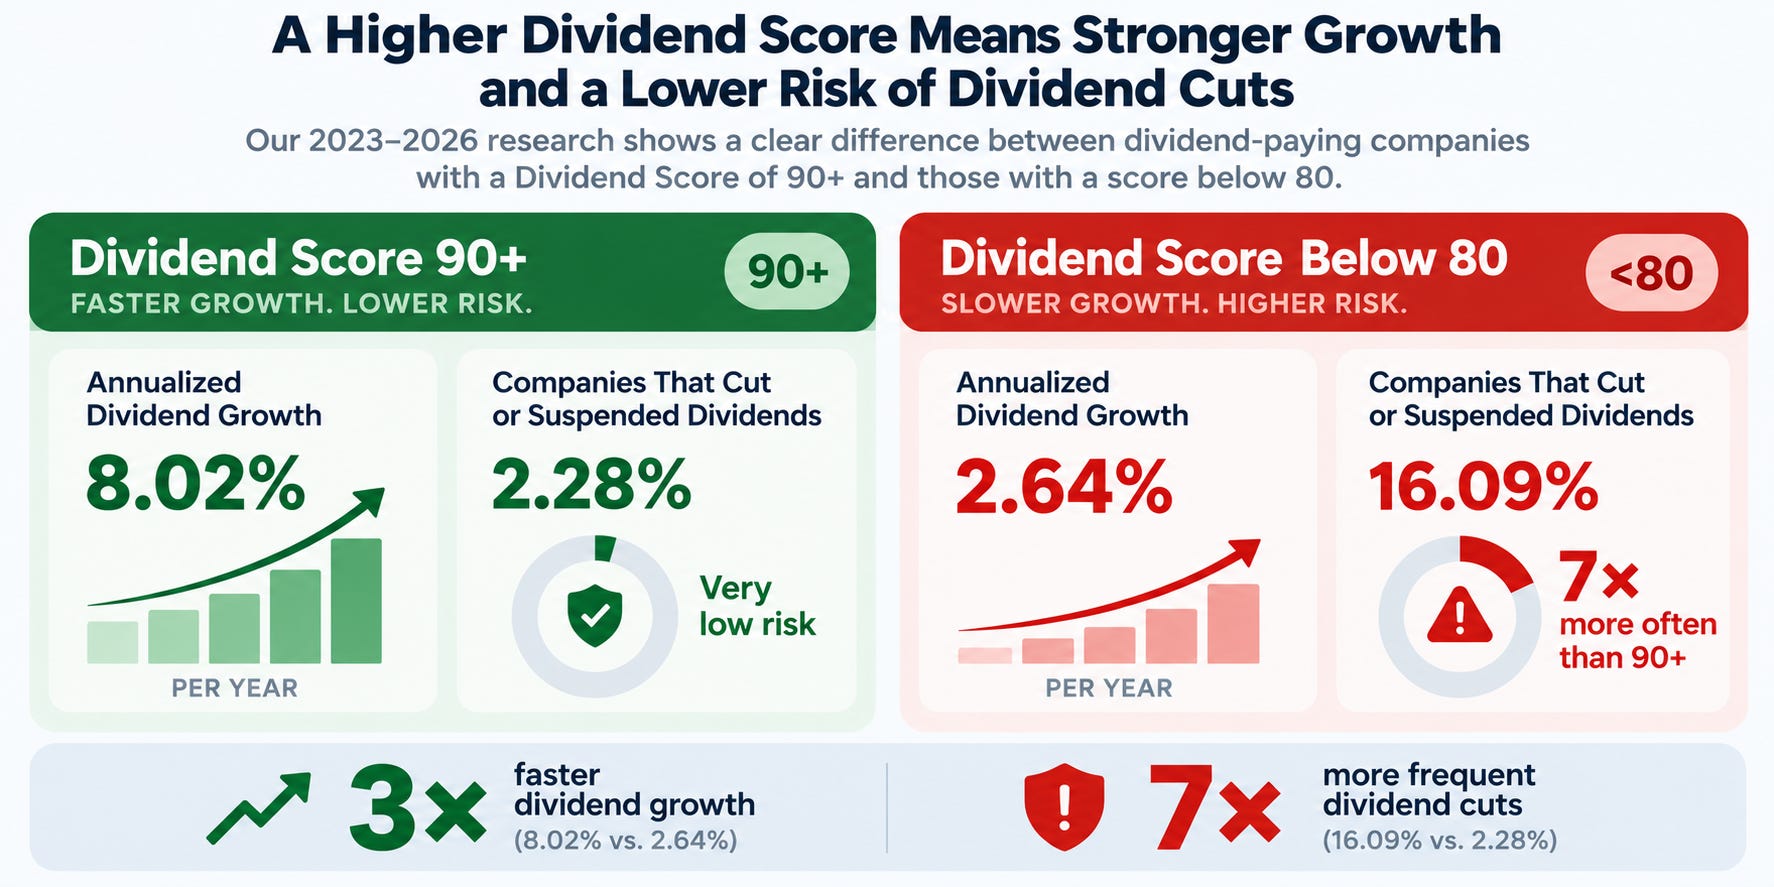
Our 2023–2026 research revealed two compelling advantages of choosing dividend-paying companies with a Dividend Score of 90 or higher.
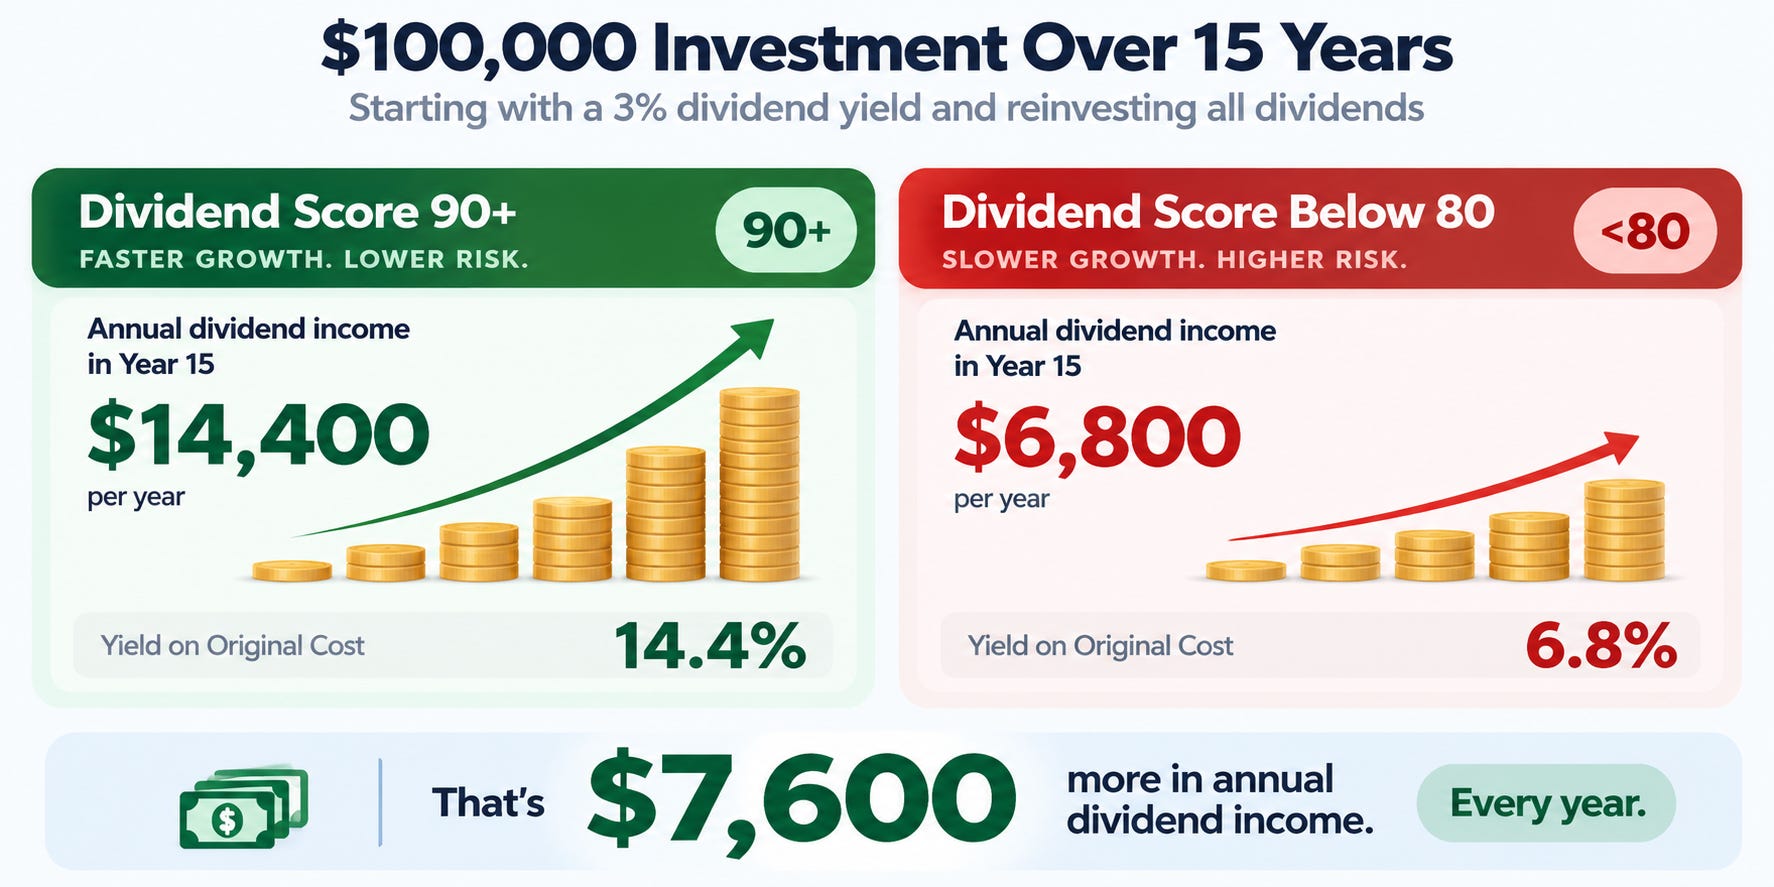
But what could that mean for your money?
A MaxDividends Study of U.S. and International Dividend Stocks
Dividend Score
U.S. Market
How We Conducted the Study
We selected U.S. companies that had a track record of at least 10 consecutive years of annual dividend increases as of the beginning of 2023. To be included, companies also needed to have Dividend Score data available for all four years: 2023, 2024, 2025, and 2026.
The initial sample contained 395 companies.
For the comparison, we used three initial groups without rounding the scores:
Dividend Score 90+: companies with scores of 90 or higher.
Dividend Score 80+: companies with scores of 80 or higher.
Dividend Score 80−: companies with scores of 79 or lower.
Companies with scores of 90 or higher also belong to the 80+ group. We show them separately to examine whether a higher initial score is associated with different results. The company counts for these two groups should not be added together.
We then tracked regular dividends from January 1, 2023, through October 7, 2026: how many companies reduced or eliminated their payouts and how much their dividends grew.
We also accounted for changes in the score. If a company initially had a score of 80 or higher, its score subsequently fell below 80, and it later cut its dividend, we reassigned it to the 80− group. If that company’s initial score was 90 or higher, it was also removed from the final 90+ group.
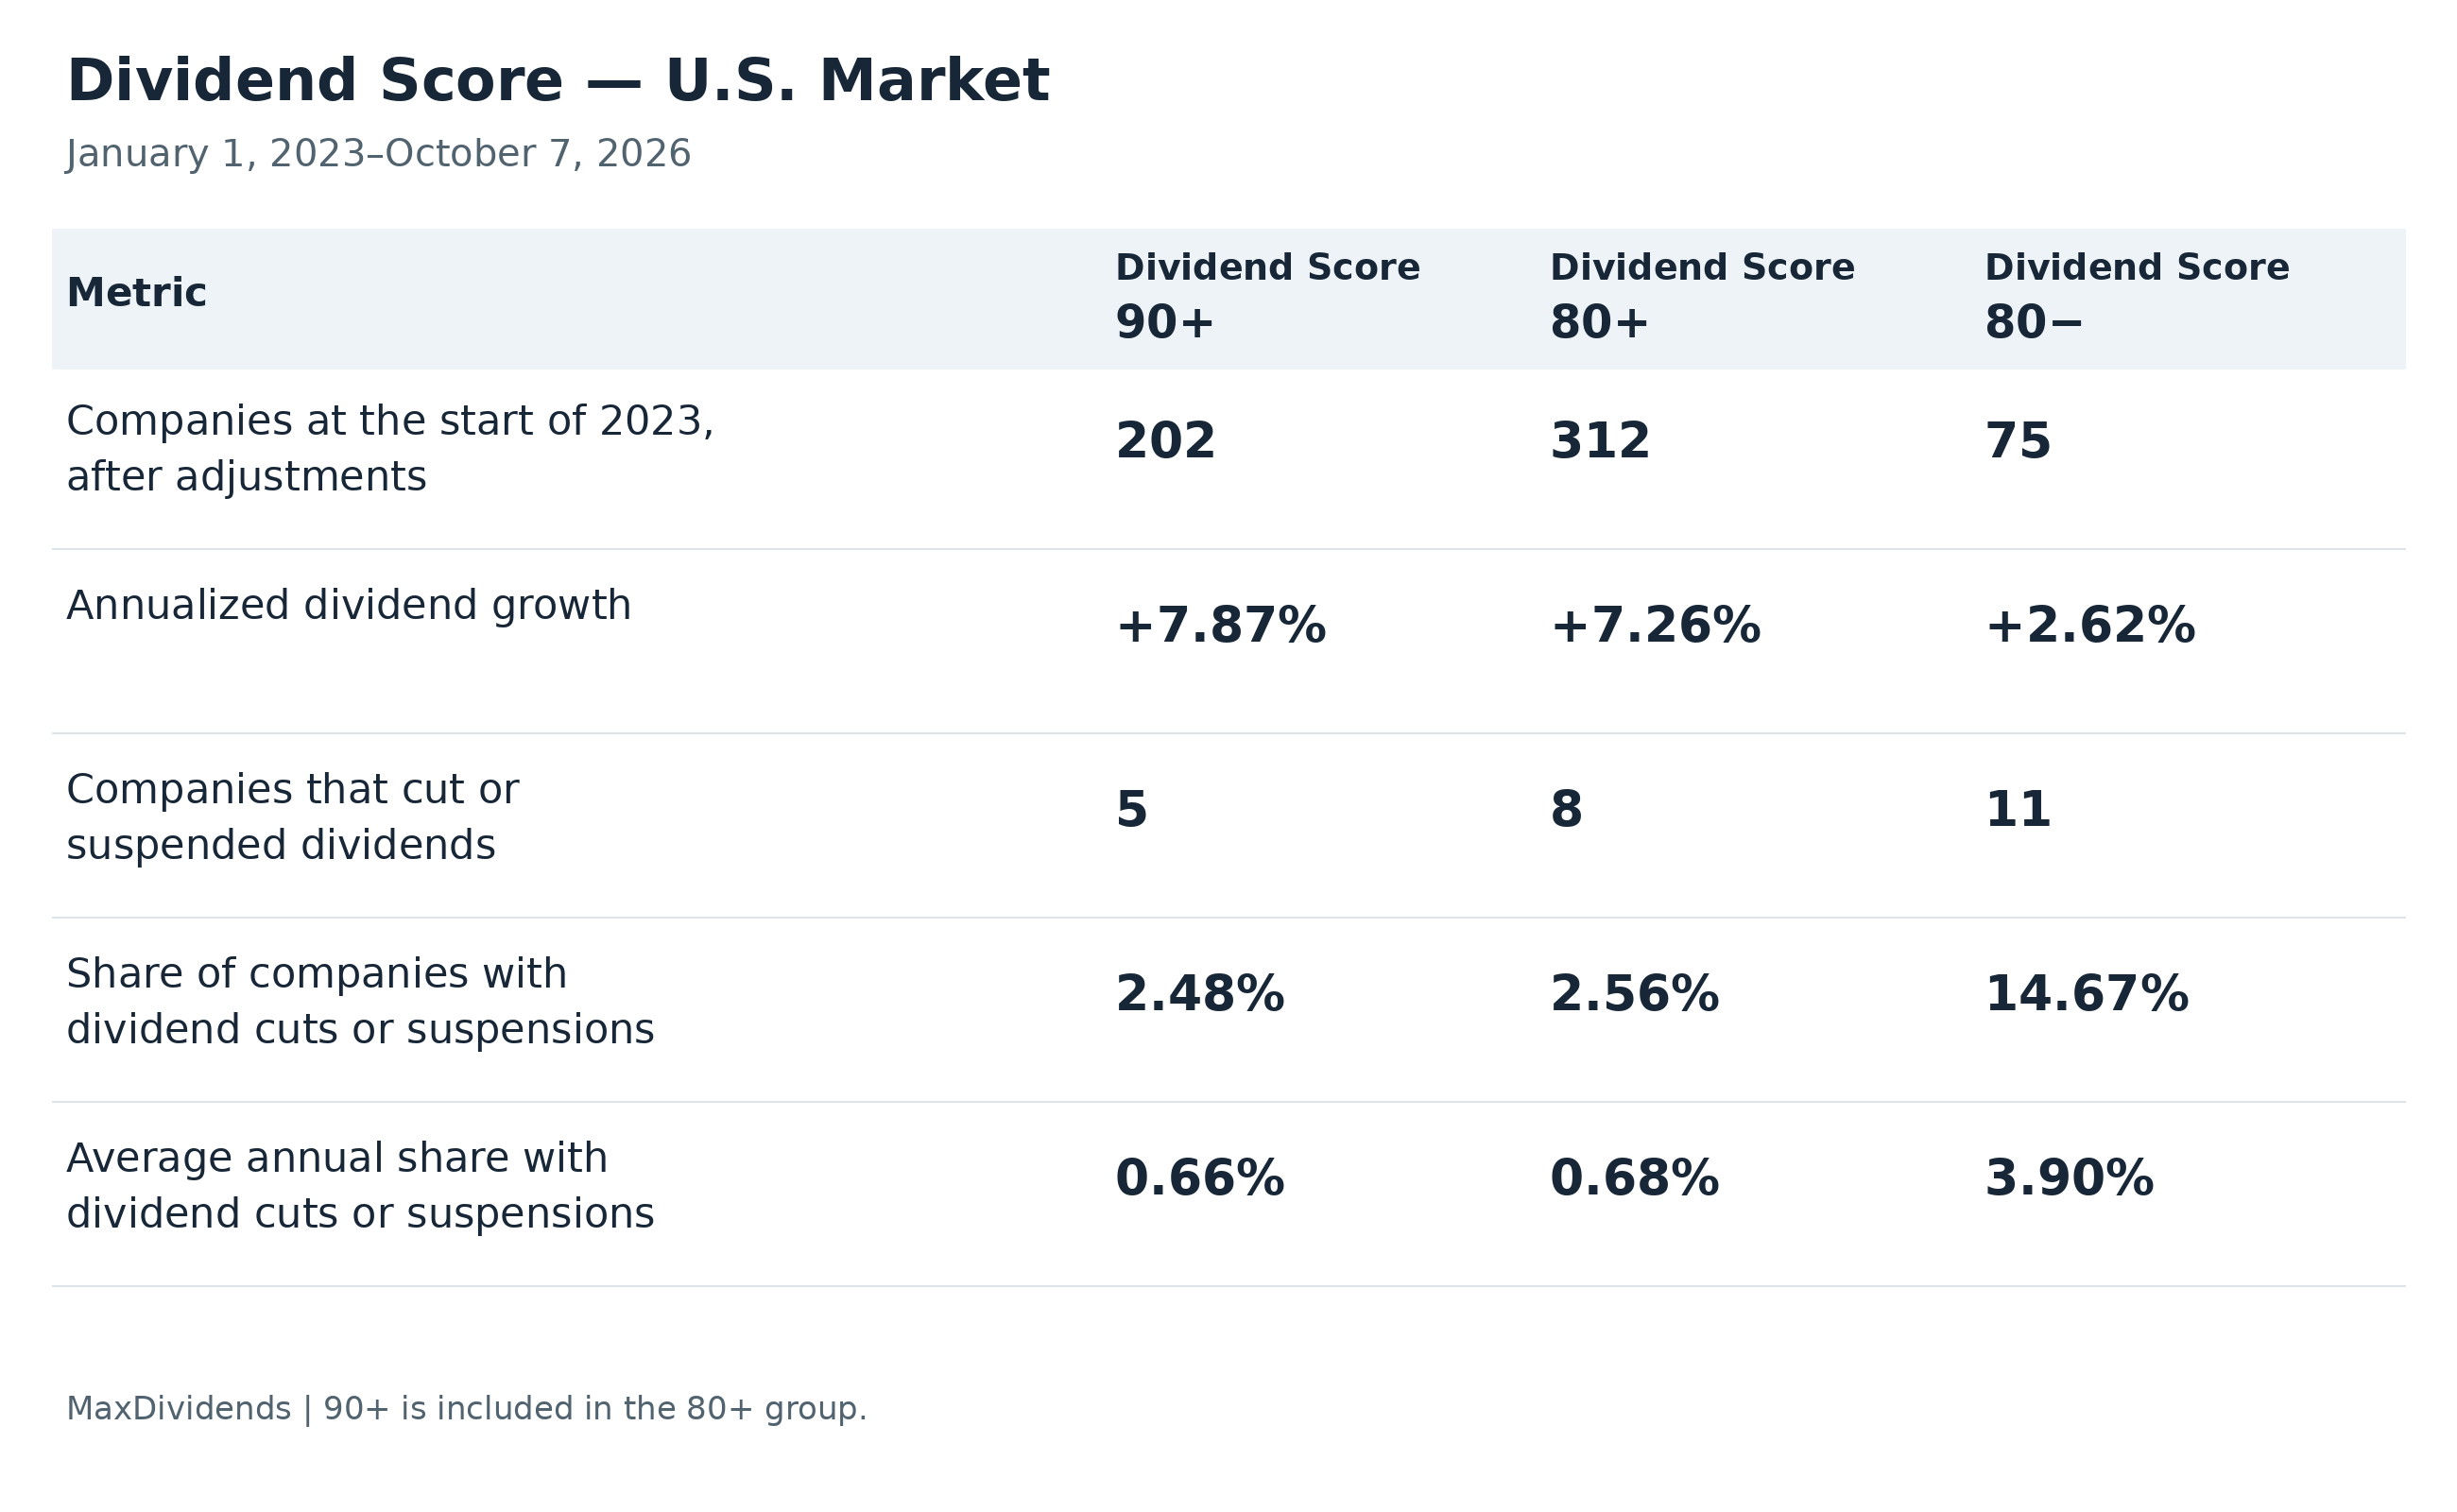
After the adjustments, the Dividend Score 90+ group contained 202 companies, the 80+ group contained 312, and the 80− group contained 75.
What the Comparison Showed
To make the difference easier to understand, let’s imagine 100 companies in each group. Over the nearly four-year study period, approximately:
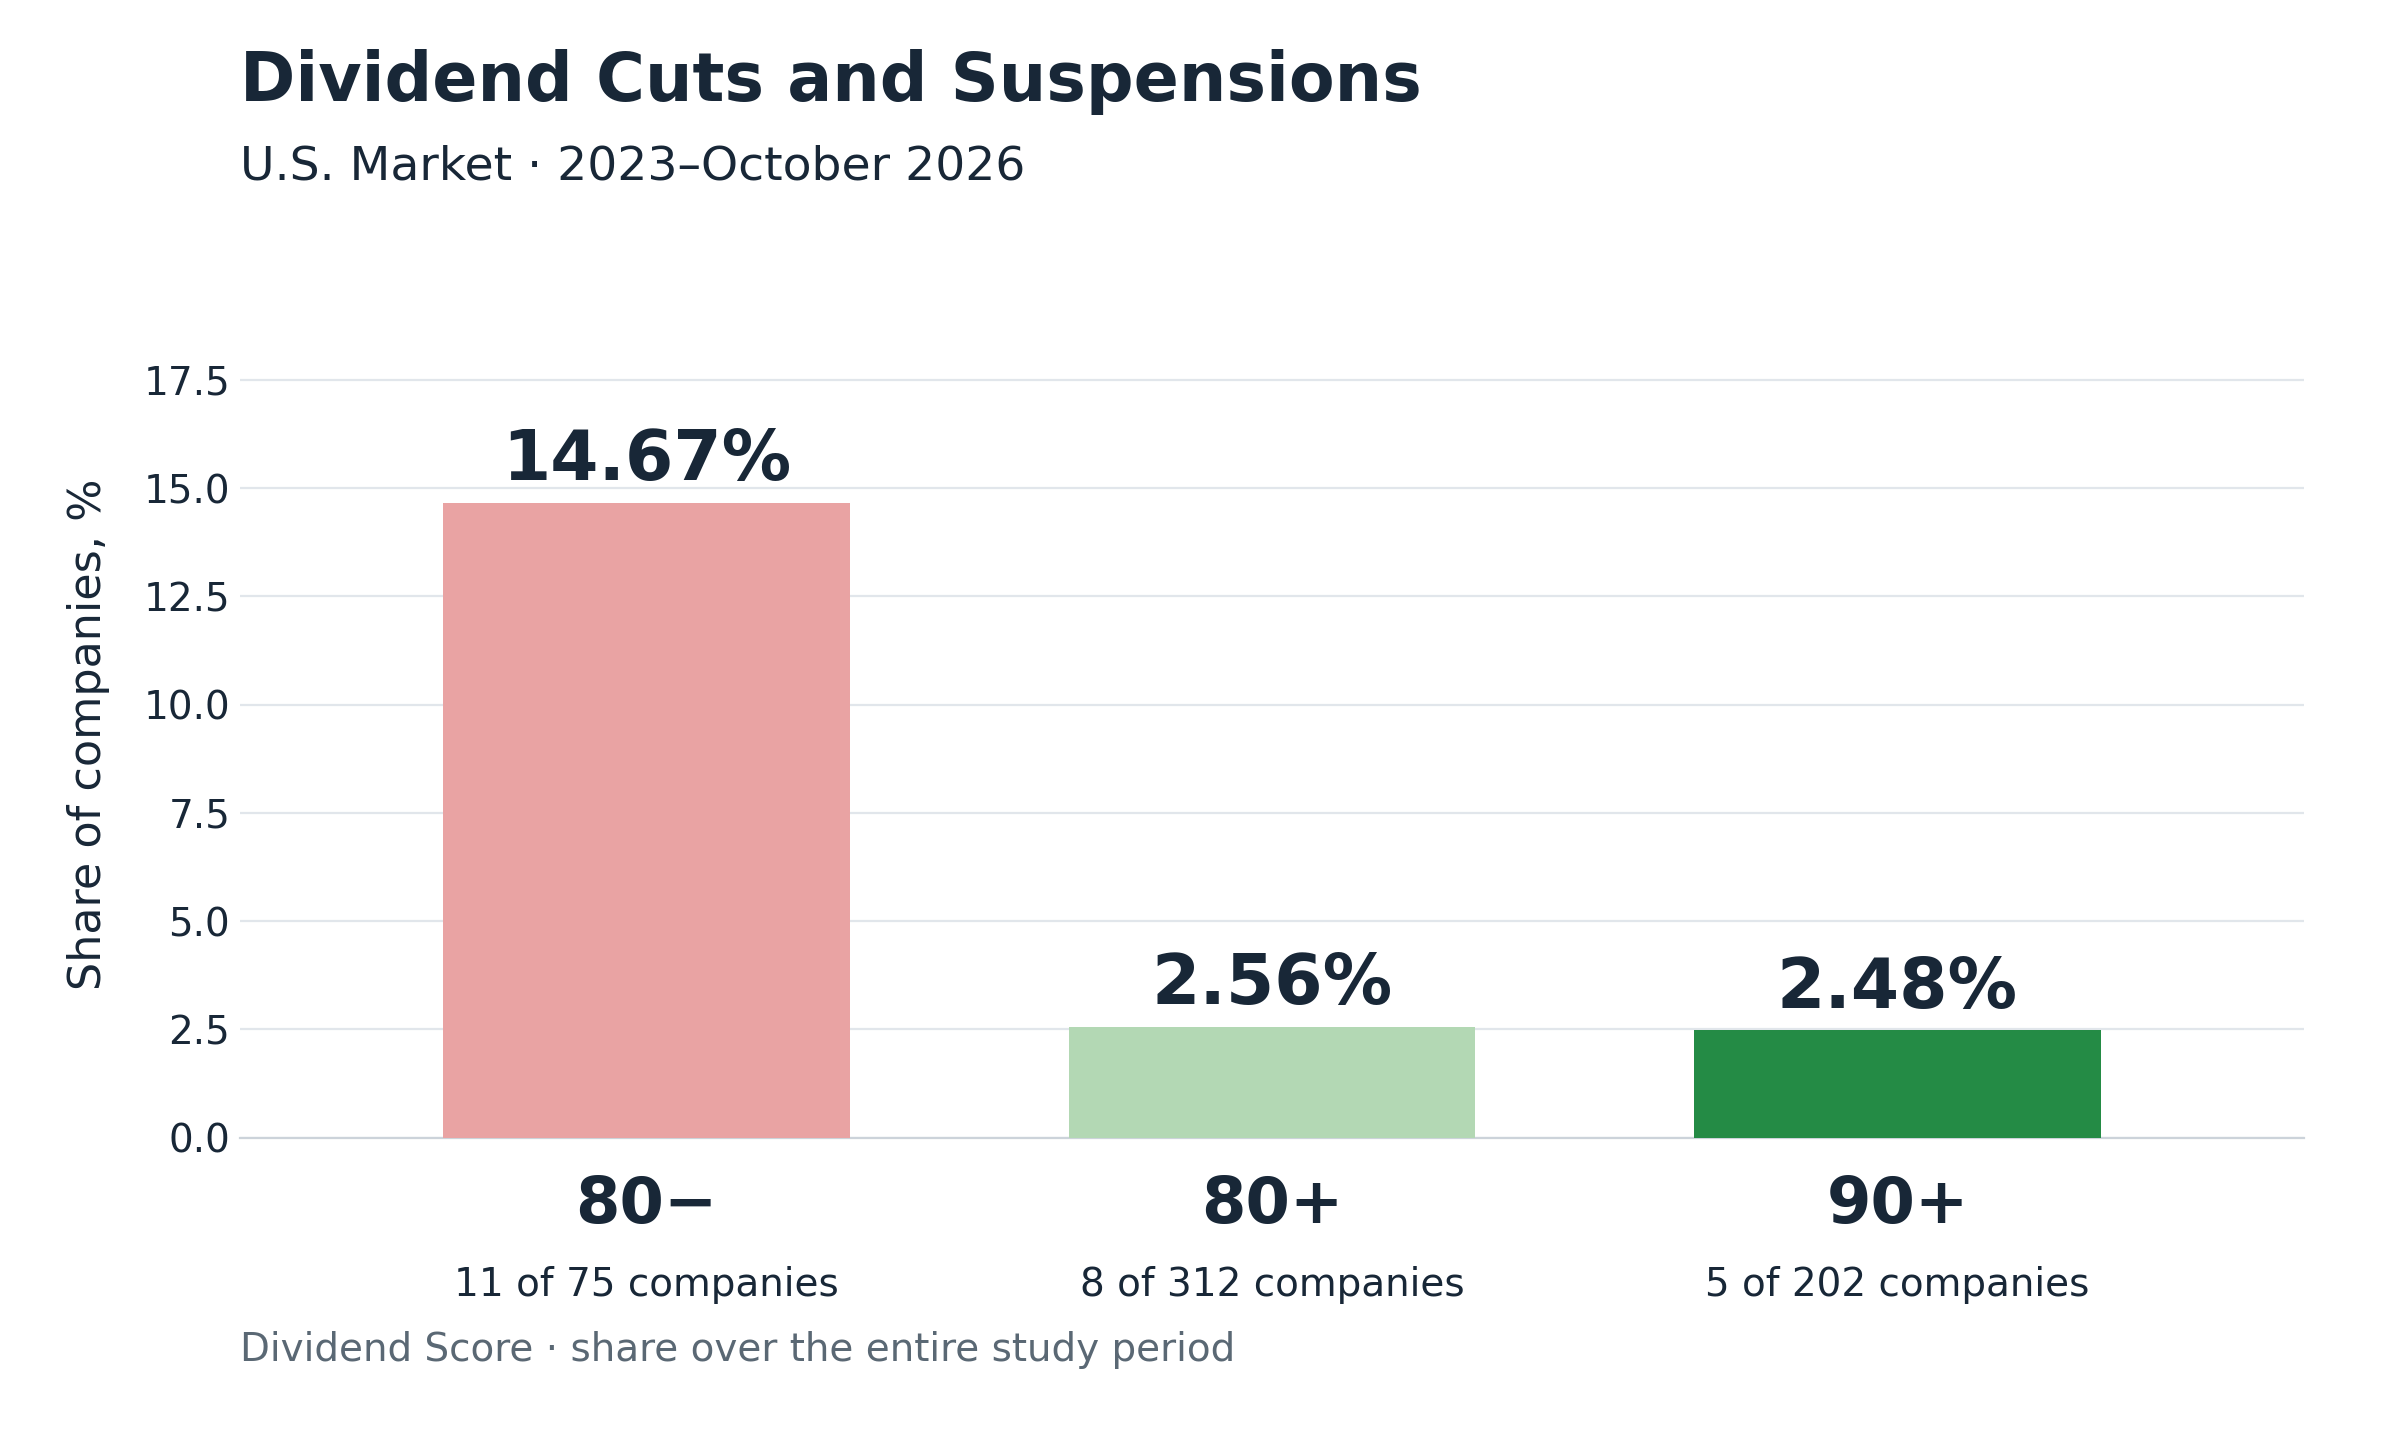
2–3 companies in the Dividend Score 90+ group would have cut or suspended their dividends;
3 companies in the Dividend Score 80+ group would have cut or suspended their dividends;
15 companies in the Dividend Score 80− group would have cut or suspended their dividends.
In the U.S. sample, dividend cuts and suspensions were similarly rare among companies with Dividend Scores of 90+ and 80+. However, the 90+ group also delivered somewhat stronger dividend growth.
Dividend Cuts and Annual Income Growth
The first chart shows the percentage of companies that cut or suspended their dividends over the entire study period.
Dividend Score - U.S. Market
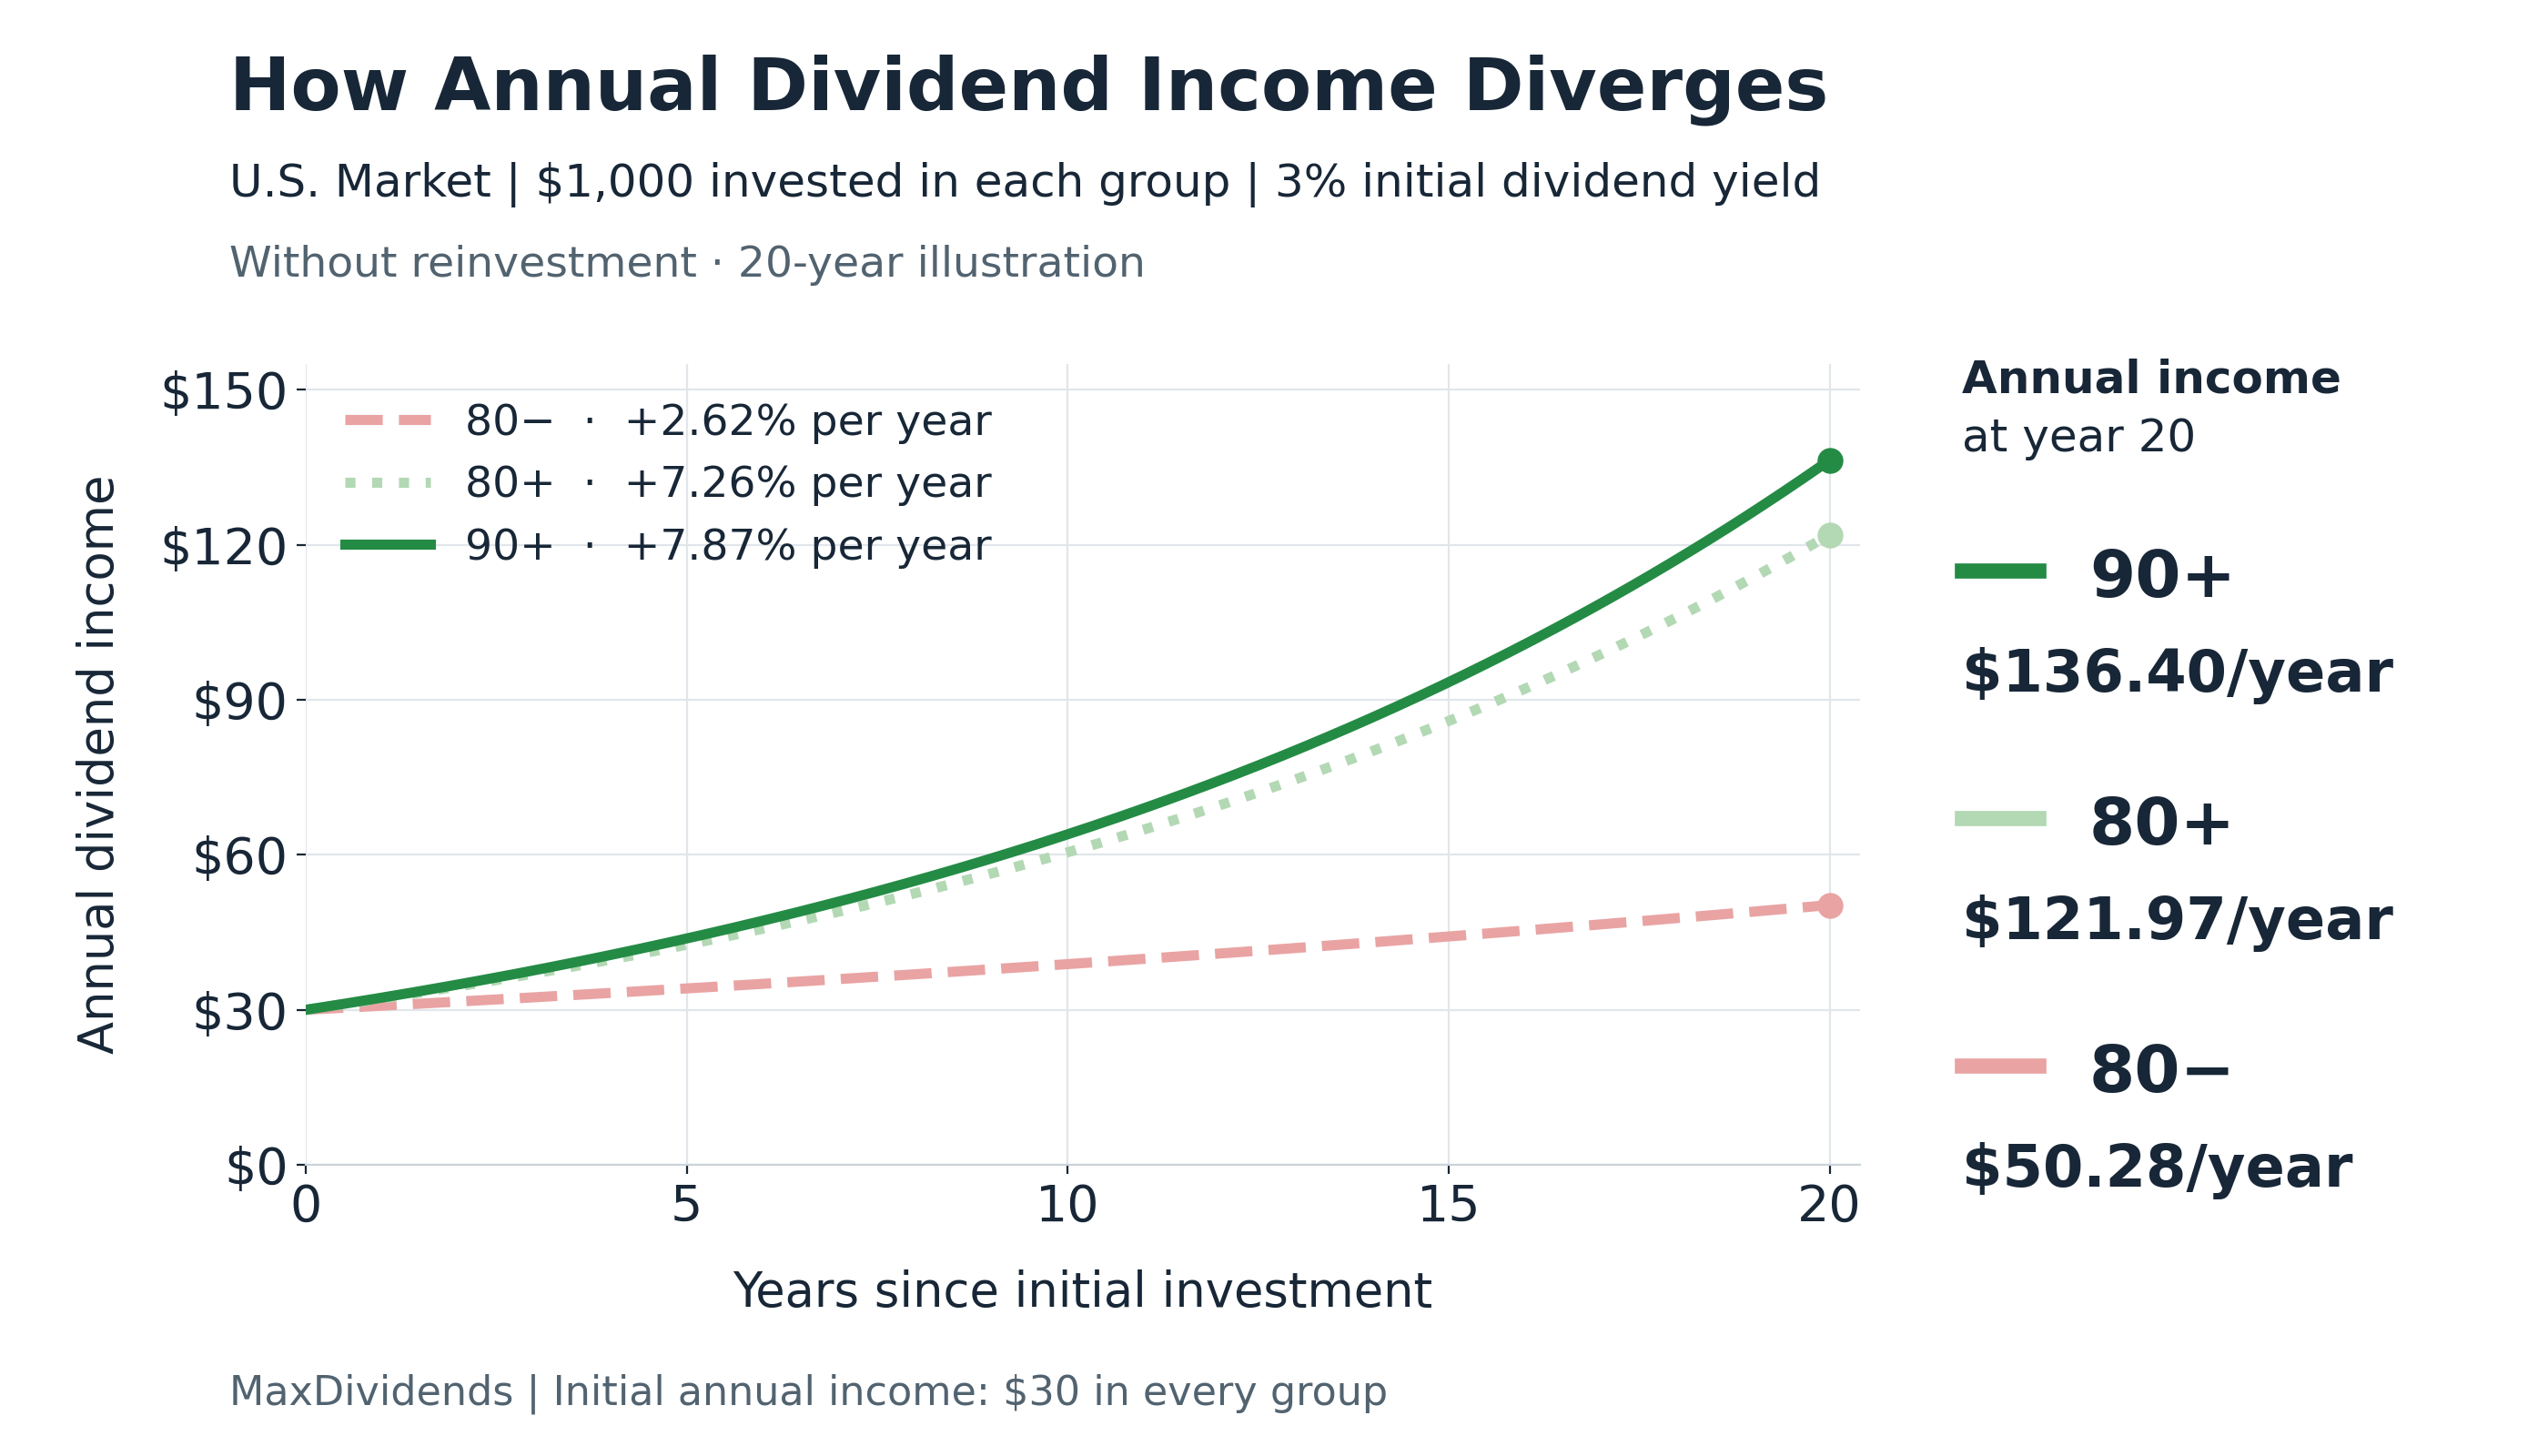
The second illustrates annual dividend income over 20 years, starting with the same initial investment.
How Dividend Growth Changes Investor Income
Imagine investing $1,000 in each group at the same initial dividend yield of 3%.
Each investment initially generates $30 a year. Payouts then grow at different rates:
+7.87% annually for Dividend Score 90+
+7.26% for Dividend Score 80+
and +2.62% for Dividend Score 80−
Let’s look at how annual income changes if these growth rates continue.
Dividend Score - U.S. Market
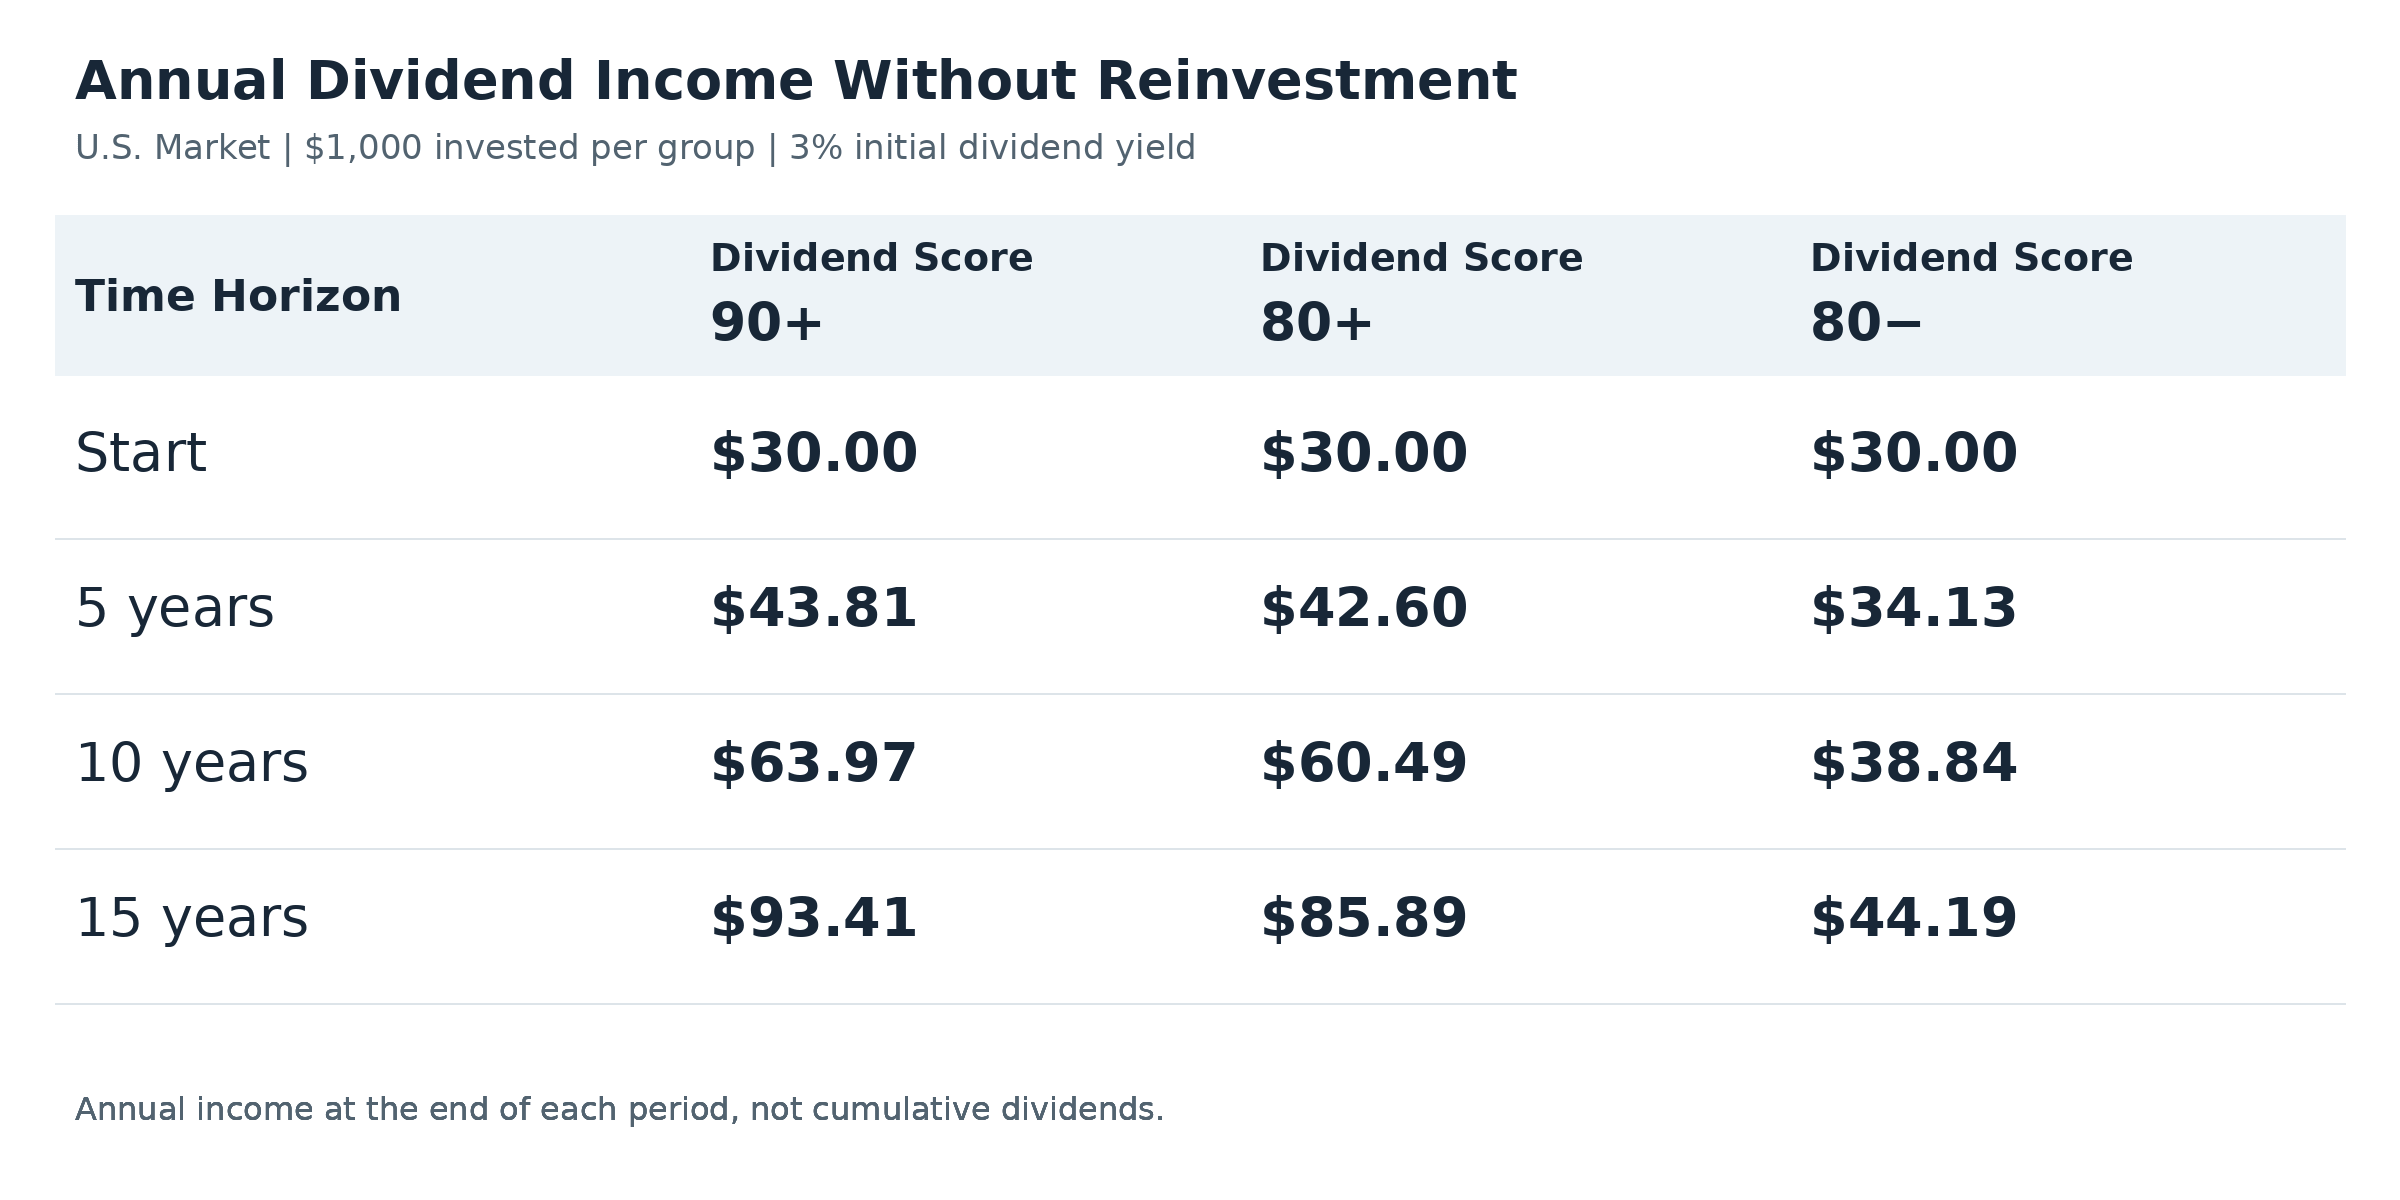
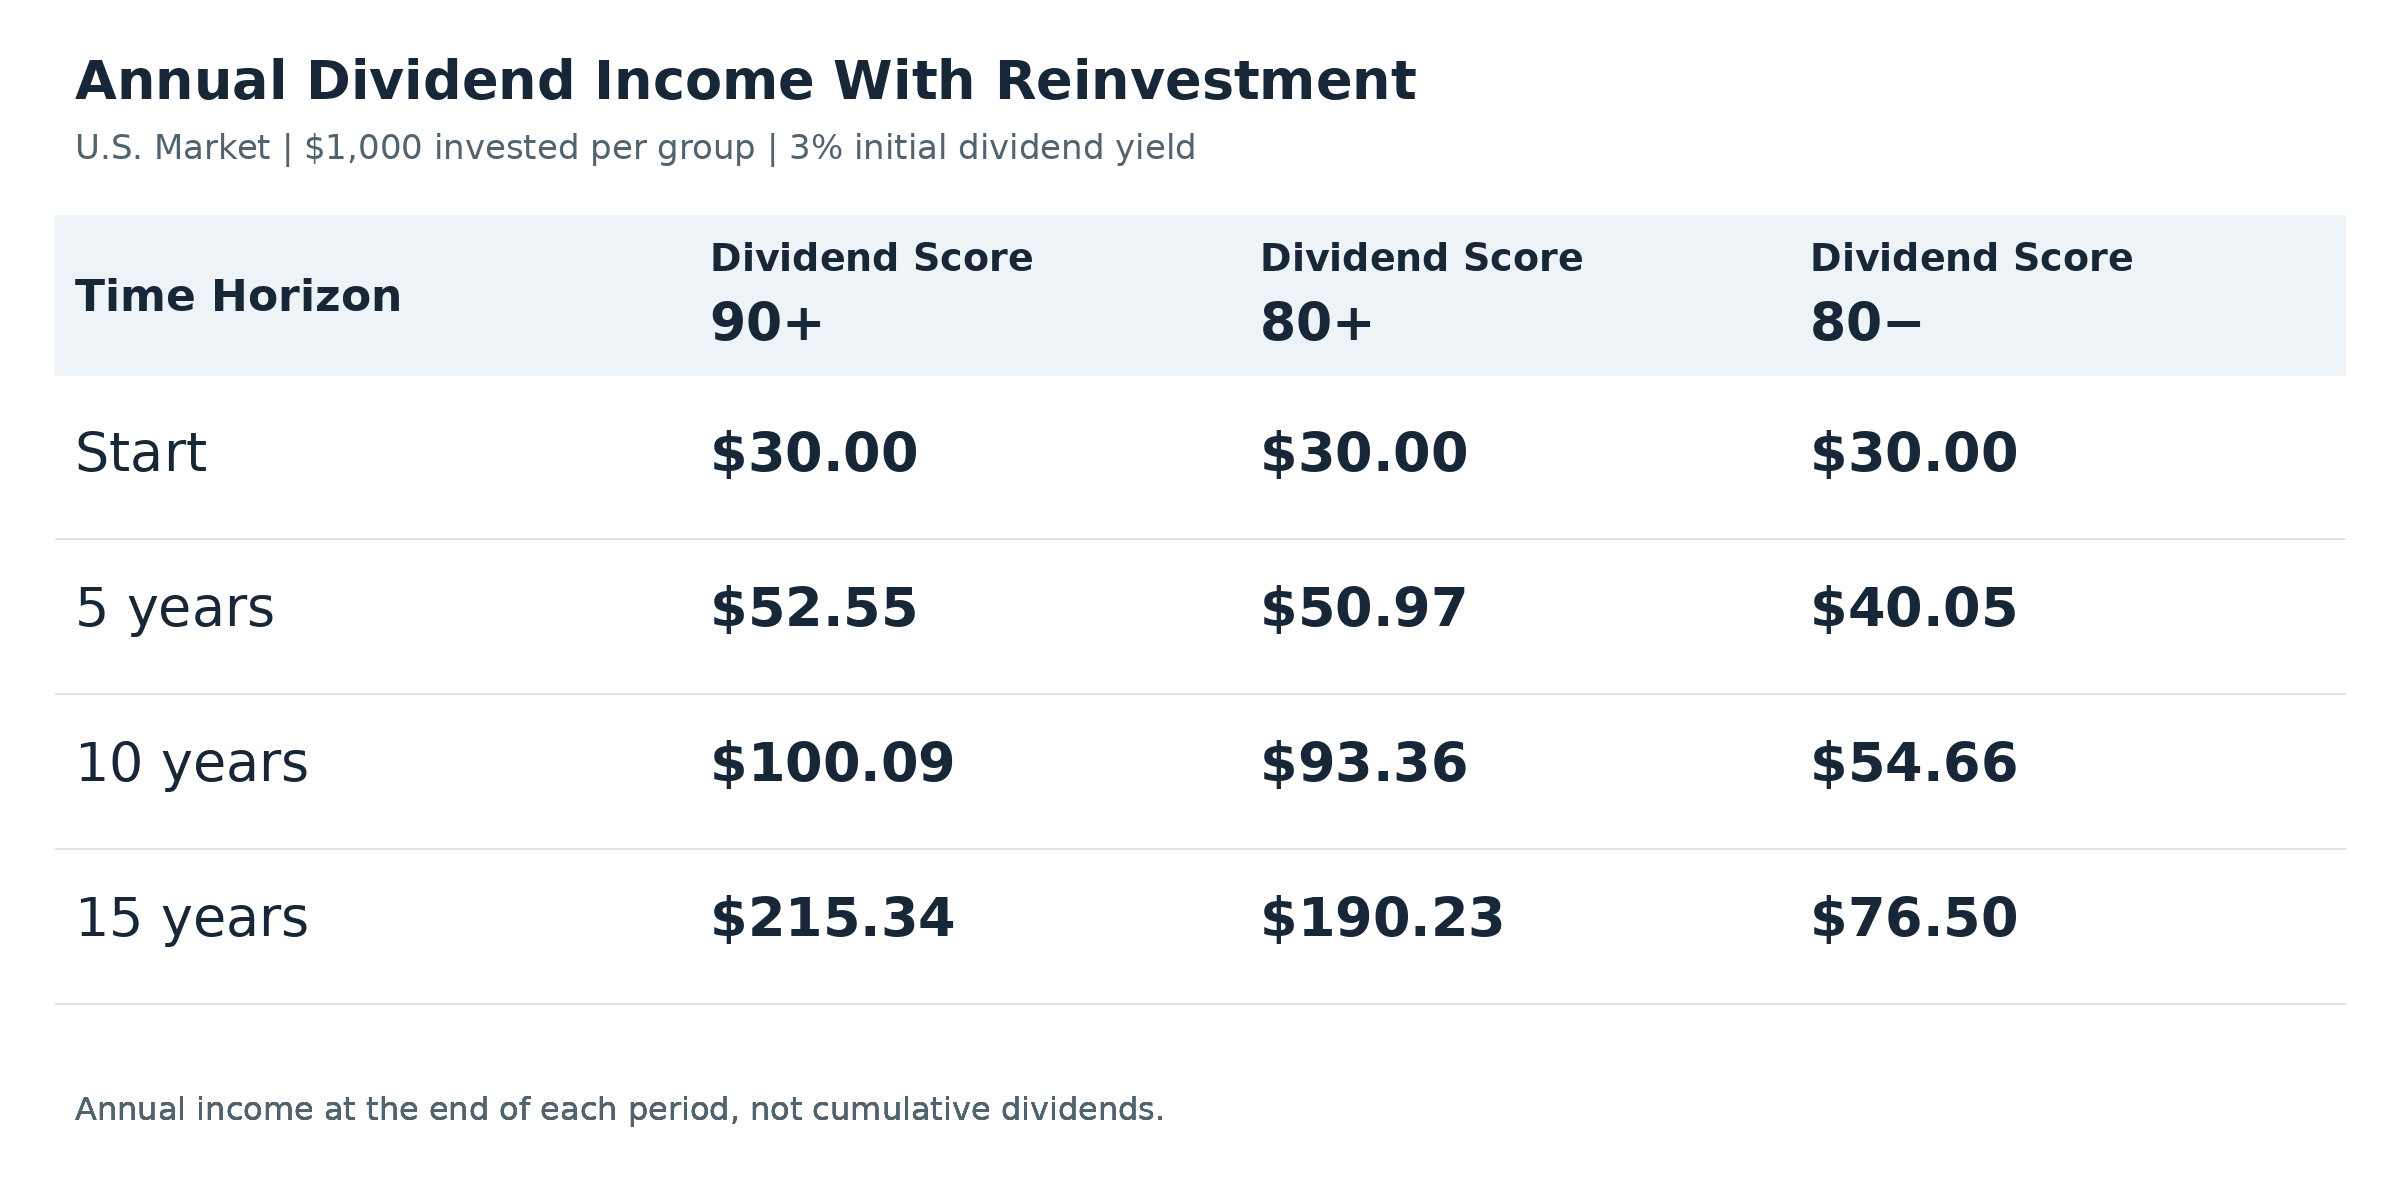
After 15 years, the investment in the Dividend Score 90+ group generates $93.41 a year without reinvestment, compared with $44.19 for the 80− group. With reinvestment, annual income reaches $215.34 versus $76.50.
Reinvestment amplifies the effect: dividends buy additional shares. Those shares also generate dividends, while the payout per share continues to grow.
A MaxDividends Study of U.S. and International Dividend Stocks
Dividend Score
Global Markets (Excluding the U.S.)
How We Conducted the Study
We selected non-U.S. companies that had a track record of at least 10 consecutive years of annual dividend increases as of the beginning of 2023. To be included, companies also needed to have Dividend Score data available for all four years: 2023, 2024, 2025, and 2026.
The initial sample contained 44 companies: 34 from Canada, four from Sweden, three from Finland, two from Norway, and one from Switzerland.
For the comparison, we used three initial groups without rounding the scores:
Dividend Score 90+: companies with scores of 90 or higher.
Dividend Score 80+: companies with scores of 80 or higher.
Dividend Score 80−: companies with scores of 79 or lower.
Companies with scores of 90 or higher also belong to the 80+ group. We show them separately to examine whether a higher initial score is associated with different results. The company counts for these two groups should not be added together.
We then tracked regular dividend payments from January 1, 2023, through October 7, 2026, to see how many companies cut or suspended their dividends and how much dividend payments grew over that period.
We also accounted for changes in the score. If a company initially had a score of 80 or higher, its score subsequently fell below 80, and it later cut its dividend, we reassigned it to the 80− group. If that company’s initial score was 90 or higher, it was also removed from the final 90+ group.
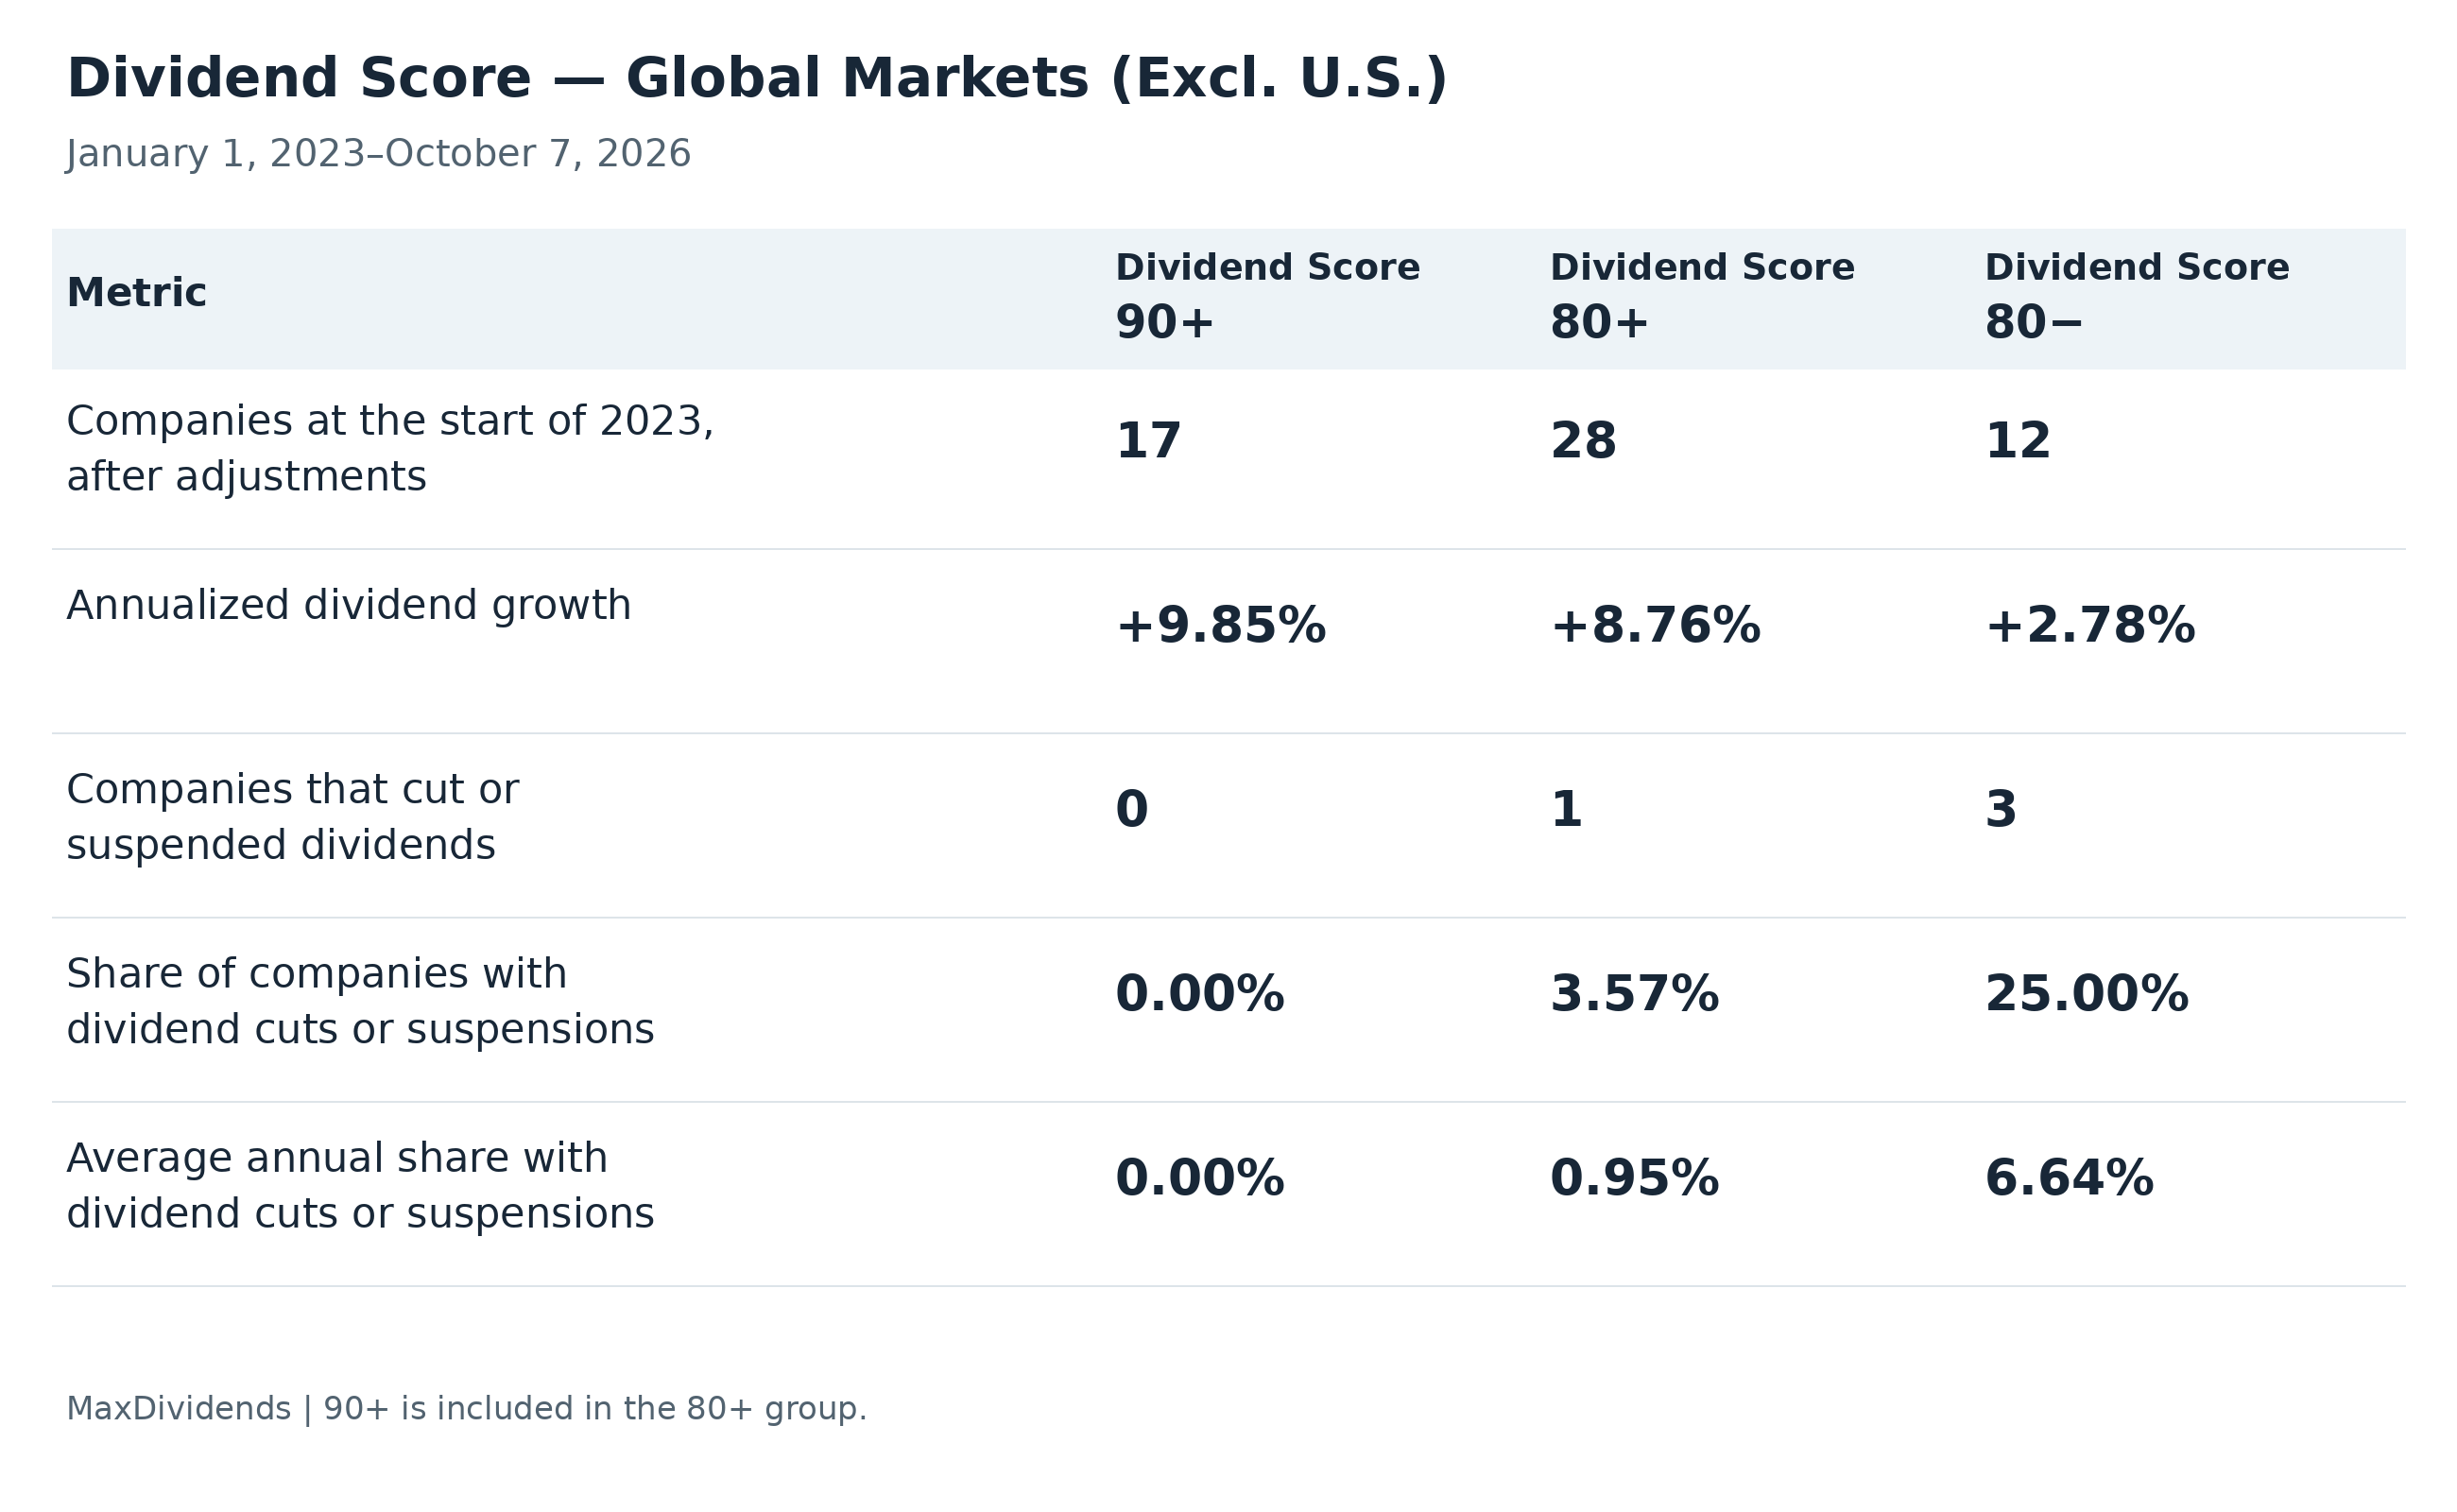
After the adjustments, the Dividend Score 90+ group contained 17 companies, the 80+ group contained 28, and the 80− group contained 12.
What the Comparison Showed
To make the difference easier to see, imagine 100 companies in each group. Applying the proportions observed in our sample, over the entire study period of almost four years, approximately:
0 companies in the Dividend Score 90+ group would have reduced their payouts;
4 companies in the Dividend Score 80+ group would have done so;
25 companies in the Dividend Score 80− group would have done so.
We found no dividend cuts in the final 90+ group. This result applies to the 17 companies that remained in that group after the adjustments.
Dividend Cuts and Annual Income Growth
The first chart shows the percentage of companies that cut or suspended their dividends over the entire study period.
Dividend Score - Global Markets (Excluding the U.S.)
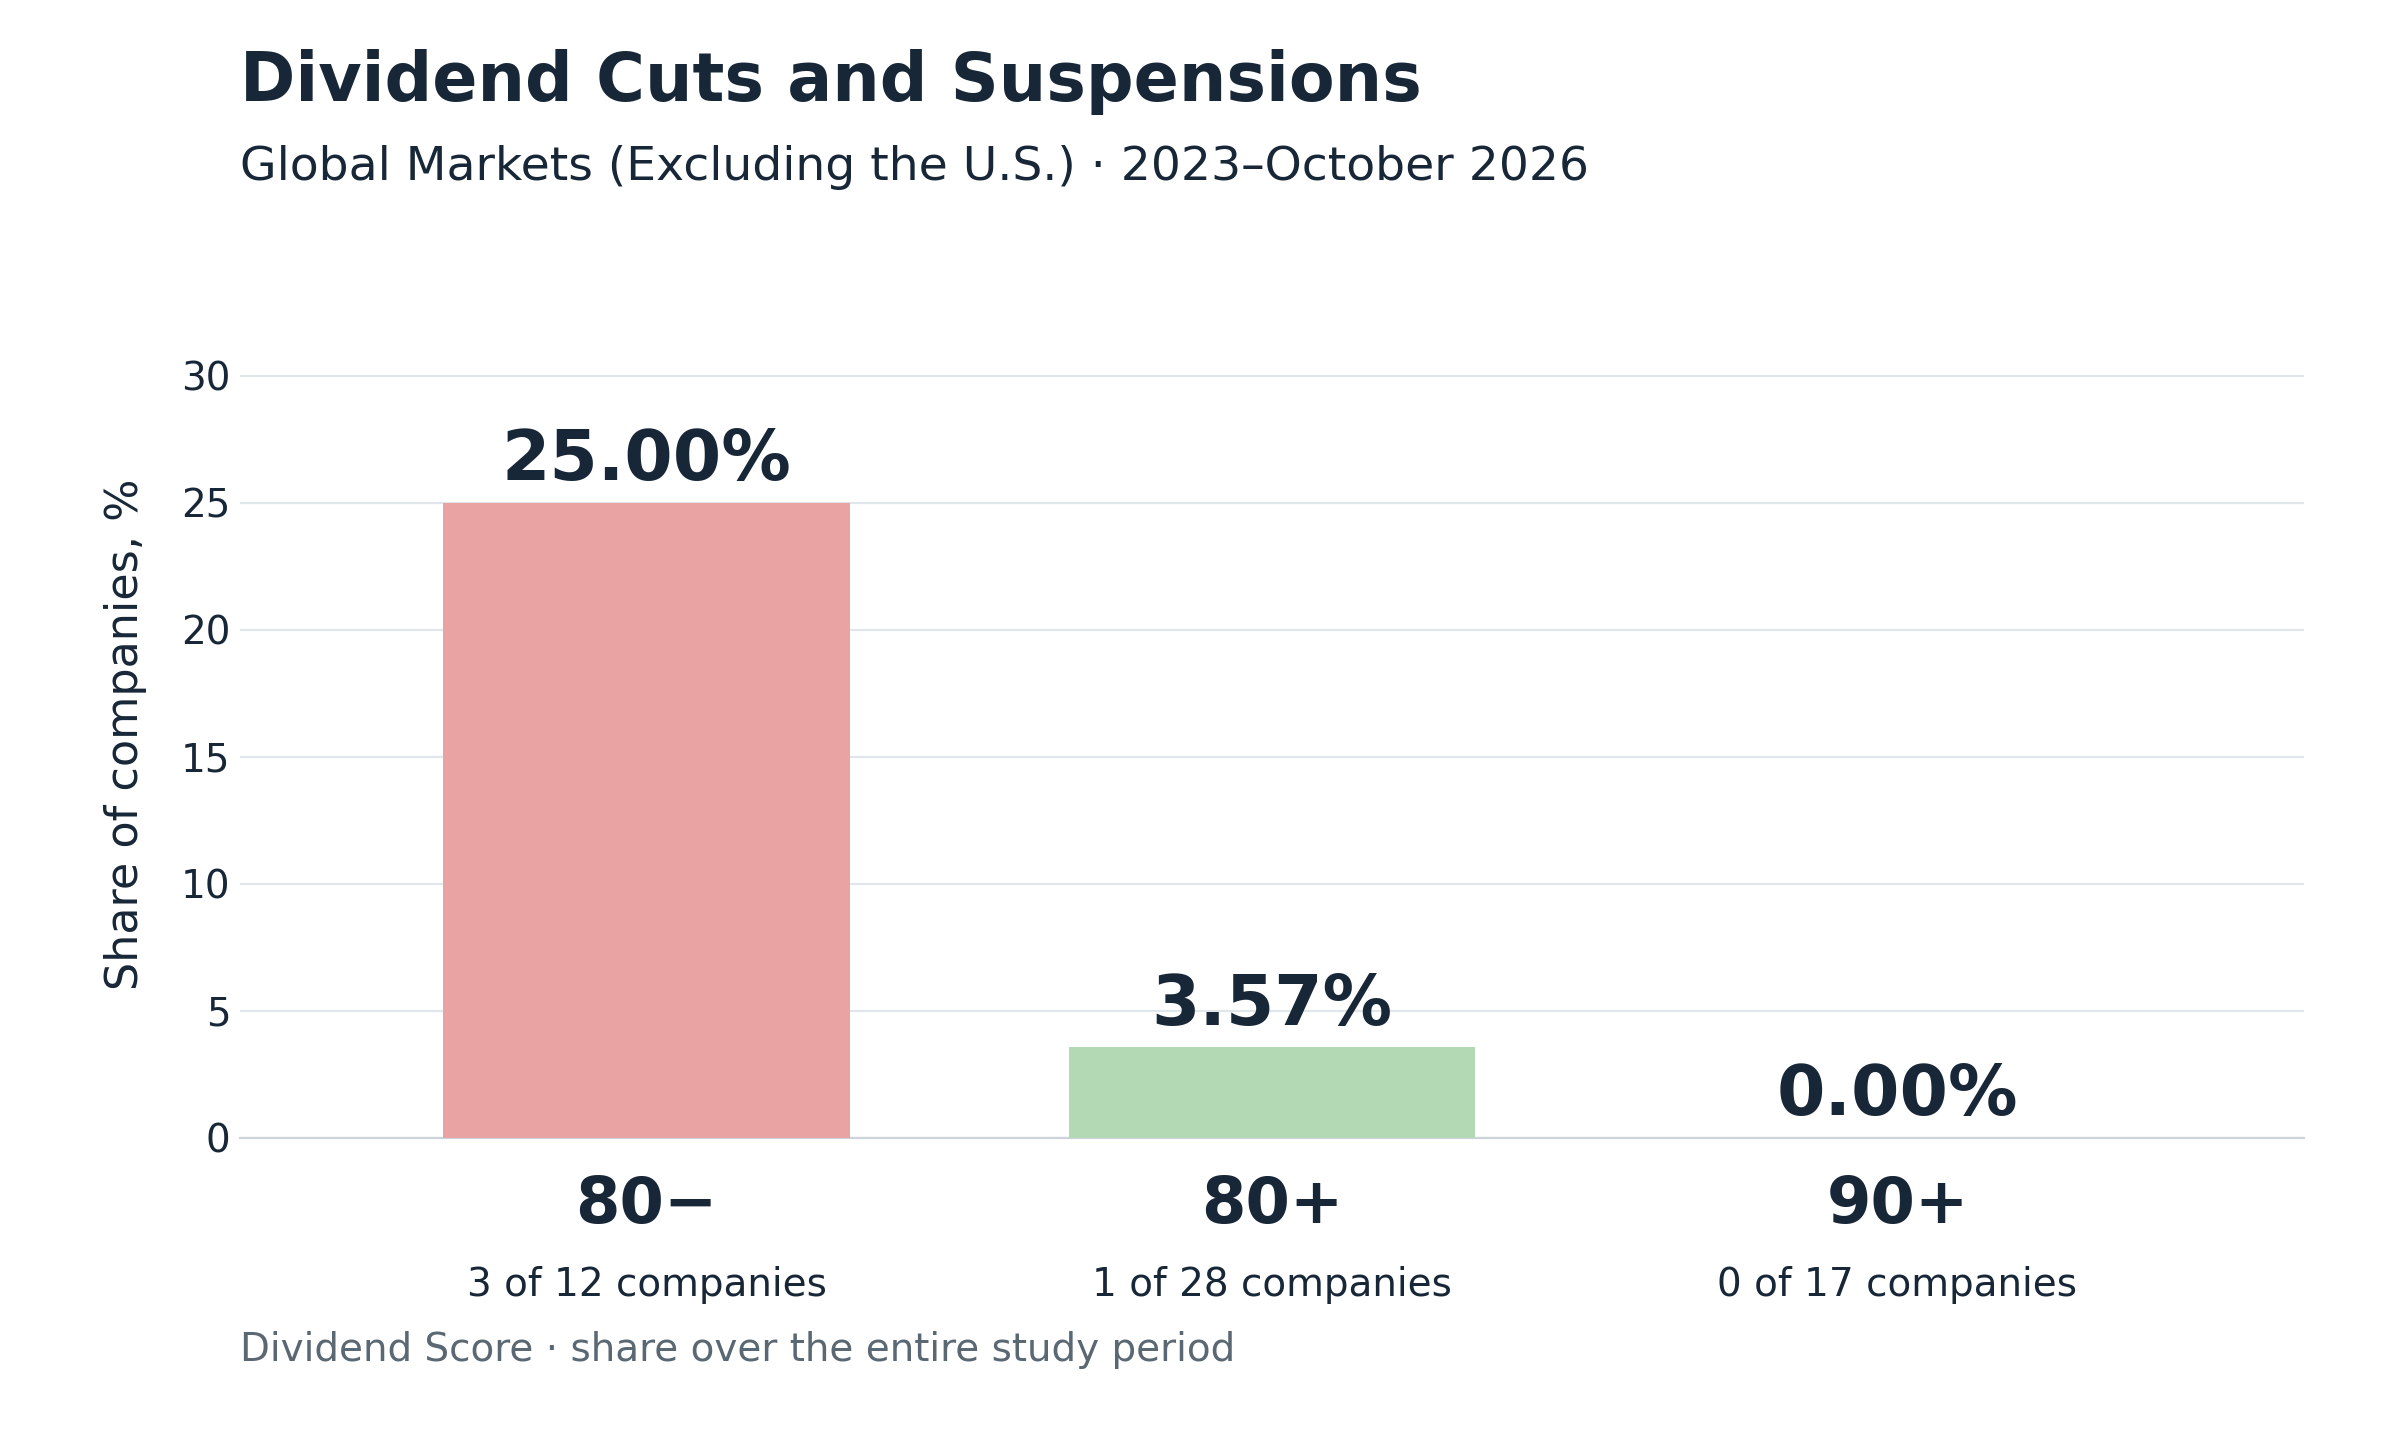
The second illustrates annual dividend income over 20 years, starting with the same initial investment.
How Dividend Growth Changes Investor Income
Imagine investing $1,000 in each group at the same initial dividend yield of 3%.
Each investment initially generates $30 a year. Payouts then grow at different rates:
+9.85% annually for Dividend Score 90+
+8.76% for Dividend Score 80+
and +2.78% for Dividend Score 80−
Let’s look at how annual income changes if these growth rates continue.
Dividend Score - Global Markets (Excluding the U.S.)
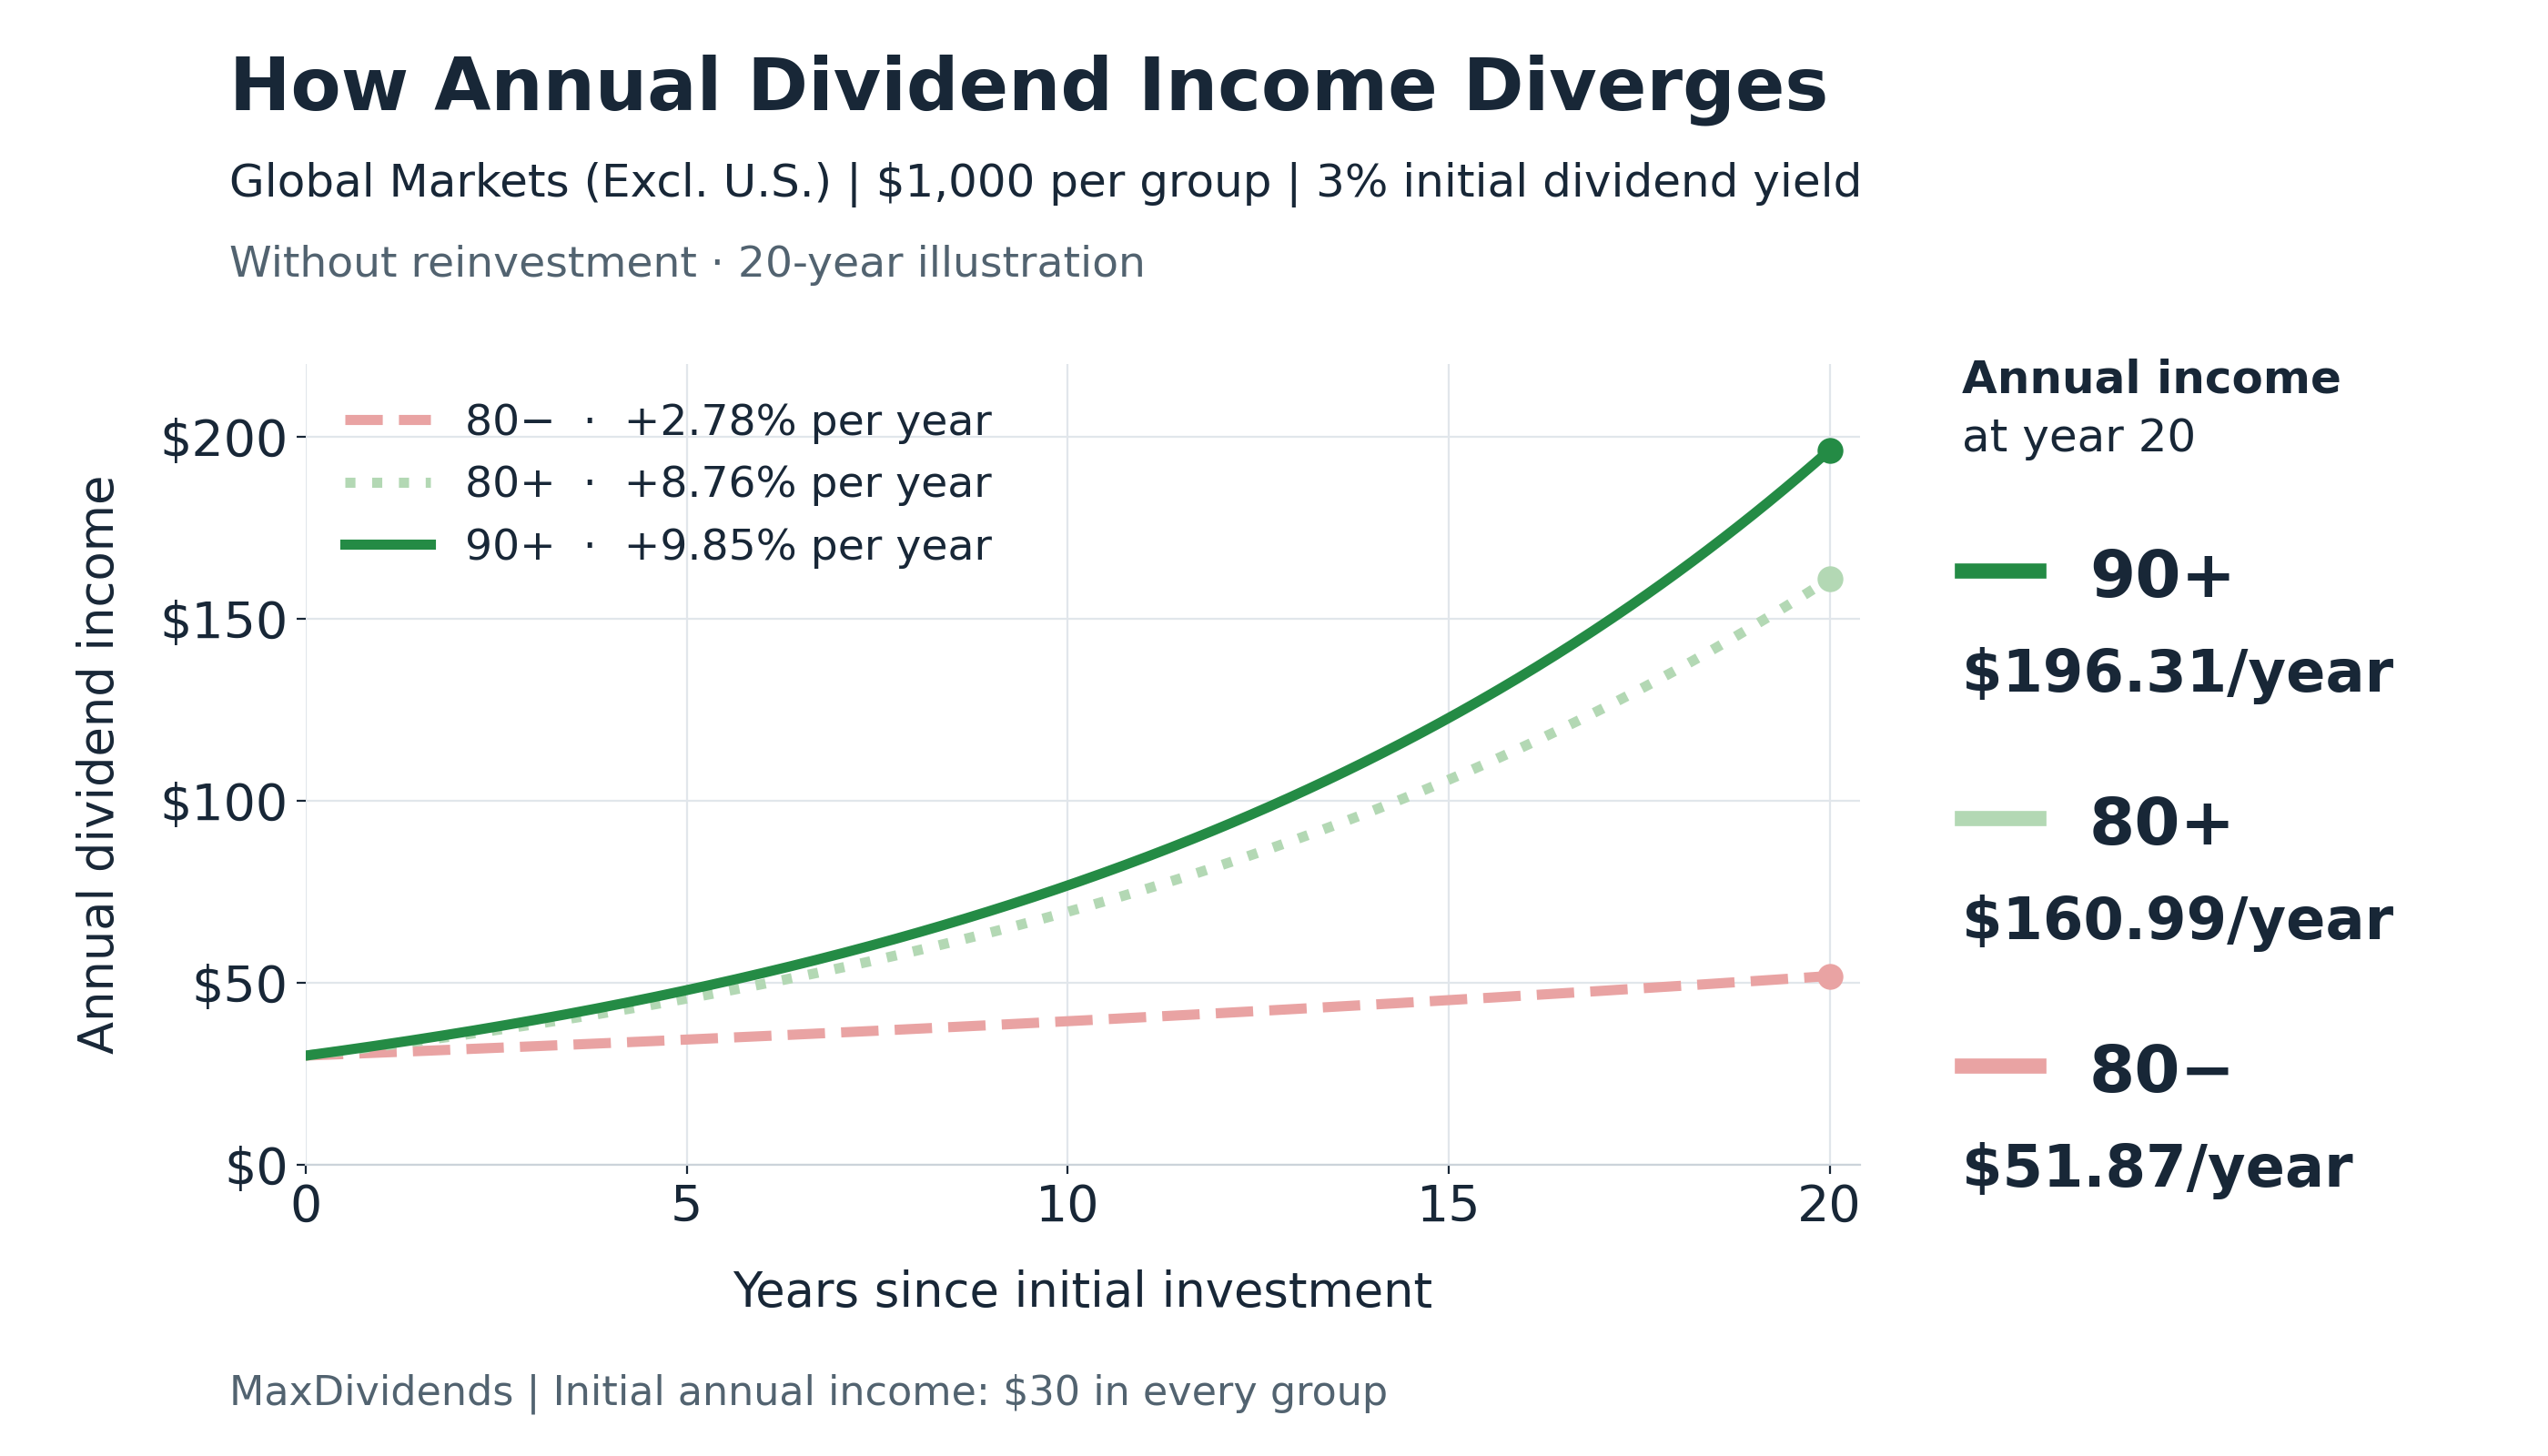
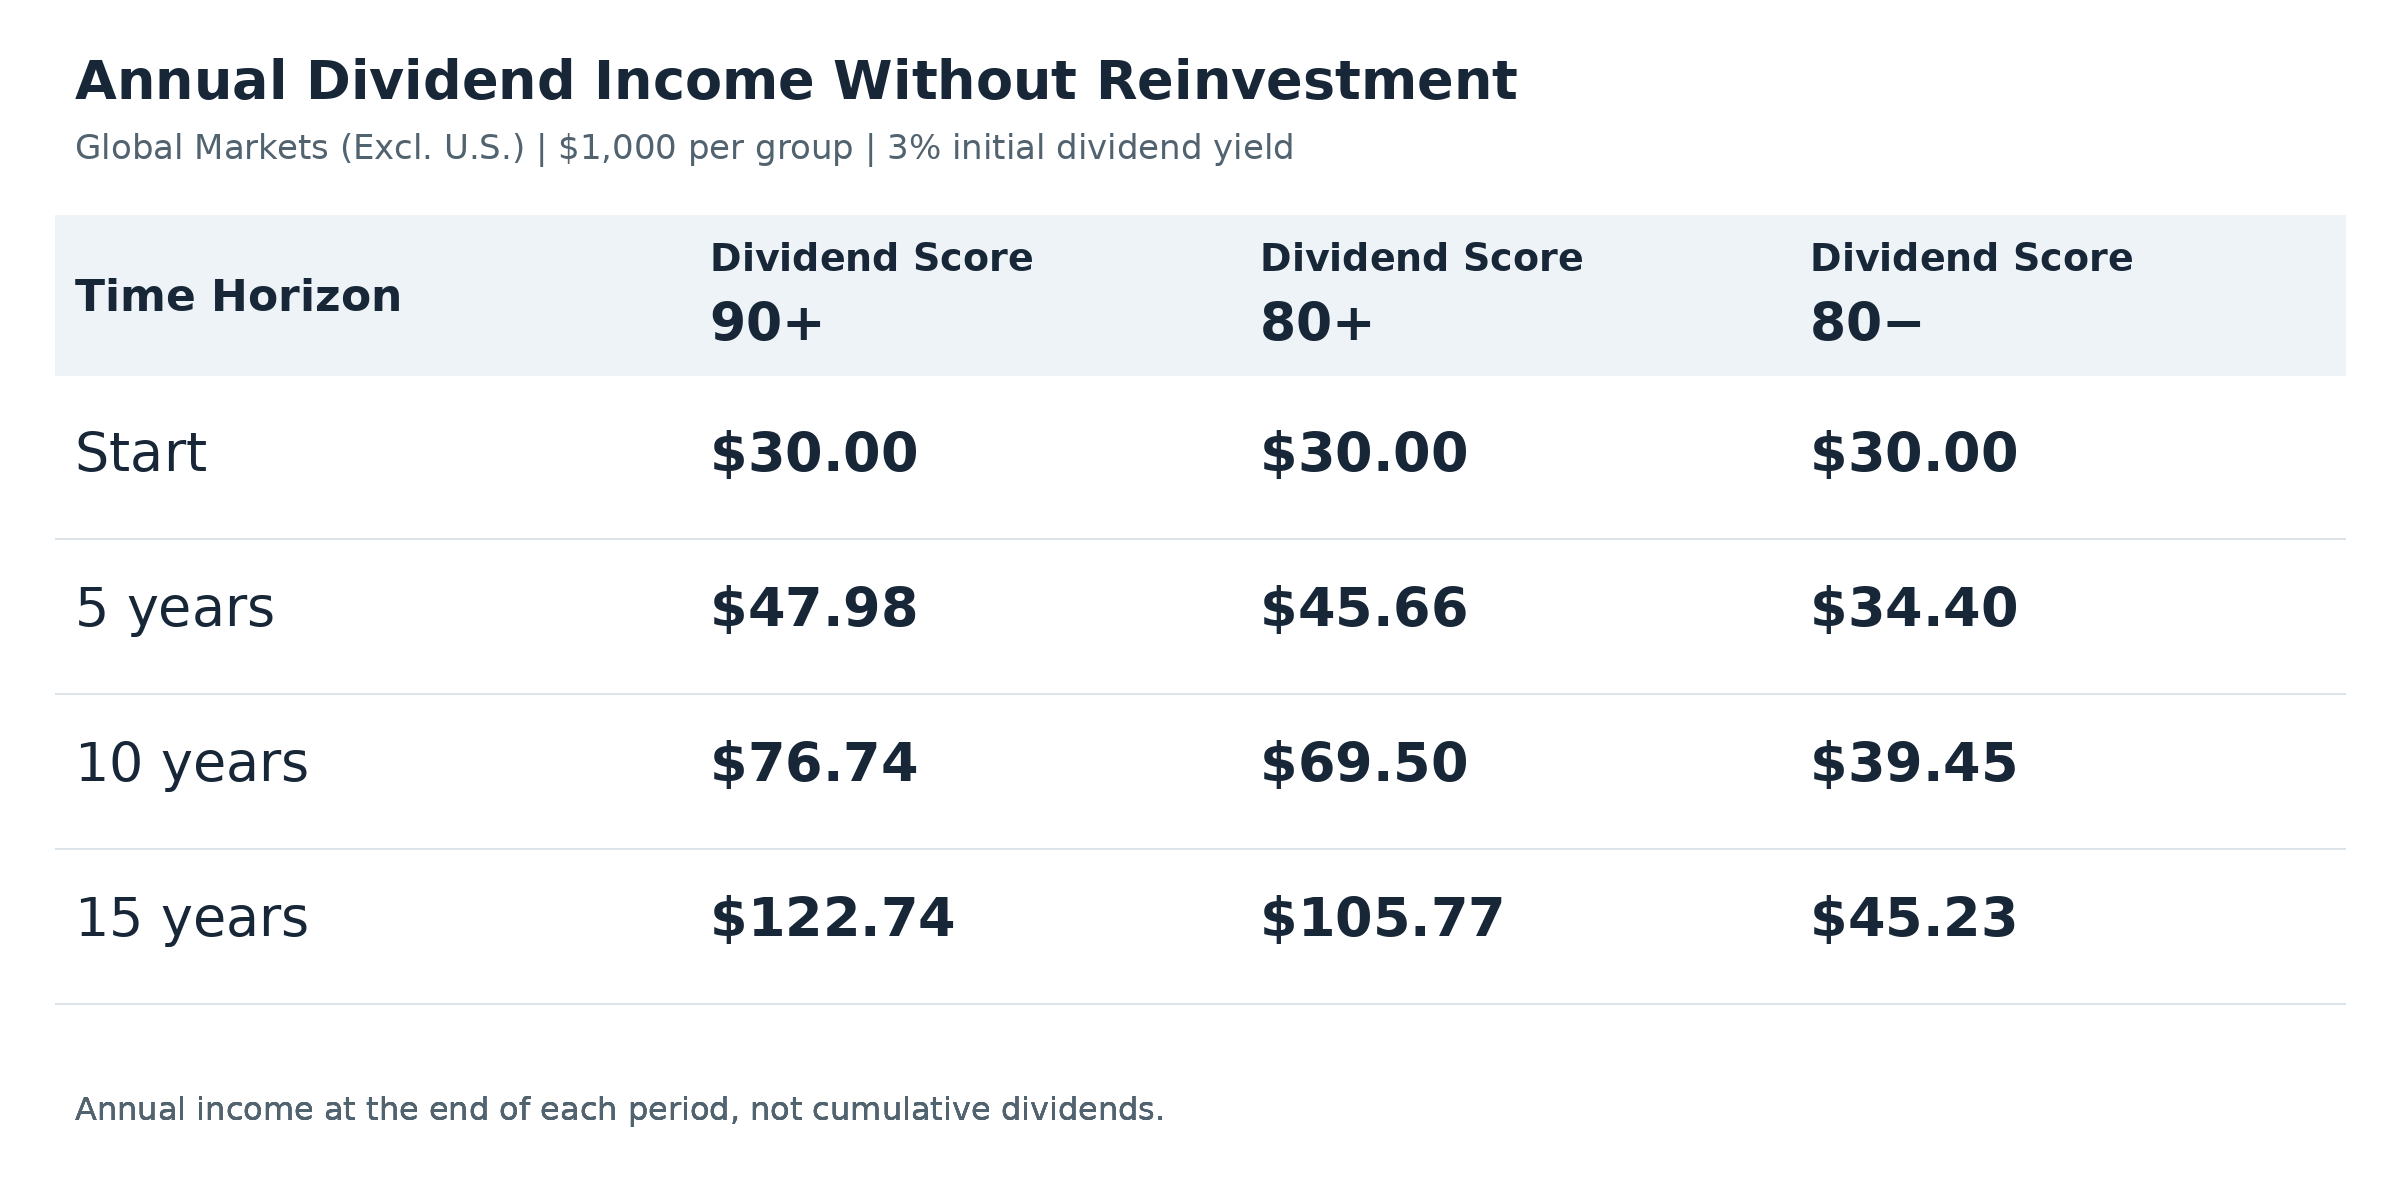
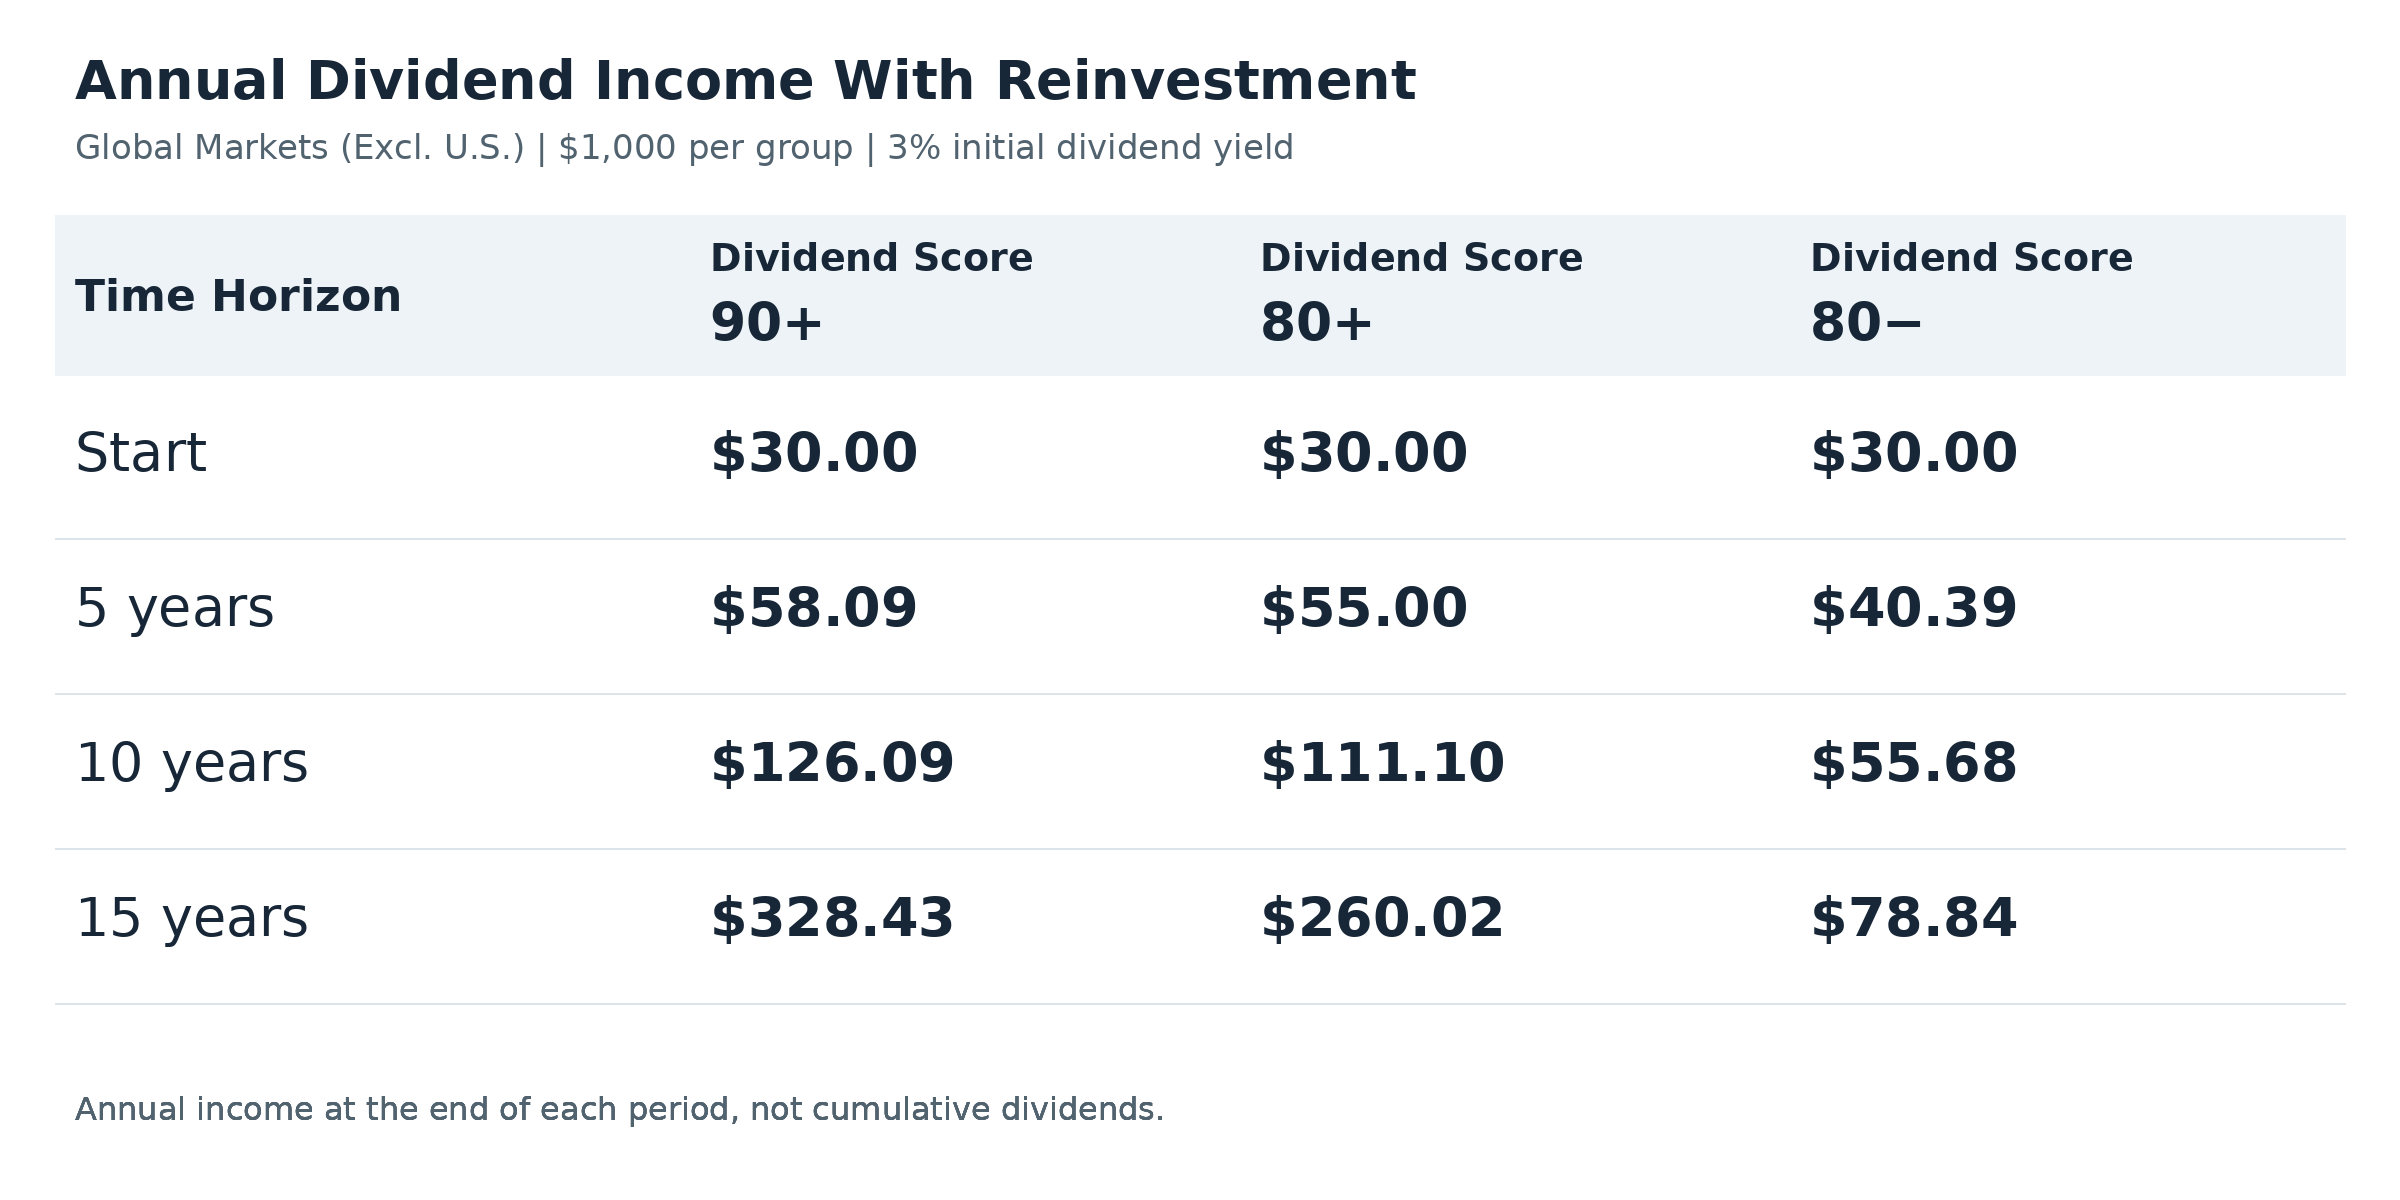
After 15 years, the investment in the Dividend Score 90+ group generates $122.74 a year without reinvestment, compared with $45.23 for the 80− group. With reinvestment, annual income reaches $328.43 versus $78.84.
Reinvestment amplifies the effect: dividends buy additional shares. Those shares also generate dividends, while the payout per share continues to grow.
A MaxDividends Study of U.S. and International Dividend Stocks
Dividend Score
Combined Results: US + Global Markets
How We Conducted the Study
We combined the results for U.S. and non-U.S. companies into a single sample of 439 companies.
All selected companies had a track record of at least 10 consecutive years of annual dividend increases as of the beginning of 2023. To be included, companies also needed to have Dividend Score data available for all four years: 2023, 2024, 2025, and 2026.
For the comparison, we used three initial groups without rounding the scores:
Dividend Score 90+: companies with scores of 90 or higher.
Dividend Score 80+: companies with scores of 80 or higher.
Dividend Score 80−: companies with scores of 79 or lower.
Companies with scores of 90 or higher also belong to the 80+ group. We show them separately to examine whether a higher initial score is associated with different results. The company counts for these two groups should not be added together.
We then tracked regular dividend payments from January 1, 2023, through October 7, 2026, to see how many companies cut or suspended their dividends and how much their dividends grew over that period.
We also accounted for changes in the score. If a company initially had a score of 80 or higher, its score subsequently fell below 80, and it later cut its dividend, we reassigned it to the 80− group. If that company’s initial score was 90 or higher, it was also removed from the final 90+ group.
After the adjustments, the Dividend Score 90+ group contained 219 companies, the 80+ group contained 340, and the 80− group contained 87.
Combined average growth is calculated across companies: each company receives the same weight, regardless of its country.
What the Comparison Showed
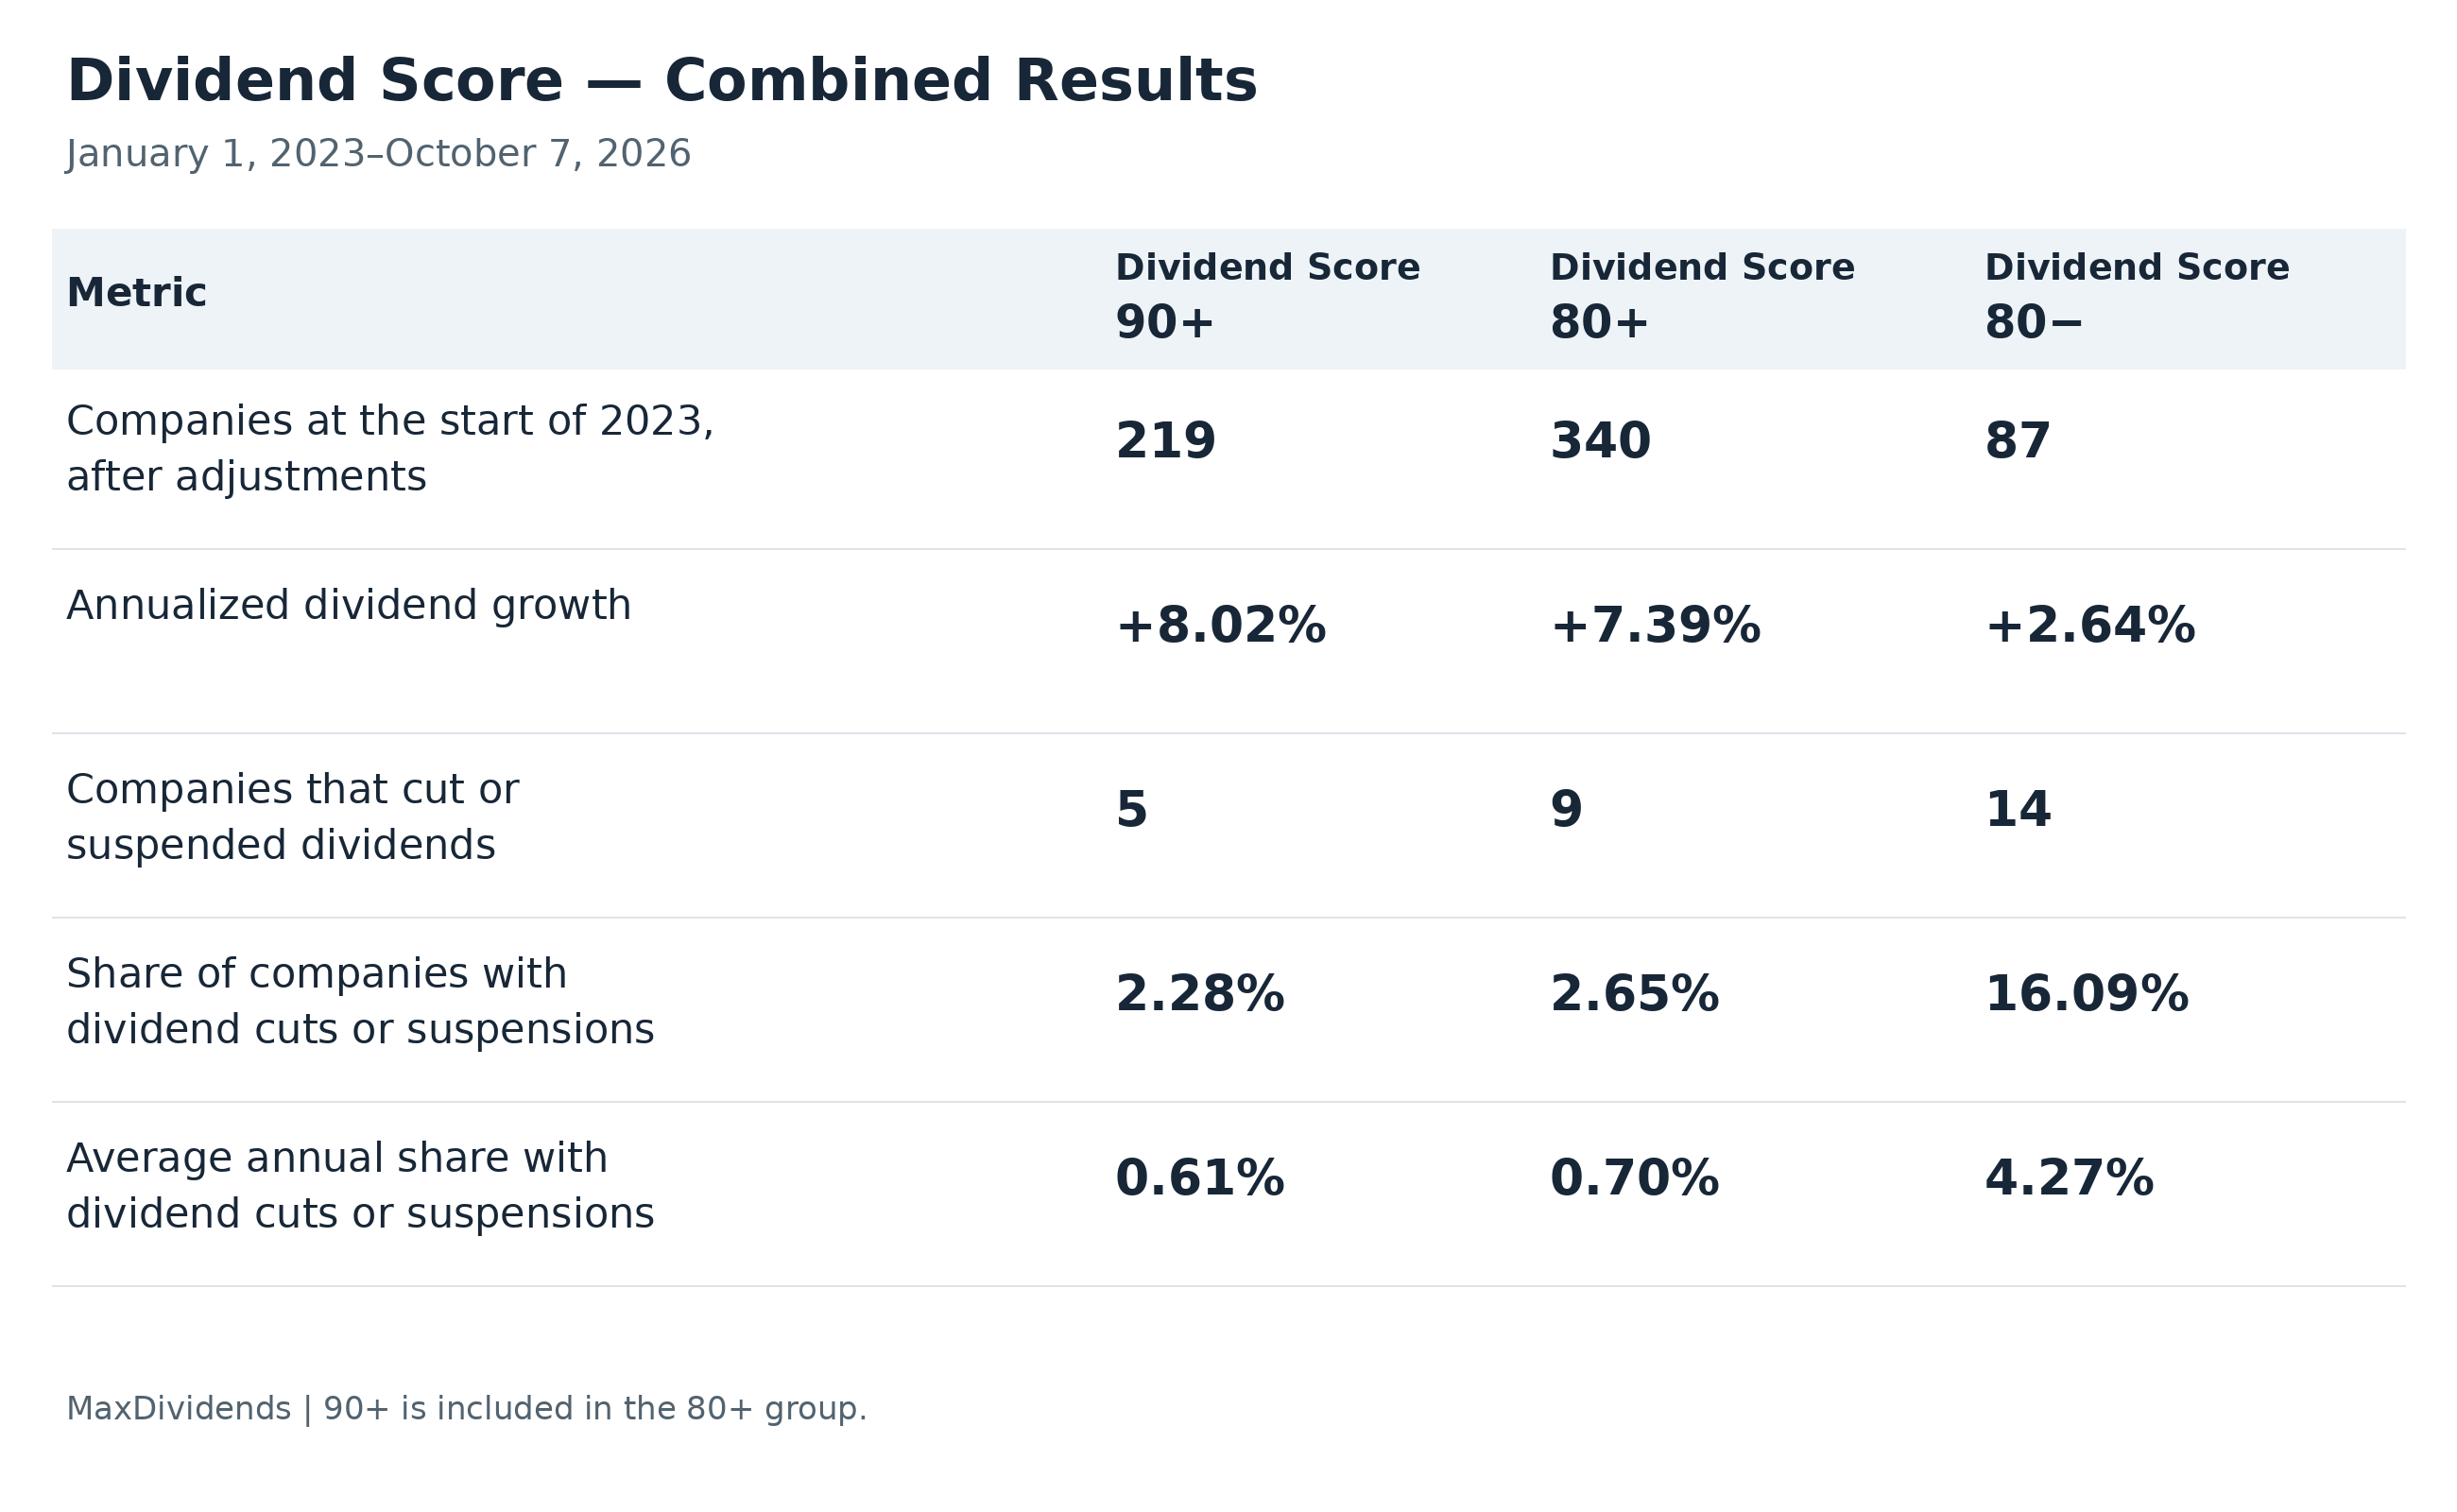
To make the difference easier to understand, let’s imagine 100 companies in each group. Over the nearly four-year study period, approximately:
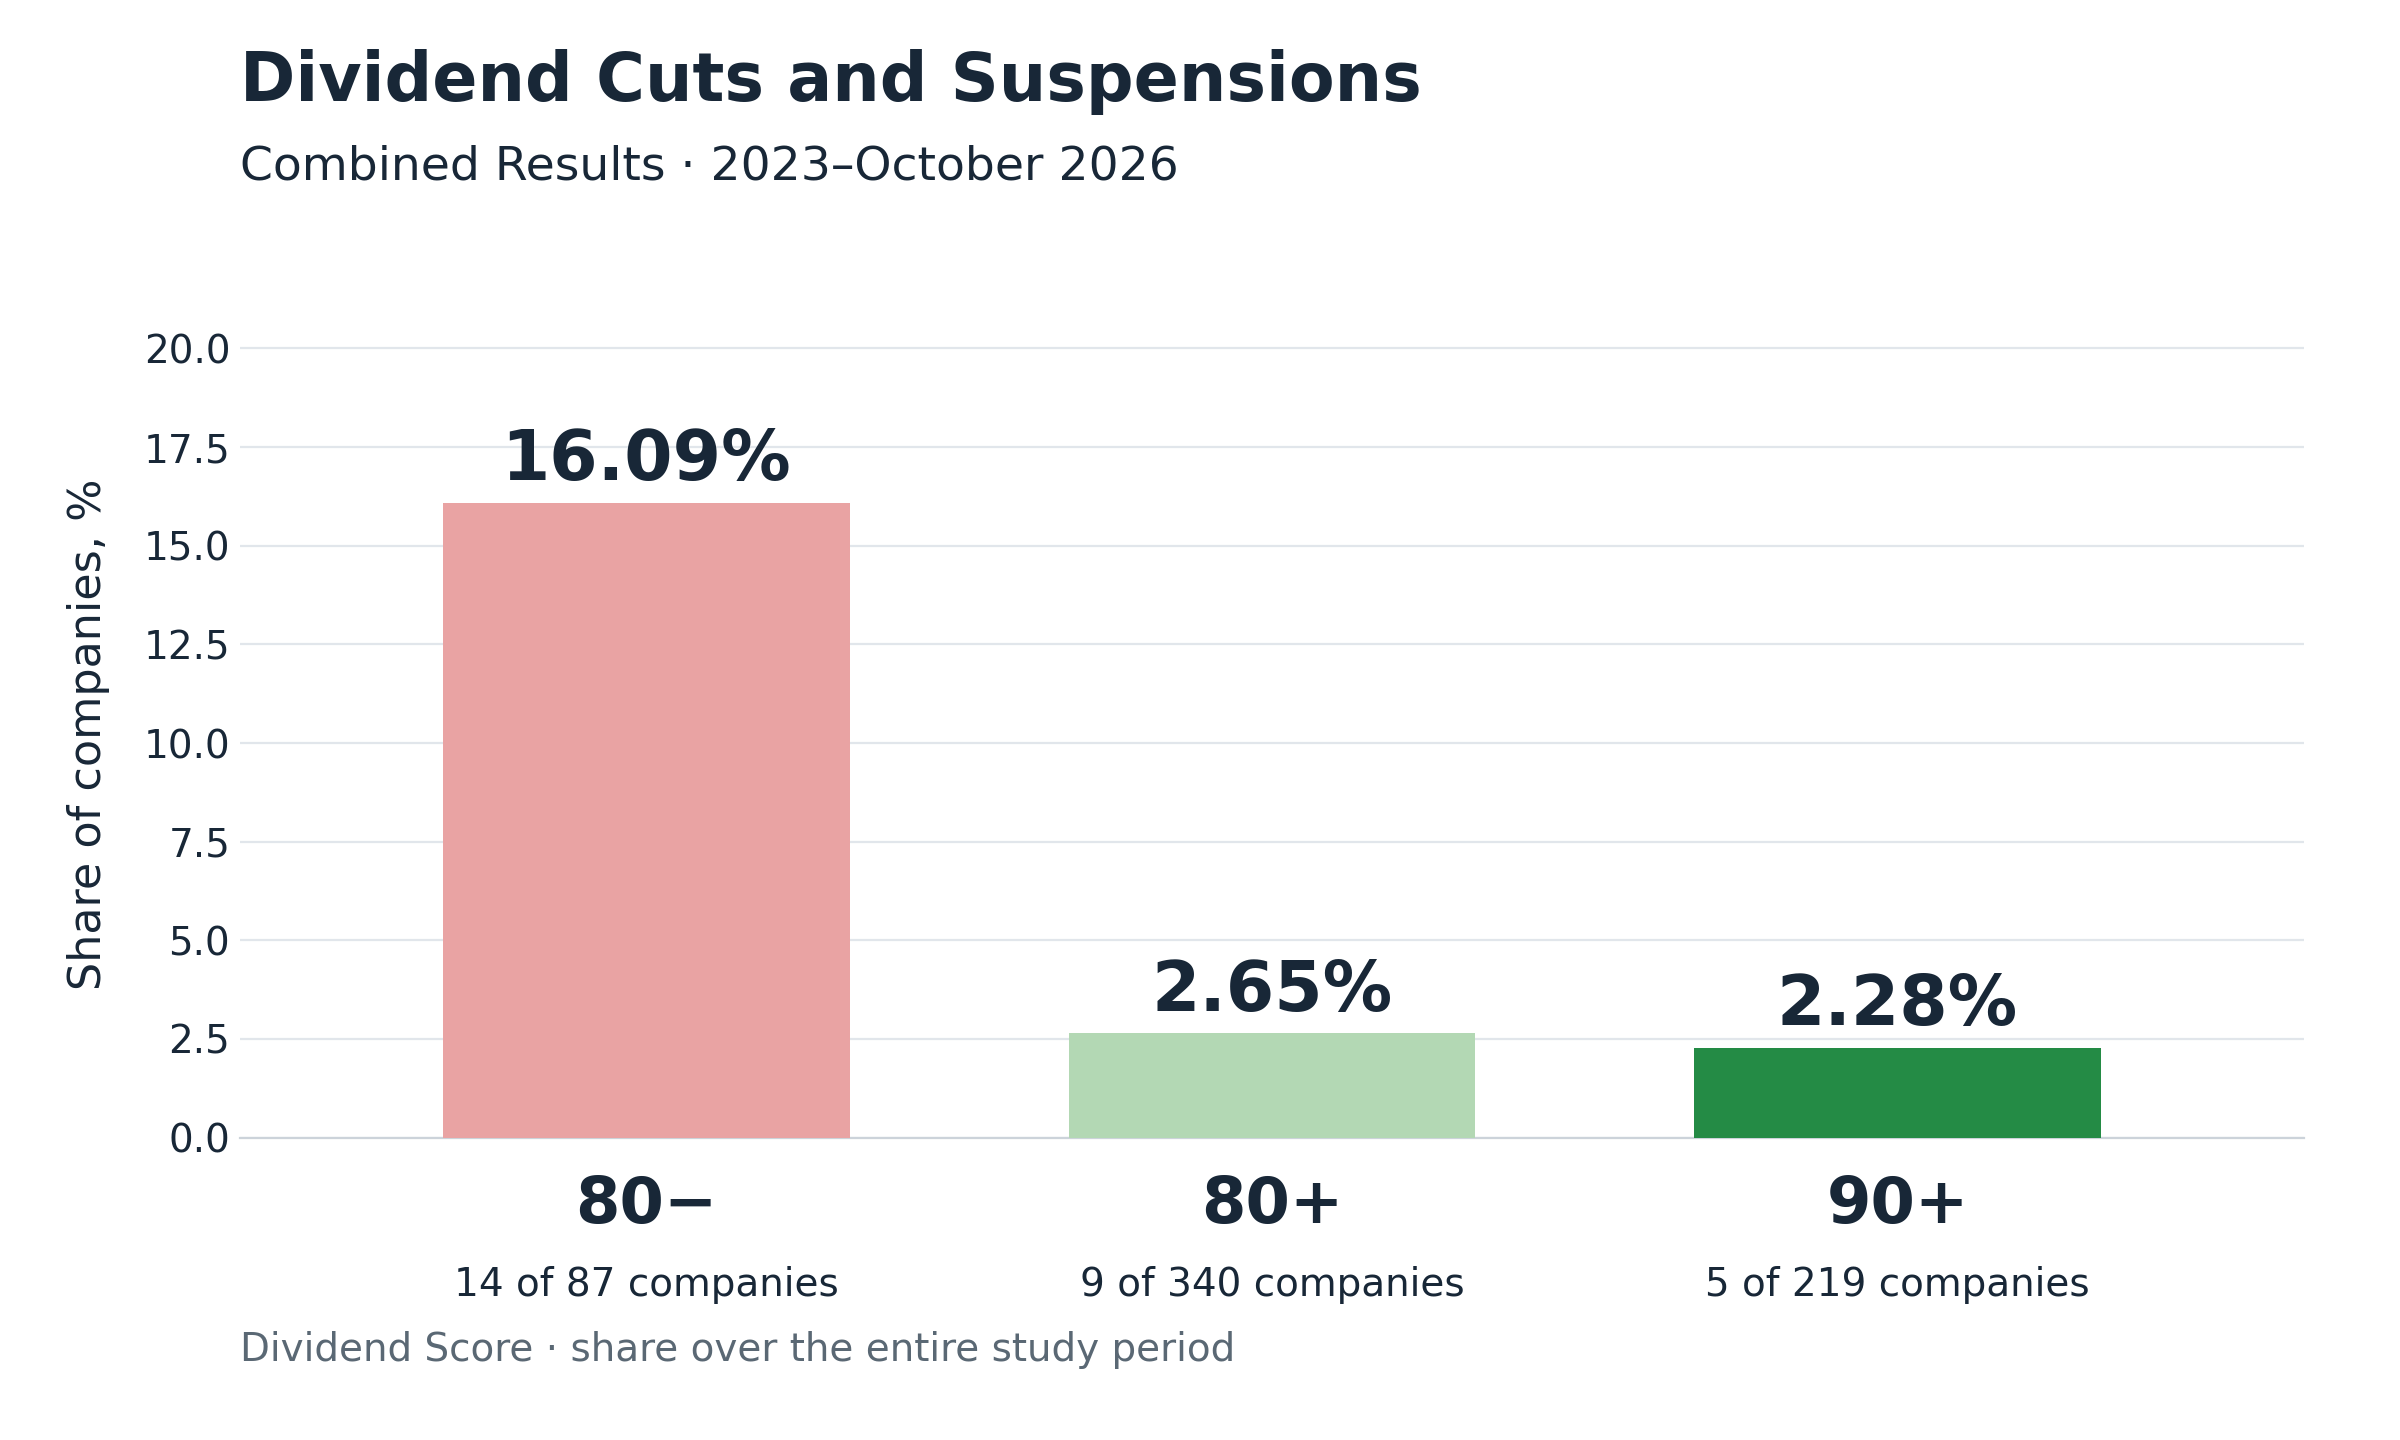
2 companies in the Dividend Score 90+ group would have cut or suspended their dividends;
3 companies in the Dividend Score 80+ group would have cut or suspended their dividends;
16 companies in the Dividend Score 80− group would have cut or suspended their dividends.
The percentage of companies that cut or suspended their dividends in the 80− group was approximately 7.0 times higher than in the 90+ group and 6.1 times higher than in the 80+ group.
Annualized dividend growth was +8.02% for the 90+ group, +7.39% for the 80+ group, and +2.64% for the 80− group.
Dividend Cuts and Annual Income Growth
The first chart shows the share of companies that reduced or eliminated their payouts over the entire study period.
Dividend Score - Combined Results (US + Global Markets)
The second illustrates annual dividend income over 20 years, starting with the same initial investment.
How Dividend Growth Changes Investor Income
Imagine investing $1,000 in each group at the same initial dividend yield of 3%.
Each investment initially generates $30 a year. Payouts then grow at different rates:
+8.02% annually for Dividend Score 90+
+7.39% for Dividend Score 80+
and +2.64% for Dividend Score 80−
Let’s look at how annual income changes if these growth rates continue.
Dividend Score - Combined Results (US + Global Markets)
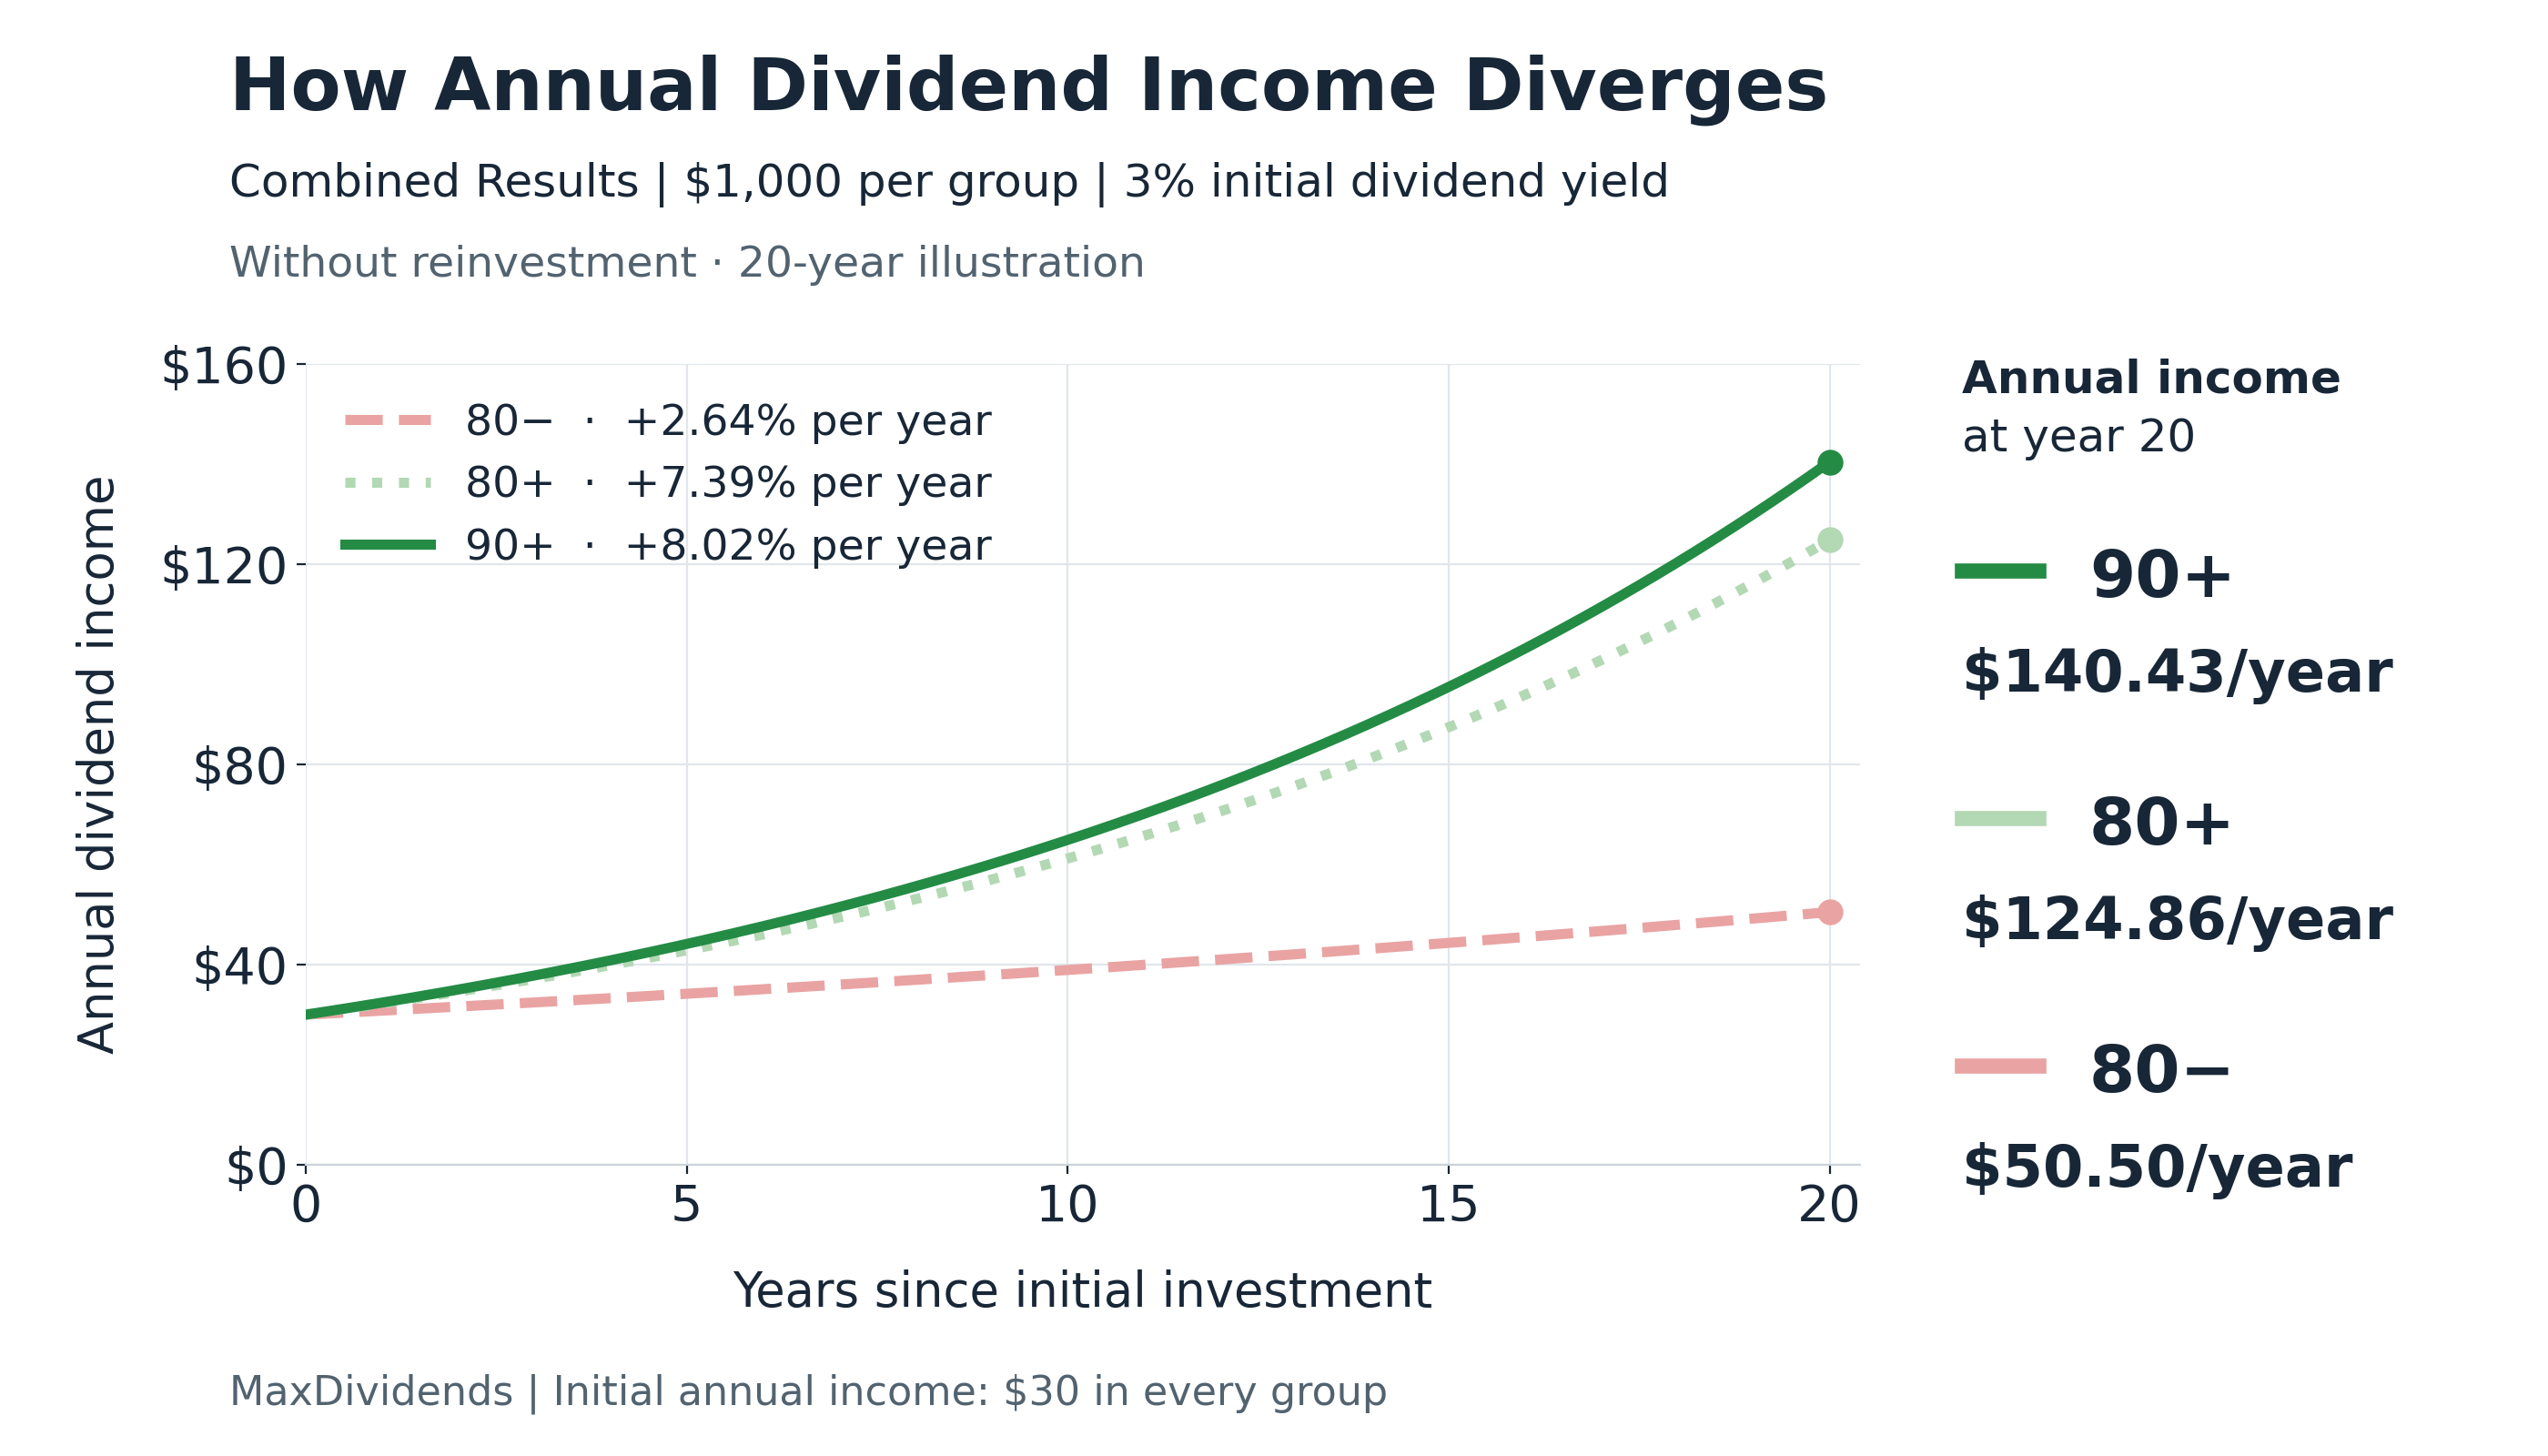
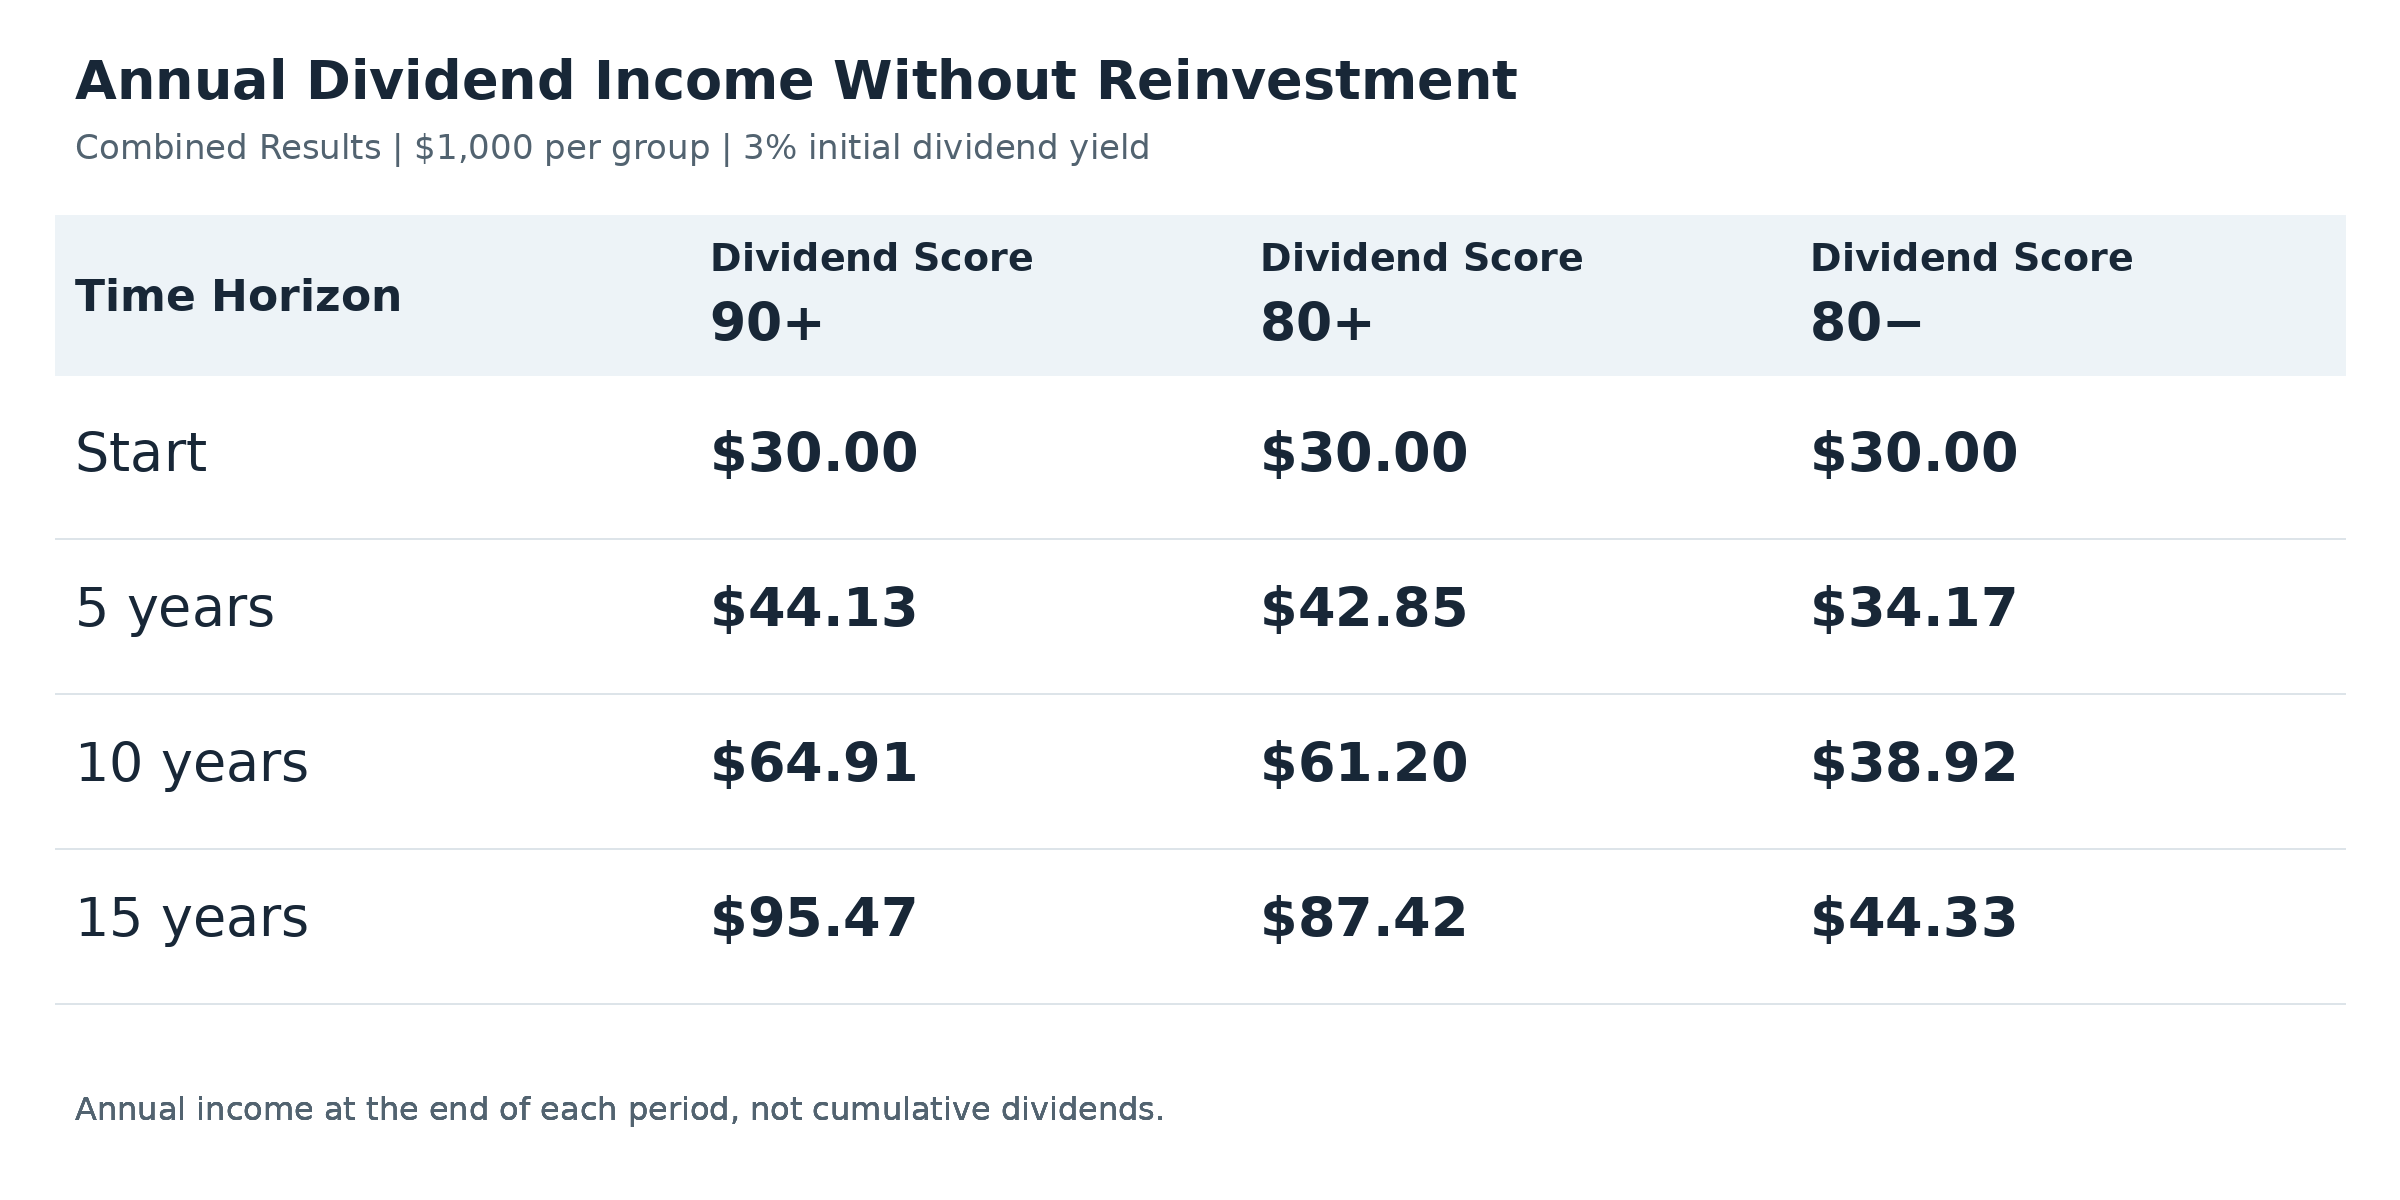
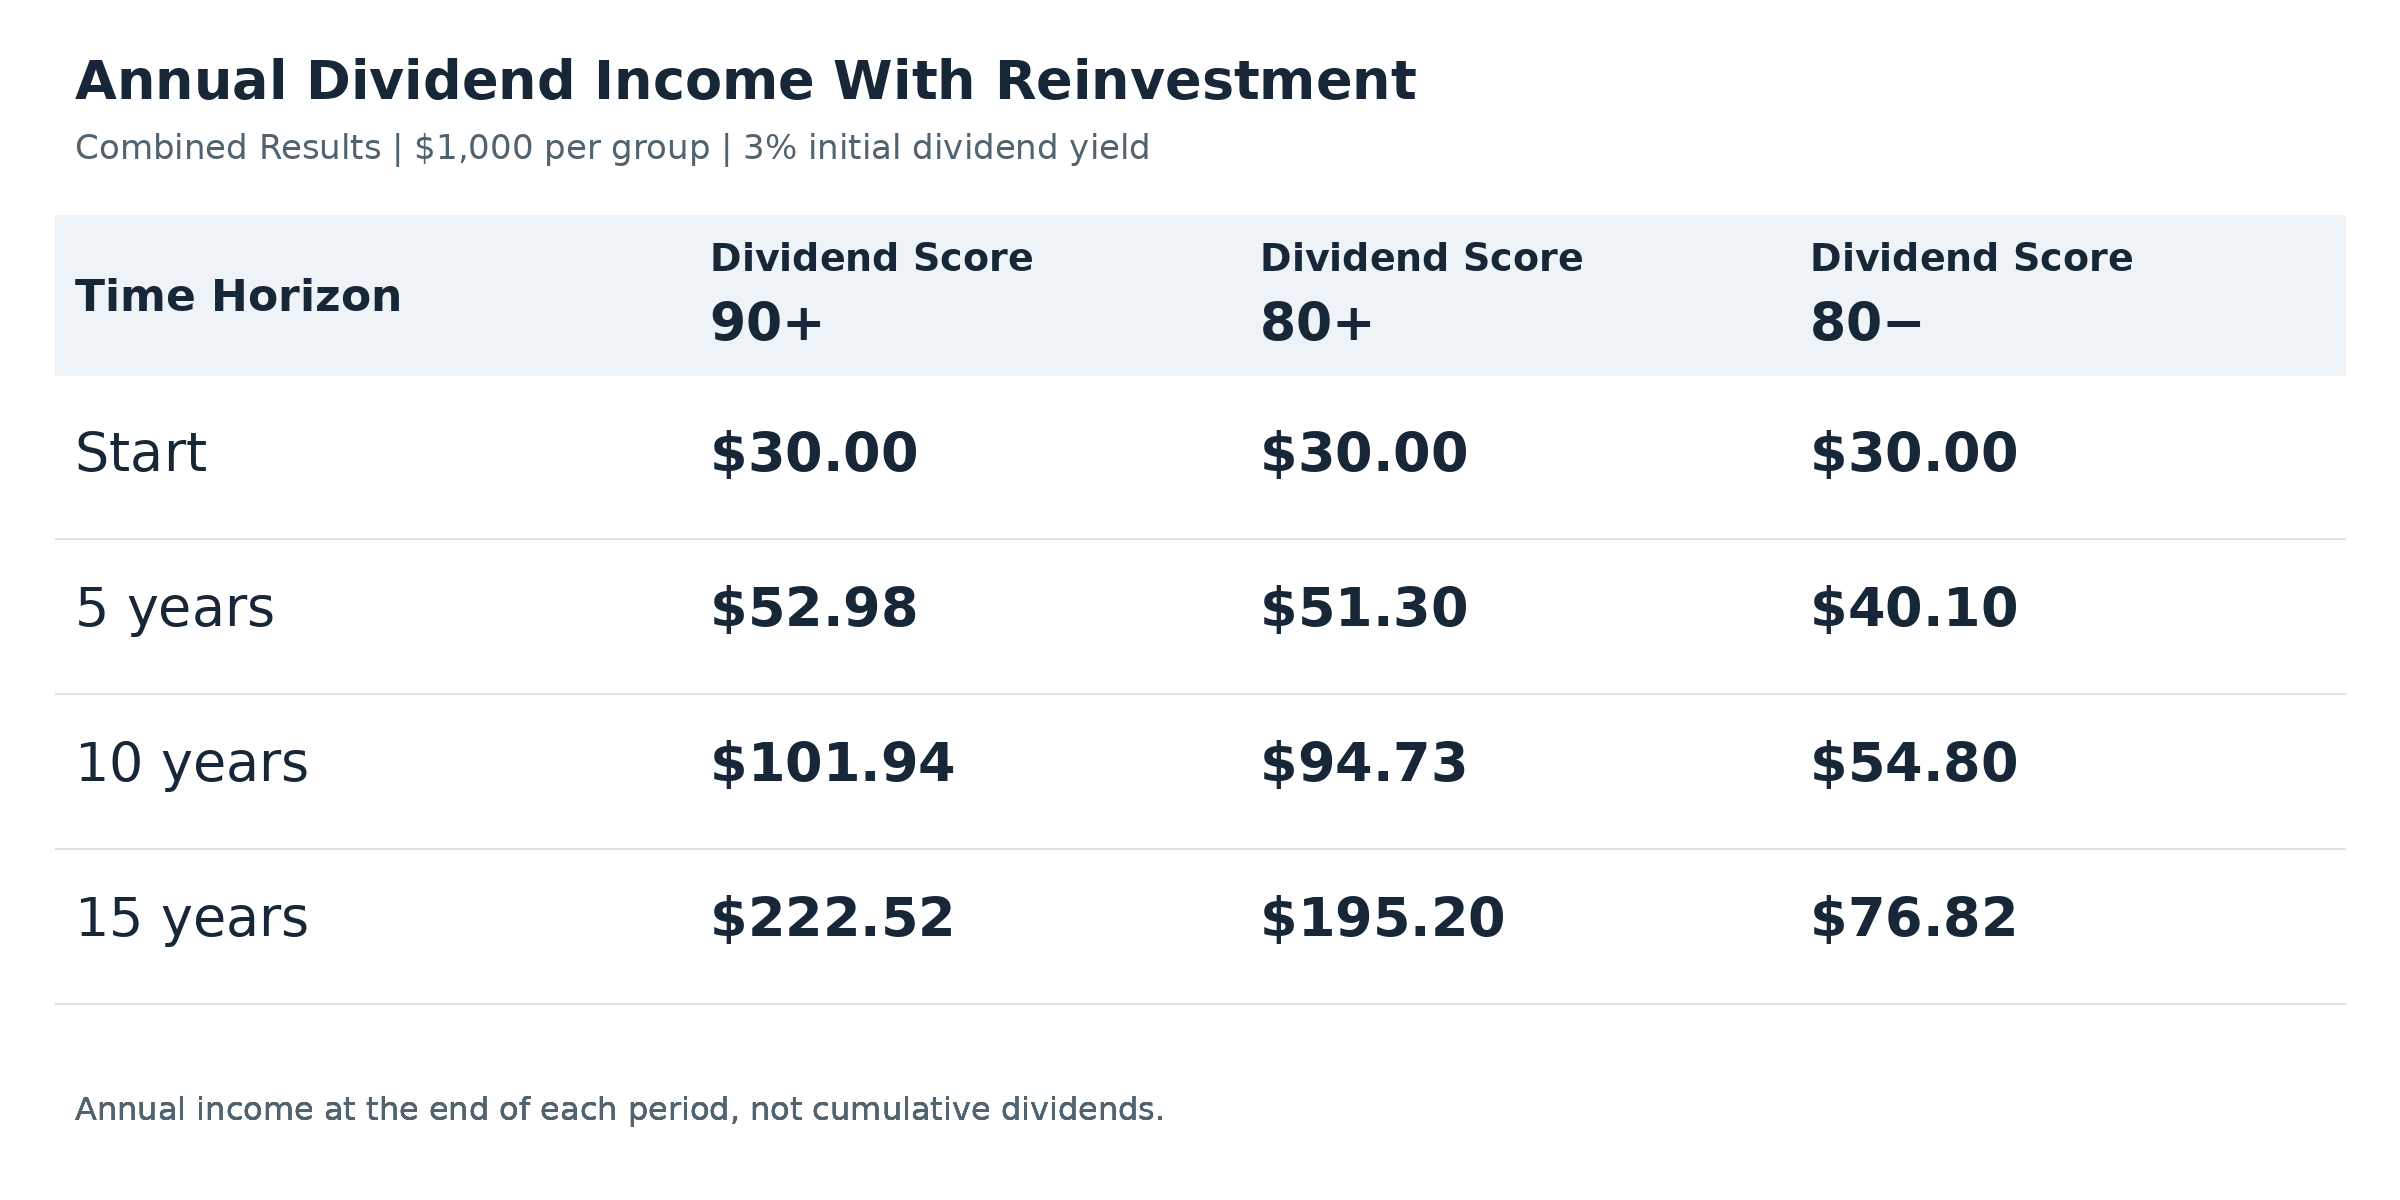
After 15 years, the investment in the Dividend Score 90+ group generates $95.47 a year without reinvestment, compared with $44.33 for the 80− group. With reinvestment, annual income reaches $222.52 versus $76.82.
Reinvestment amplifies the effect: dividends buy additional shares. Those shares also generate dividends, while the payout per share continues to grow.
Seven Key Findings From Our Dividend Score Research
1. A High Dividend Score Was Associated With More Than Three Times Faster Dividend Growth
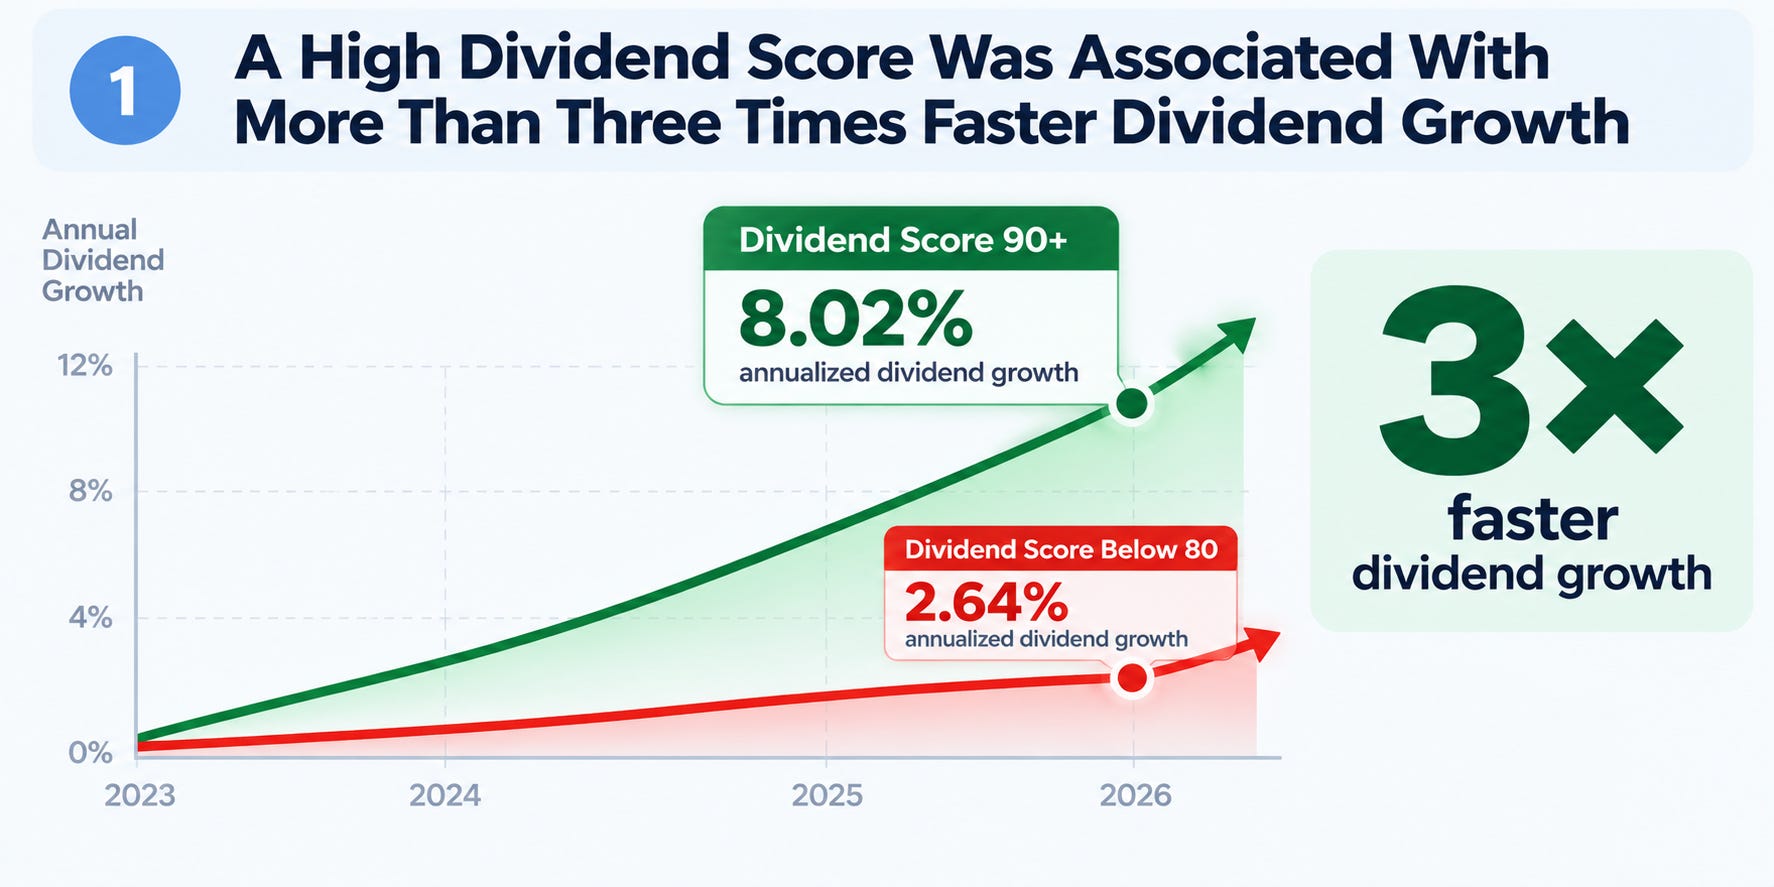
Across our combined U.S. and international sample, companies with Dividend Scores of 90 or higher delivered 8.02% annualized dividend growth, compared with just 2.64% for companies scoring below 80.
That’s approximately 3 times faster dividend growth over the study period.
2. The Risk of a Dividend Cut Was Approximately Seven Times Higher Among Low-Scoring Companies
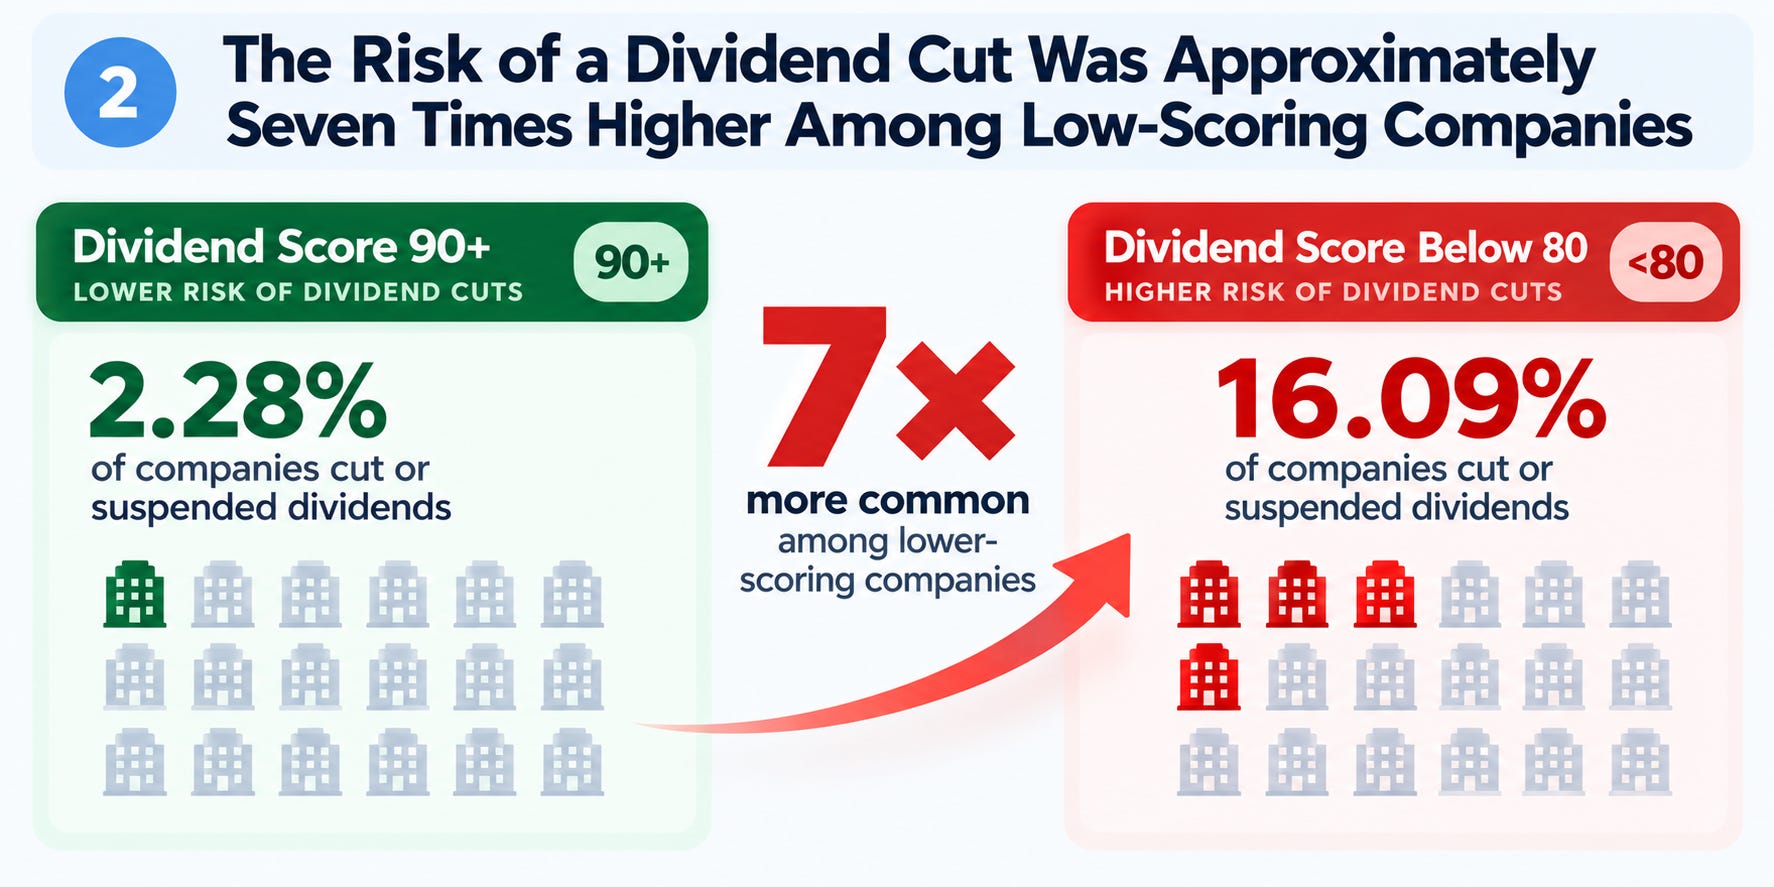
Only 2.28% of companies with Dividend Scores of 90+ cut or suspended their dividends during the study period.
Among companies scoring below 80, that figure jumped to 16.09%.
In other words, dividend cuts and suspensions were approximately 7 times more common among lower-scoring companies.
3. The Results Were Consistent Across U.S. and International Markets
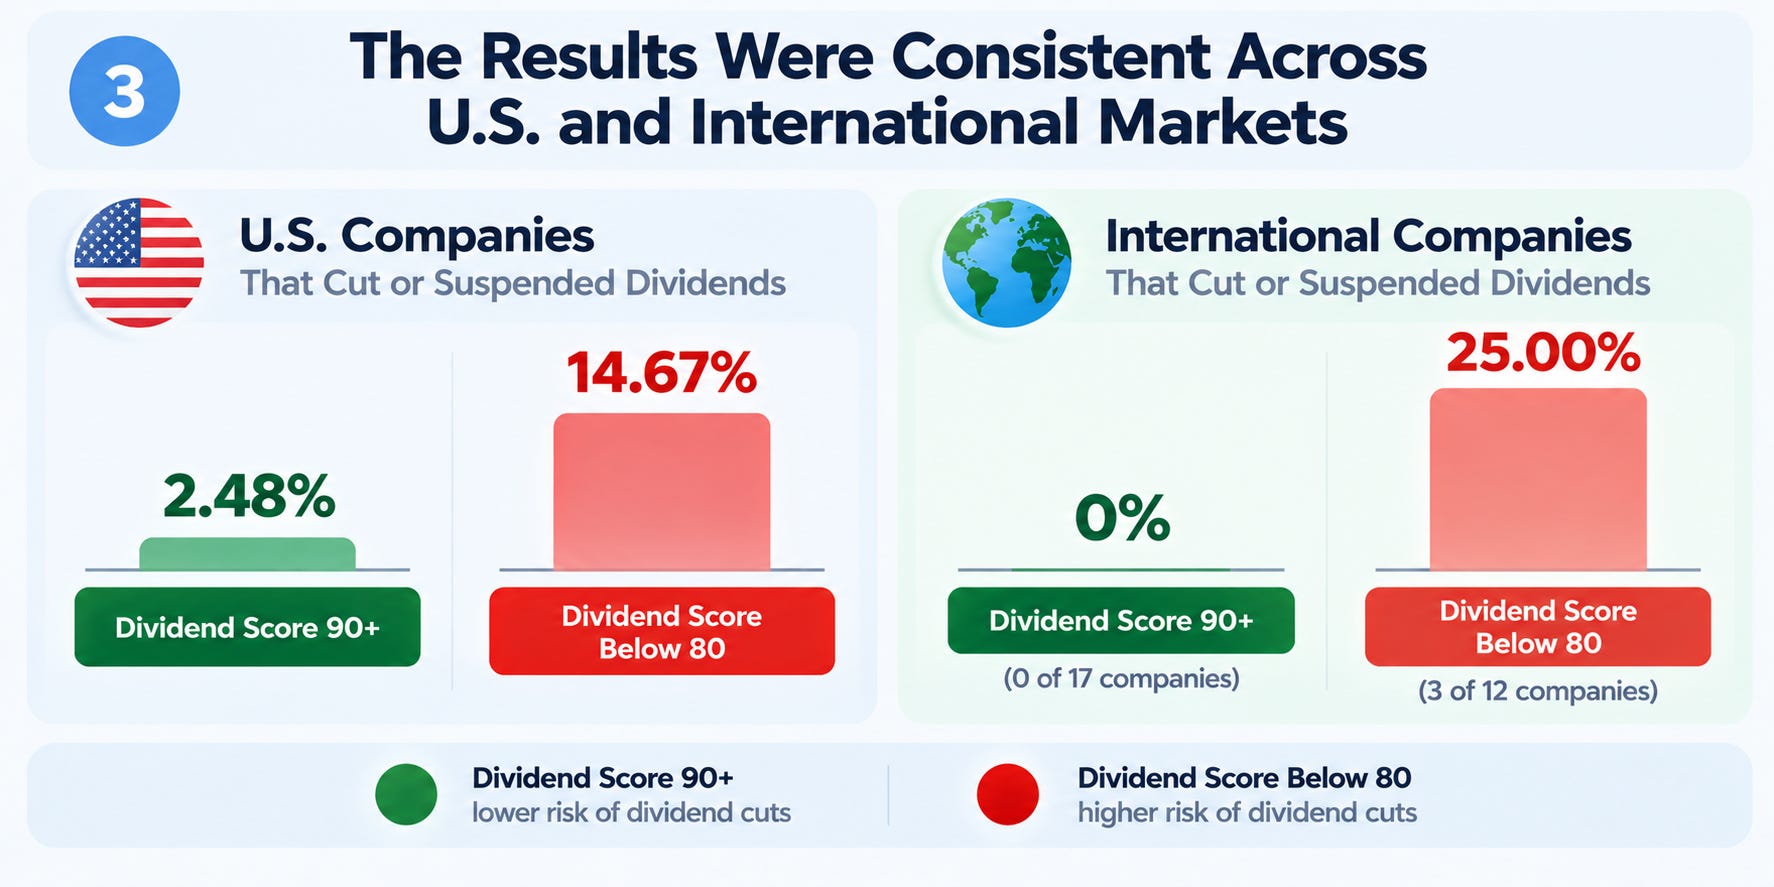
The pattern wasn’t limited to U.S. stocks.
Among U.S. companies, dividend cuts or suspensions affected 2.48% of the 90+ group, compared with 14.67% of companies scoring below 80.
Outside the U.S., none of the 17 companies scoring 90+ cut or suspended their dividends, compared with 25% of the 12 companies scoring below 80.
The international sample was much smaller, but the direction of the results was consistent.
4. Higher Dividend Scores Translated Into Stronger Portfolio-Level Dividend Growth
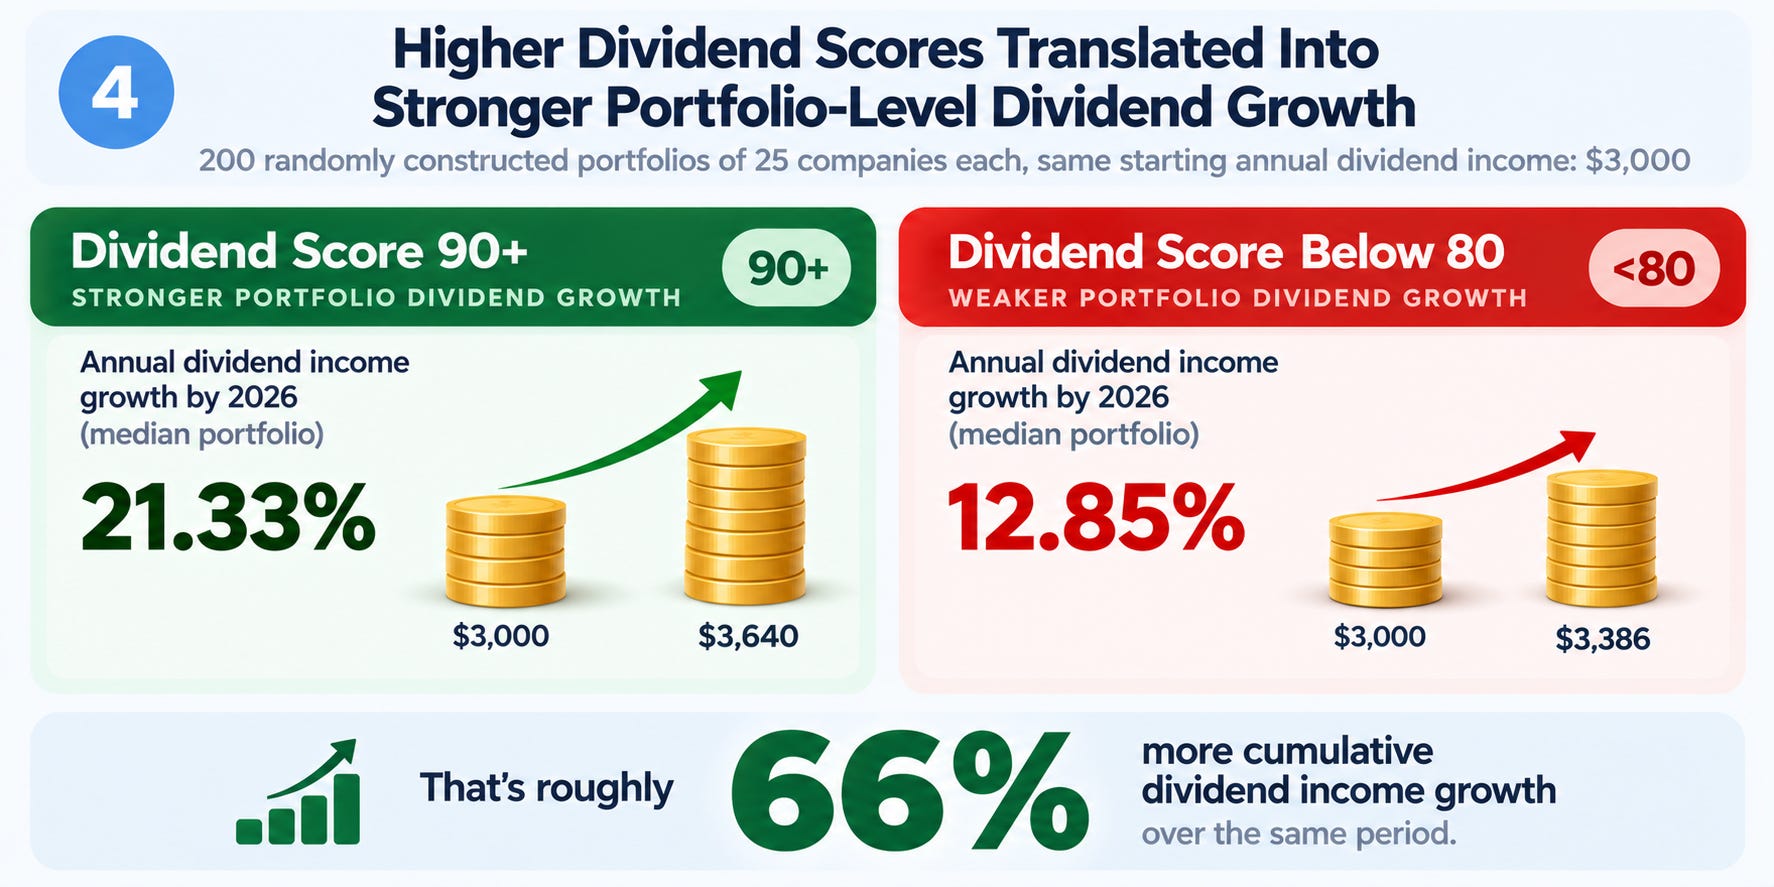
We also tested 200 randomly constructed portfolios of 25 companies each, using an identical hypothetical starting annual dividend income of $3,000.
By 2026, the median portfolio built from Dividend Score 90+ companies had increased its annual income by 21.33%, compared with 12.85% for portfolios built from companies scoring below 80.
That’s roughly 66% more cumulative dividend income growth over the same period.
5. Annual Portfolio Dividend Income Declines Were Five Times Less Frequent
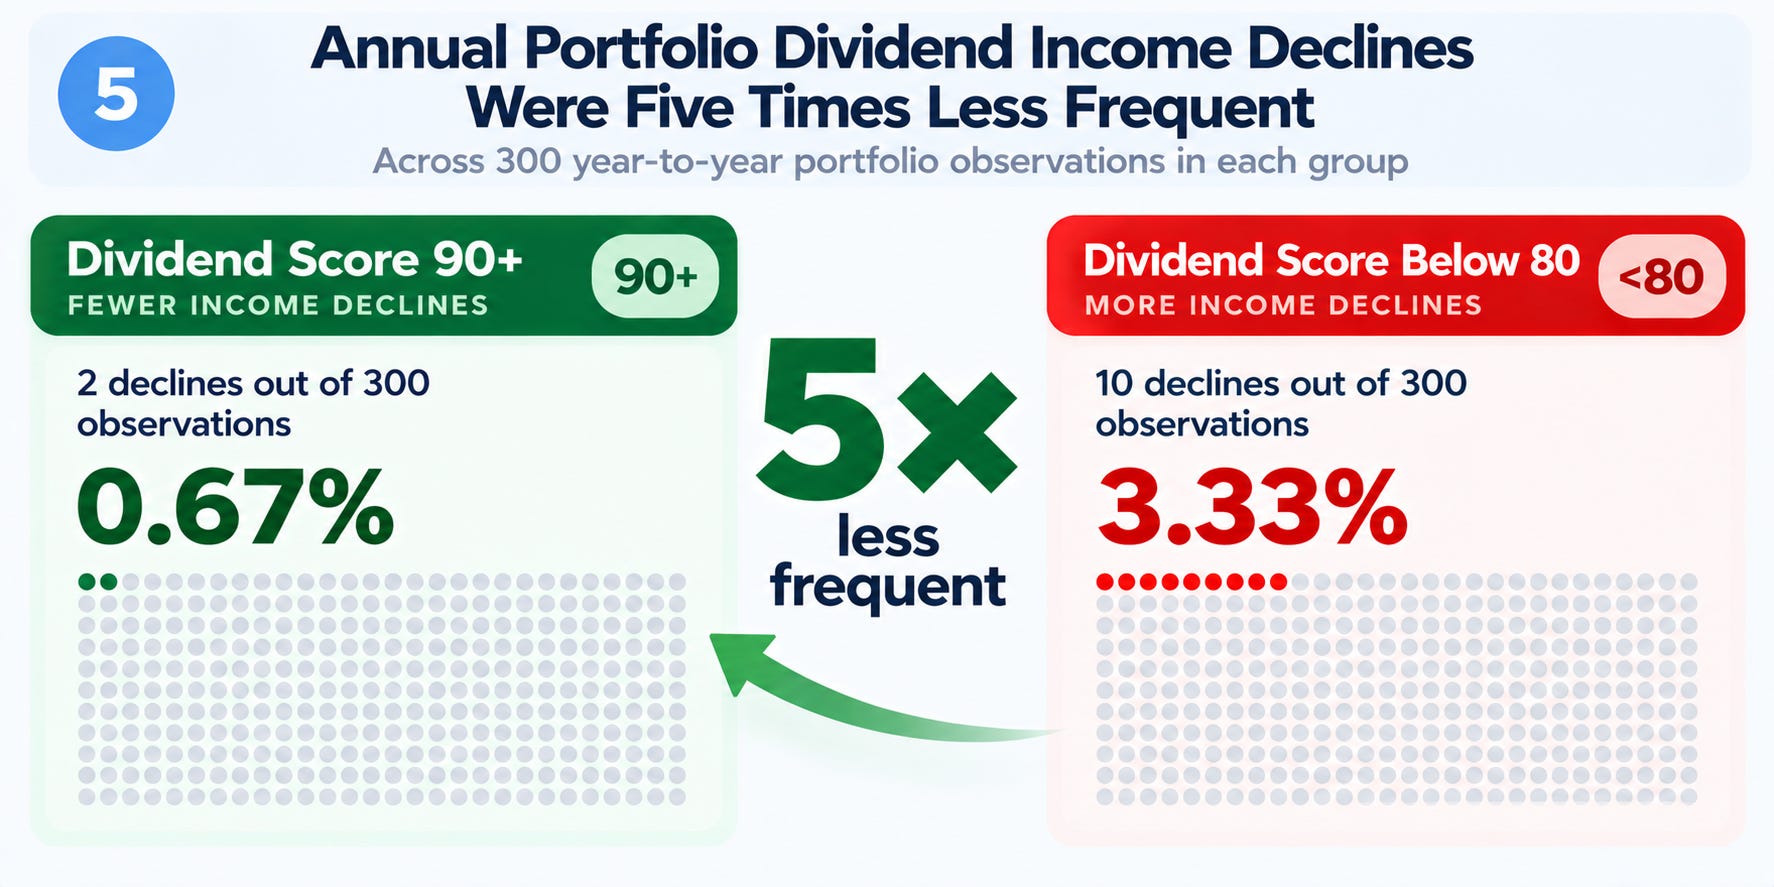
Across 300 year-to-year portfolio observations in each group, we recorded only 2 declines in total dividend income among high-score portfolios, compared with 10 declines among low-score portfolios.
That translates into an observed annual decline frequency of 0.67% versus 3.33%.
These are frequencies within our simulation, not estimates of future probabilities. Still, the difference illustrates an important advantage: high-score portfolios were better at maintaining a growing income stream.
6. When Dividend Income Grew, High-Score Portfolios Grew It 76% Faster
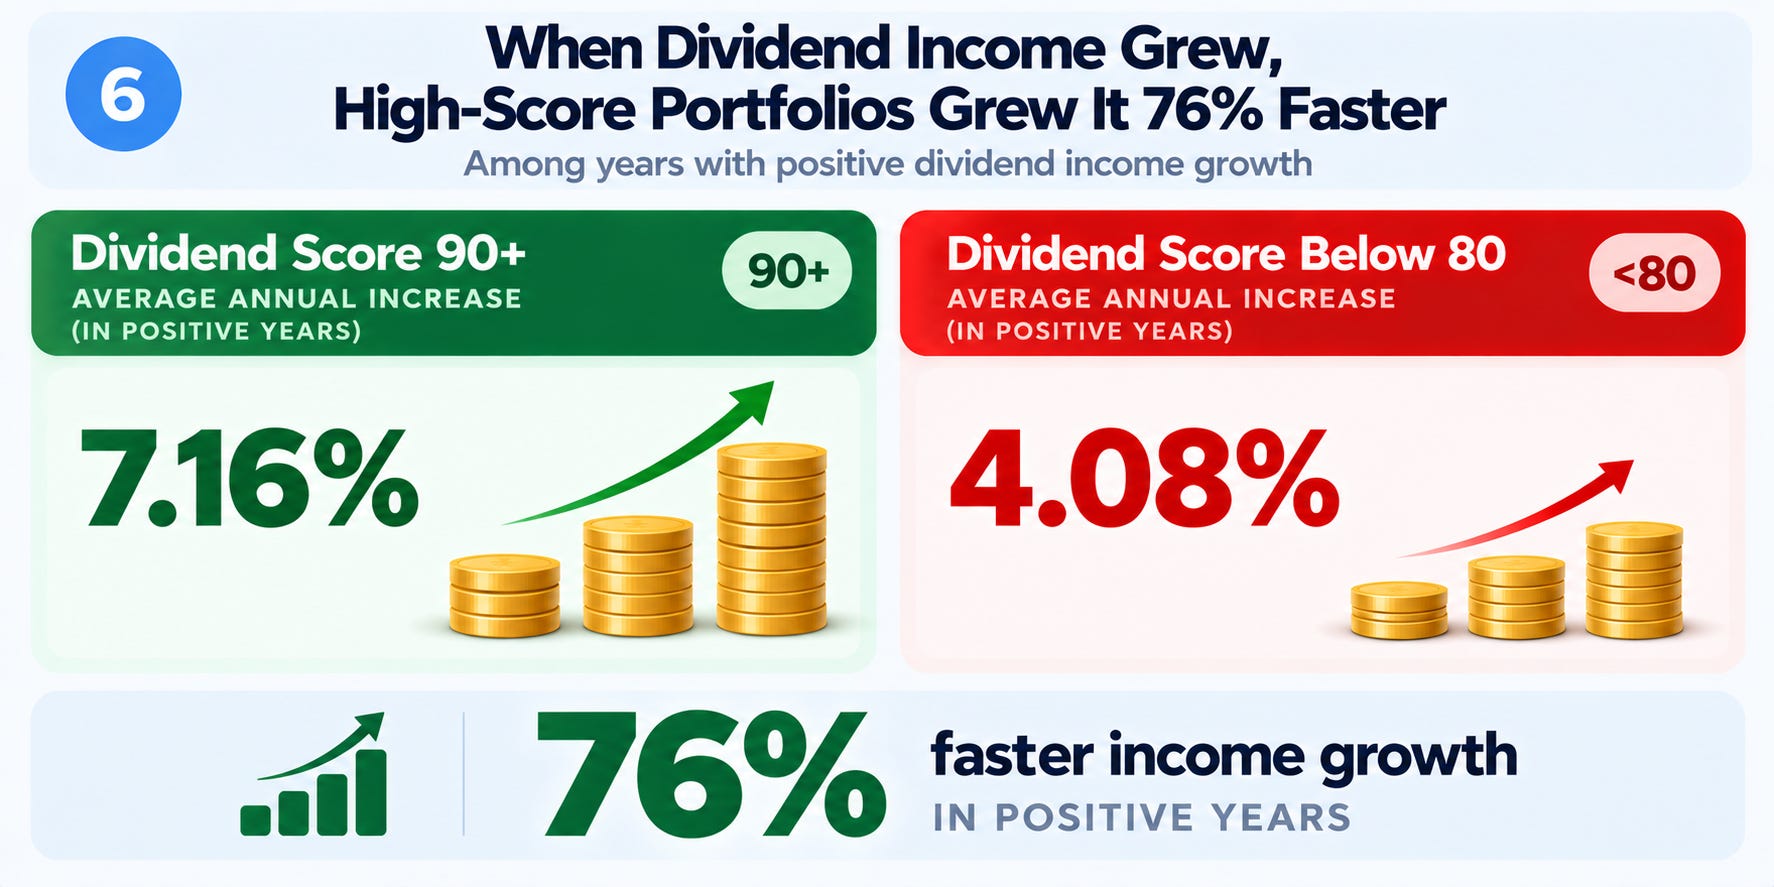
Among annual observations with positive dividend income growth, portfolios built from Dividend Score 90+ companies achieved an average increase of 7.16%.
The comparable figure for portfolios built from companies scoring below 80 was 4.08%. That represents approximately 76% faster income growth in positive years.
This matters because long-term dividend investing depends not only on avoiding setbacks, but also on maintaining a strong rate of income growth.
7. A Dividend Cut Doesn’t Have to Mean a Pay Cut for the Investor
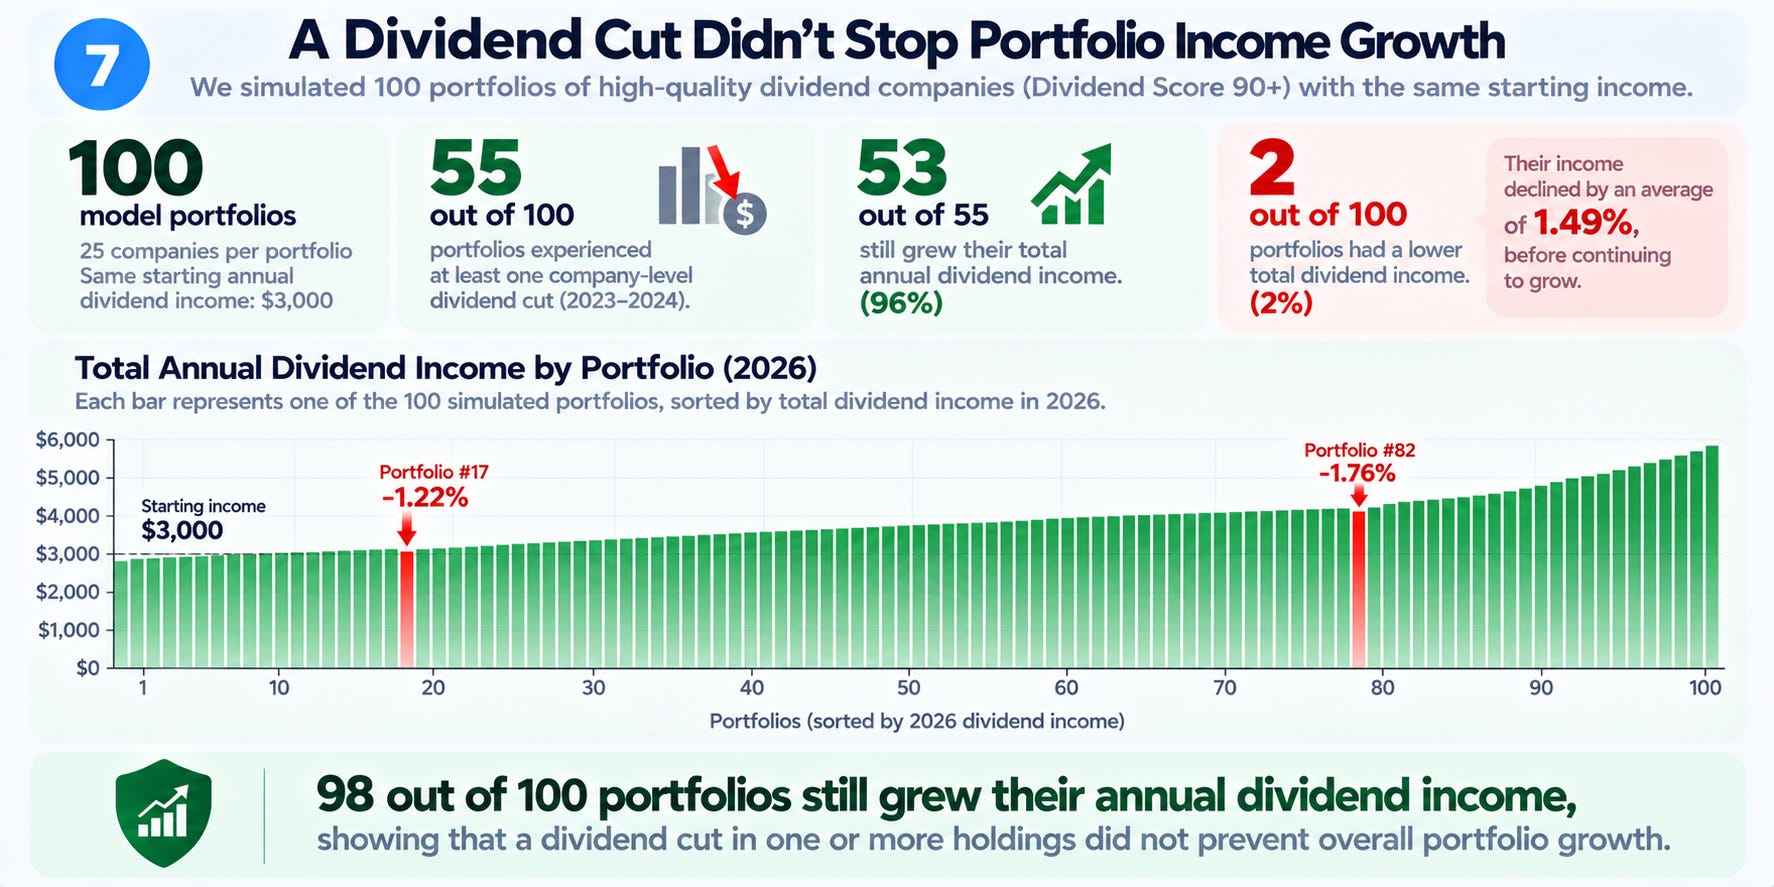
Perhaps the most practical finding came from our portfolio resilience analysis.
During the 2023–2024 interval, 55 of the 100 high-score portfolios experienced at least one company-level dividend reduction. Yet 53 of those 55 portfolios still managed to grow their total annual dividend income.
The dividend increases from other holdings were sufficient to offset the damage.
That’s the real benefit of combining diversification with dividend quality: individual companies can disappoint without necessarily interrupting the growth of the portfolio’s overall income.
— MaxDividends Team
More Articles
*Data & Sources
Dividend Score Study — Participating Companies
January 2023 – October 2026
U.S. Market — 387 companies
Ticker - Company Name - Dividend Score (2023)
A - Agilent Technologies Inc - 88
AAPL - Apple Inc - 96
ABBV - AbbVie Inc - 90
ABM - ABM Industries Incorporated - 89
ABR - Arbor Realty Trust - 83
ABT - Abbott Laboratories - 98
ACN - Accenture plc - 97
ADC - Agree Realty Corporation - 80
ADI - Analog Devices Inc - 98
ADM - Archer-Daniels-Midland Company - 96
ADP - Automatic Data Processing Inc - 96
AEE - Ameren Corp - 84
AEP - American Electric Power Co Inc - 84
AES - The AES Corporation - 42
AFG - American Financial Group Inc - 89
AFL - Aflac Incorporated - 66
AGCO - AGCO Corporation - 93
AGM - Federal Agricultural Mortgage Corporation - 85
AGO - Assured Guaranty Ltd - 66
AIT - Applied Industrial Technologies - 97
AIZ - Assurant Inc - 85
AJG - Arthur J Gallagher & Co - 92
ALL - The Allstate Corporation - 64
ALRS - Alerus Financial Corp - 77
ALSN - Allison Transmission Holdings Inc - 93
AMAT - Applied Materials Inc - 98
AMGN - Amgen Inc - 98
AMP - Ameriprise Financial Inc - 87
AMT - American Tower Corp - 84
ANDE - The Andersons Inc - 92
AON - Aon PLC - 94
AOS - Smith AO Corporation - 96
APD - Air Products and Chemicals Inc - 97
APH - Amphenol Corporation - 99
APOG - Apogee Enterprises Inc - 98
ARE - Alexandria Real Estate Equities Inc - 80
AROW - Arrow Financial Corporation - 91
ARTNA - Artesian Resources Corporation - 87
ASB - Associated Banc-Corp - 93
ASH - Ashland Global Holdings Inc - 61
ATO - Atmos Energy Corporation - 76
ATR - AptarGroup Inc - 97
AUB - Atlantic Union Bankshares Corp - 95
AUBN - Auburn National Bancorporation Inc - 85
AVA - Avista Corporation - 68
AVGO - Broadcom Inc - 92
AVNT - Avient Corp - 97
AVT - Avnet Inc - 61
AVY - Avery Dennison Corp - 97
AWK - American Water Works - 86
AWR - American States Water Company - 94
BAC - Bank of America Corp - 92
BAH - Booz Allen Hamilton Holding - 93
BANF - BancFirst Corporation - 88
BBY - Best Buy Co. Inc - 95
BC - Brunswick Corporation - 98
BCPC - Balchem Corporation - 96
BDX - Becton Dickinson and Company - 97
BEN - Franklin Resources Inc - 64
BKH - Black Hills Corporation - 86
BLK - BlackRock Inc - 97
BMI - Badger Meter Inc - 98
BMRC - Bank of Marin Bancorp - 86
BMY - Bristol-Myers Squibb Company - 78
BOKF - BOK Financial Corporation - 85
BR - Broadridge Financial Solutions Inc - 98
BRO - Brown & Brown Inc - 97
BXP - Boston Properties Inc - 90
CAH - Cardinal Health Inc - 62
CASS - Cass Information Systems Inc - 82
CAT - Caterpillar Inc - 84
CB - Chubb Ltd - 84
CBSH - Commerce Bancshares Inc - 85
CBT - Cabot Corporation - 92
CBU - Community Bank System Inc - 90
CCBG - Capital City Bank Group - 88
CCOI - Cogent Communications Group Inc - 80
CE - Celanese Corporation - 97
CFFI - C&F Financial Corporation - 81
CFR - Cullen/Frost Bankers Inc - 86
CHCO - City Holding Company - 92
CHD - Church & Dwight Company Inc - 93
CHDN - Churchill Downs Incorporated - 88
CHE - Chemed Corp - 95
CHRW - CH Robinson Worldwide Inc - 98
CINF - Cincinnati Financial Corporation - 83
CIVB - Civista Bancshares Inc - 87
CL - Colgate-Palmolive Company - 93
CLX - The Clorox Company - 95
CMCSA - Comcast Corp - 80
CME - CME Group Inc - 95
CMI - Cummins Inc - 98
CMS - CMS Energy Corporation - 89
CNO - CNO Financial Group Inc - 52
CNS - Cohen & Steers Inc - 99
COST - Costco Wholesale Corp - 96
CPK - Chesapeake Utilities Corporation - 87
CSCO - Cisco Systems Inc - 97
CSL - Carlisle Companies Incorporated - 98
CSX - CSX Corporation - 96
CTAS - Cintas Corporation - 92
CTBI - Community Trust Bancorp Inc - 88
CVX - Chevron Corp - 62
CWT - California Water Service Group - 88
DCI - Donaldson Company Inc - 98
DGICA - Donegal Group A Inc - 78
DGX - Quest Diagnostics Incorporated - 98
DHI - DR Horton Inc - 95
DKL - Delek Logistics Partners LP - 71
DOV - Dover Corporation - 74
DTE - DTE Energy Company - 84
DUK - Duke Energy Corporation - 84
EBMT - Eagle Bancorp Montana Inc - 84
ECL - Ecolab Inc - 61
ED - Consolidated Edison Inc - 83
EIX - Edison International - 67
EL - Estee Lauder Companies Inc - 98
ELS - Equity Lifestyle Properties Inc - 90
ELV - Elevance Health Inc - 97
EMN - Eastman Chemical Company - 82
EMR - Emerson Electric Company - 70
EPD - Enterprise Products Partners LP - 87
ERIE - Erie Indemnity Company - 61
ES - Eversource Energy - 86
ESS - Essex Property Trust Inc - 92
ETN - Eaton Corporation PLC - 86
EVR - Evercore Partners Inc - 99
EVRG - Evergy, Inc. - 85
EXPO - Exponent Inc - 94
FAF - First American Corporation - 74
FAST - Fastenal Company - 99
FCBC - First Community Bancshares Inc - 77
FDBC - Fidelity D&D Bancorp Inc - 91
FDS - FactSet Research Systems Inc - 99
FELE - Franklin Electric Co Inc - 98
FFIN - First Financial Bankshares Inc - 87
FIBK - First Interstate BancSystem Inc - 75
FISI - Financial Institutions Inc - 94
FIX - Comfort Systems USA Inc - 98
FLO - Flowers Foods Inc - 83
FR - First Industrial Realty Trust Inc - 93
FRME - First Merchants Corporation - 82
FRT - Federal Realty Investment Trust - 94
FSBW - FS Bancorp Inc - 86
FUL - H B Fuller Company - 98
GATX - GATX Corporation - 68
GCBC - Greene County Bancorp Inc - 87
GD - General Dynamics Corporation - 97
GEF - Greif Bros Corporation - 95
GL - Globe Life Inc - 74
GLW - Corning Incorporated - 83
GPC - Genuine Parts Co - 97
GRC - Gorman-Rupp Company - 80
GS - Goldman Sachs Group Inc - 90
GSBC - Great Southern Bancorp Inc - 82
GWW - WW Grainger Inc - 98
HBNC - Horizon Bancorp - 86
HD - The Home Depot Inc - 98
HFWA - Heritage Financial Corporation - 80
HIG - Hartford Financial Services Group - 60
HII - Huntington Ingalls Industries Inc - 89
HNI - HNI Corp - 77
HRL - Hormel Foods Corporation - 99
HSY - Hershey Co - 96
HUBB - Hubbell Inc - 97
HY - Hyster-Yale Materials Handling Inc - 58
IBCP - Independent Bank Corporation - 84
IBM - International Business Machines - 66
IBOC - International Bancshares Corporation - 87
ICE - Intercontinental Exchange Inc - 82
IDA - IDACORP Inc - 97
IEX - IDEX Corporation - 99
IFF - International Flavors & Fragrances Inc - 77
INGR - Ingredion Incorporated - 83
INTU - Intuit Inc - 91
IOSP - Innospec Inc - 90
ITT - ITT Inc - 98
ITW - Illinois Tool Works Inc - 89
JBHT - JB Hunt Transport Services Inc - 98
JJSF - J & J Snack Foods Corp - 84
JKHY - Jack Henry & Associates Inc - 97
JNJ - Johnson & Johnson - 96
JPM - JPMorgan Chase & Co - 91
KAI - Kadant Inc - 93
KBH - KB Home - 91
KLAC - KLA-Tencor Corporation - 99
KO - The Coca-Cola Company - 84
KR - Kroger Company - 78
KRO - Kronos Worldwide Inc - 60
KWR - Quaker Chemical Corporation - 84
LAD - Lithia Motors Inc - 97
LARK - Landmark Bancorp Inc - 68
LECO - Lincoln Electric Holdings Inc - 89
LEG - Leggett & Platt Incorporated - 98
LFUS - Littelfuse Inc - 97
LHX - L3Harris Technologies Inc - 98
LII - Lennox International Inc - 97
LKFN - Lakeland Financial Corporation - 92
LMAT - LeMaitre Vascular Inc - 96
LMT - Lockheed Martin Corporation - 98
LNN - Lindsay Corporation - 70
LNT - Alliant Energy Corp - 85
LOW - Lowe’s Companies Inc - 96
LSTR - Landstar System Inc - 96
LTC - LTC Properties Inc - 92
LYB - LyondellBasell Industries NV - 63
MA - Mastercard Inc - 99
MAA - Mid-America Apartment Communities Inc - 77
MAN - ManpowerGroup Inc - 71
MAS - Masco Corporation - 97
MATW - Matthews International Corporation - 64
MATX - Matson Inc - 51
MCD - McDonald’s Corporation - 85
MCHP - Microchip Technology Inc - 95
MCK - McKesson Corporation - 75
MCO - Moodys Corporation - 98
MDLZ - Mondelez International Inc - 59
MDT - Medtronic PLC - 98
MDU - MDU Resources Group Inc - 93
MGEE - MGE Energy Inc - 73
MGRC - McGrath RentCorp - 98
MKC - McCormick & Company Incorporated - 90
MKTX - MarketAxess Holdings Inc - 98
MLI - Mueller Industries Inc - 96
MMM - 3M Company - 85
MNRO - Monro Muffler Brake Inc - 91
MO - Altria Group - 90
MORN - Morningstar Inc - 90
MRK - Merck & Company Inc - 98
MS - Morgan Stanley - 81
MSA - MSA Safety - 97
MSEX - Middlesex Water Company - 89
MSFT - Microsoft Corporation - 99
MSI - Motorola Solutions Inc - 90
NBTB - NBT Bancorp Inc - 95
NC - NACCO Industries Inc - 80
NDAQ - Nasdaq Inc - 89
NDSN - Nordson Corporation - 99
NEE - Nextera Energy Inc - 84
NFG - National Fuel Gas Company - 71
NI - NiSource Inc - 51
NJR - NewJersey Resources Corporation - 77
NKE - Nike Inc - 97
NNN - NNN REIT Inc - 90
NOC - Northrop Grumman Corporation - 98
NRIM - Northrim BanCorp Inc - 87
NUE - Nucor Corp - 99
NUS - Nu Skin Enterprises Inc - 66
NWE - NorthWestern Corporation - 85
NWFL - Norwood Financial Corp - 96
NWN - Northwest Natural Gas Co - 74
NXST - Nexstar Broadcasting Group Inc - 92
O - Realty Income Corporation - 82
OC - Owens Corning Inc - 86
ODC - Oil-Dri Corporation Of America - 83
OGE - OGE Energy Corporation - 64
OKE - ONEOK Inc - 84
OLP - One Liberty Properties Inc - 90
ORI - Old Republic International Corp - 70
OSK - Oshkosh Corporation - 82
OTTR - Otter Tail Corporation - 92
OZK - Bank Ozk - 92
PAYX - Paychex Inc - 94
PB - Prosperity Bancshares Inc - 93
PCAR - PACCAR Inc - 96
PEG - Public Service Enterprise Group Inc - 55
PEP - PepsiCo Inc - 96
PFE - Pfizer Inc - 97
PFG - Principal Financial Group Inc - 75
PH - Parker-Hannifin Corporation - 98
PII - Polaris Industries Inc - 84
PKG - Packaging Corp of America - 99
PLD - Prologis Inc - 95
PM - Philip Morris International Inc - 70
PNC - PNC Financial Services Group Inc - 81
PNW - Pinnacle West Capital Corp - 74
POOL - Pool Corporation - 99
POR - Portland General Electric Co - 89
PPG - PPG Industries Inc - 87
PRGO - Perrigo Company PLC - 60
PRI - Primerica Inc - 89
PSX - Phillips 66 - 78
QCOM - Qualcomm Incorporated - 98
RBCAA - Republic Bancorp Inc - 85
REG - Regency Centers Corporation - 87
RF - Regions Financial Corporation - 91
RGA - Reinsurance Group of America - 91
RGCO - RGC Resources Inc - 77
RGLD - Royal Gold Inc - 88
RHI - Robert Half International Inc - 99
RLI - RLI Corp - 91
RMD - ResMed Inc - 96
RNR - Renaissancere Holdings Ltd - 69
ROK - Rockwell Automation Inc - 98
ROP - Roper Technologies, Inc. - 94
RPM - RPM International Inc - 98
RRX - Regal Beloit Corporation - 97
RS - Reliance Steel & Aluminum Co - 98
RSG - Republic Services Inc - 88
RTX - Raytheon Technologies Corp - 77
SBFG - SB Financial Group Inc - 85
SBUX - Starbucks Corporation - 95
SCI - Service Corporation International - 87
SCL - Stepan Company - 97
SFBS - ServisFirst Bancshares Inc - 73
SFNC - Simmons First National Corporation - 85
SGC - Superior Uniform Group Inc - 91
SHW - Sherwin-Williams Co - 94
SIGI - Selective Insurance Group Inc - 95
SJM - The J. M. Smucker Company - 95
SMBC - Southern Missouri Bancorp Inc - 90
SMG - Scotts Miracle-Gro Company - 75
SNA - Snap-On Inc - 99
SO - Southern Company - 84
SPGI - S&P Global Inc - 98
SR - Spire Inc - 82
SRCE - 1st Source Corporation - 94
SRE - Sempra Energy - 87
SSD - Simpson Manufacturing Company Inc - 95
STBA - S&T Bancorp Inc - 82
STE - STERIS plc - 93
STLD - Steel Dynamics Inc - 96
STT - State Street Corp - 86
SWK - Stanley Black & Decker Inc - 94
SWKS - Skyworks Solutions Inc - 92
SWX - Southwest Gas Holdings Inc - 68
SXI - Standex International Corporation - 82
SYBT - Stock Yards Bancorp Inc - 90
SYK - Stryker Corporation - 98
SYY - Sysco Corporation - 81
TCBK - TriCo Bancshares - 90
TDS - Telephone and Data Systems Inc - 83
TEL - TE Connectivity Ltd - 97
TGT - Target Corporation - 90
THFF - First Financial Corporation Indiana - 90
THG - The Hanover Insurance Group Inc - 83
THO - Thor Industries Inc - 97
TKR - Timken Company - 95
TNC - Tennant Company - 98
TOWN - Towne Bank - 87
TR - Tootsie Roll Industries Inc - 79
TRN - Trinity Industries Inc - 62
TRNO - Terreno Realty Corporation - 88
TROW - T. Rowe Price Group Inc - 99
TRV - The Travelers Companies Inc - 75
TSCO - Tractor Supply Company - 99
TSLX - Sixth Street Specialty Lending Inc - 67
TSN - Tyson Foods Inc - 94
TTC - Toro Co - 97
TXN - Texas Instruments Incorporated - 99
UBSI - United Bankshares Inc - 96
UDR - UDR Inc - 84
UFPI - Ufp Industries Inc - 98
UGI - UGI Corporation - 91
UHT - Universal Health Realty Income Trust - 87
UMBF - UMB Financial Corporation - 86
UNB - Union Bankshares Inc - 84
UNH - UnitedHealth Group Incorporated - 89
UNM - Unum Group - 94
UNP - Union Pacific Corporation - 85
UNTY - Unity Bancorp Inc - 88
UPS - United Parcel Service Inc - 98
USB - U.S. Bancorp - 95
USPH - US Physicalrapy Inc - 95
UTMD - Utah Medical Products Inc - 93
UVV - Universal Corporation - 69
V - Visa Inc. Class A - 99
VZ - Verizon Communications Inc - 91
WABC - Westamerica Bancorporation - 94
WASH - Washington Trust Bancorp Inc - 86
WDFC - WD-40 Company - 98
WEC - WEC Energy Group Inc - 86
WLK - Westlake Chemical Corporation - 98
WLY - John Wiley & Sons - 70
WM - Waste Management Inc - 90
WSBC - WesBanco Inc - 93
WSFS - WSFS Financial Corporation - 86
WSM - Williams-Sonoma Inc - 97
WSO - Watsco Inc - 95
WST - West Pharmaceutical Services Inc - 99
WTRG - Essential Utilities Inc - 88
WTS - Watts Water Technologies Inc - 96
WU - Western Union Co - 62
XEL - Xcel Energy Inc - 87
XOM - Exxon Mobil Corp - 56
XYL - Xylem Inc - 96
YORW - The York Water Company - 94
Global Markets (Excluding the U.S.) — 40 companies
Ticker - Company Name - Dividend Score (2023)
ACO-X - ATCO Ltd - 69
ASSA-B - ASSA ABLOY AB (publ) - 95
ATD - Alimentation Couchen Tard Inc A - 58
BCE - BCE Inc - 82
BMO - Bank of Montreal - 59
BRG - Borregaard ASA - 95
CCA - Cogeco Communications Inc - 89
CGO - Cogeco Inc. - 88
CNR - Canadian National Railway Co - 91
CRT-UN - CT Real Estate Investment Trust - 41
CTC - Canadian Tire Corporation Limited - 99
CU - Canadian Utilities Limited - 86
DOL - Dollarama Inc - 93
EMA - Emera Inc. - 90
EMP-A - Empire Company Limited - 50
ENB - Enbridge Inc - 82
ENGH - Enghouse Systems Ltd - 97
FTS - Fortis Inc - 82
HUH1V - Huhtamaki Oyj - 98
IMO - Imperial Oil Ltd - 83
JM - JM AB (publ) - 99
L - Loblaw Companies Limited - 99
LOGN - Logitech International S.A. - 91
MFC - Manulife Financial Corp - 85
MG - Magna International Inc - 84
MRU - Metro Inc. - 99
NA - National Bank of Canada - 71
PBH - Premium Brands Holdings Corporation - 98
RBA - Ritchie Bros Auctioneers - 95
RY - Royal Bank of Canada - 76
SAGA-A - AB Sagax (publ) - 53
SAP - Saputo Inc - 92
SCANFL - Scanfil Oyj - 96
SJ - Stella-Jones Inc. - 99
SVOL-A - Svolder AB (publ) - 86
T - Telus Corp - 82
TD - Toronto Dominion Bank - 88
TEL - Telenor ASA - 70
TIETO - TietoEVRY Corp - 50
TIH - Toromont Industries Ltd. - 99
Companies That Cut or Suspended Dividends (2023–October 2026)
ABR — Arbor Realty Trust — May 2025 — $0.43 to $0.30 quarterly (−30.2%) — Dividend Score at the Time of the Cut: 90
AMT — American Tower Corporation — March 2024 — $1.70 to $1.62 quarterly (−4.7%) — Dividend Score at the Time of the Cut: 86
ARE — Alexandria Real Estate Equities — December 2025 — $1.32 to $0.72 quarterly (−45.5%) — Dividend Score at the Time of the Cut: 70
BXP — BXP, Inc. — September 2025 — $0.98 to $0.70 quarterly (−28.6%) — Dividend Score at the Time of the Cut: 74
CCOI — Cogent Communications Holdings — November 2025 — $1.015 to $0.02 quarterly (−98.0%) — Dividend Score at the Time of the Cut: 54
CE — Celanese Corporation — November 2024 — $0.70 to $0.03 quarterly (−95.7%) — Dividend Score at the Time of the Cut: 96
EL — The Estée Lauder Companies — October 2024 — $0.66 to $0.35 quarterly (−47.0%) — Dividend Score at the Time of the Cut: 97
FLO — Flowers Foods — May 2026 — $0.2475 to $0.125 quarterly (−49.5%) — Dividend Score at the Time of the Cut: 93
IFF — International Flavors & Fragrances — February 2024 — $0.81 to $0.40 quarterly (−50.6%) — Dividend Score at the Time of the Cut: 81
KRO — Kronos Worldwide — February 2025 — $0.19 to $0.05 quarterly (−73.7%) — Dividend Score at the Time of the Cut: 52
LEG — Leggett & Platt — April 2024 — $0.46 to $0.05 quarterly (−89.1%) — Dividend Score at the Time of the Cut: 83
LYB — LyondellBasell Industries — February 2026 — $1.37 to $0.69 quarterly (−49.6%) — Dividend Score at the Time of the Cut: 63
MAN — ManpowerGroup — May 2025 — $1.54 to $0.72 semiannually (−53.2%) — Dividend Score at the Time of the Cut: 48
MDU — MDU Resources Group — November 2023 — $0.2225 to $0.125 quarterly (−43.8%) — Dividend Score at the Time of the Cut: 93
MMM — 3M Company — May 2024 — $1.51 to $0.70 quarterly (−53.6%) — Dividend Score at the Time of the Cut: 81
NUS — Nu Skin Enterprises — February 2024 — $0.39 to $0.06 quarterly (−84.6%) — Dividend Score at the Time of the Cut: 58
SWKS — Skyworks Solutions — July 2026 — $0.71 quarterly to suspended (−100%) — Dividend Score at the Time of the Cut: 83
TDS — Telephone and Data Systems — May 2024 — $0.19 to $0.04 quarterly (−78.9%) — Dividend Score at the Time of the Cut: 70
TSLX — Sixth Street Specialty Lending — May 2026 — $0.46 to $0.42 quarterly (−8.7%) — Dividend Score at the Time of the Cut: 77
BCE — BCE Inc. — May 2025 — C$0.9975 to C$0.4375 quarterly (−56.1%) — Dividend Score at the Time of the Cut: 86
JM — JM AB — April 2026 — SEK 3.25 to SEK 2.00 annually (−38.5%) — Dividend Score at the Time of the Cut: 52
T — TELUS Corporation — July 2026 — C$0.4184 to C$0.1875 quarterly (−55.2%) — Dividend Score at the Time of the Cut: 79
TIETO — Tietoevry Corporation — March 2026 — €1.50 to €0.88 annually (−41.3%) — Dividend Score at the Time of the Cut: 83
Resources Most Frequently Used to Verify the Data
Official company websites and investor relations pages
SEC EDGAR
Reuters
The Wall Street Journal
Nasdaq
GlobeNewswire
PR Newswire
Business Wire
Morningstar
MarketWatch
Barron’s
Investopedia
investing.com
stockanalysis.com
financecharts.com
dividendinvestor.com
maxdividends.app
beatmarket.com