

The MaxDividends Macro Report is your monthly deep dive into global dividend trends — packed with data, insights, and analysis from the most dividend-focused team and community in the world.
💬 Like, share, and repost to spread the dividend mindset!
Hey Dividend Investors!
Our latest MaxDividends Macro Report for October 2025 is here — packed with fresh insights to keep your income stream climbing.
Every week, we track thousands of dividend-paying companies worldwide — analyzing trends, crunching data, and filtering the noise so you don’t have to. Every chart and table you see here reflects hours of careful work by the MaxDividends team.
And the best part? All that research is distilled into one clear mission: helping you build reliable, growing dividend income for years to come.
We’re the most dividend-focused community on Earth — and you’re right in the heart of it.
The MaxDividends Macro Report
Dividend Eagles: 3 Top-Performing Dividend Stocks of the Month
Updated Dividend Eagles Top Stocks List
The Most Notable Dividend Increases
Dividend Macro Highlights:
Global Dividend Trends
US Dividend Trends
⭐ My Personal Stock Watchlist for October 2025
The new MaxDividends PDF Macro Report for October is a must-see for every dividend investor.
🎁 Bonus!
Inside, you’ll find 5 outstanding dividend stock ideas, fresh market trends, macro insights, and real-world plans to grow your income — all crafted by the MaxDividends team.
We’re sharing it today with the entire community so everyone can see just how powerful these reports are — packed with value, guidance, and data worth far more than a couple cups of coffee. Trends, top lists, strategies, support, insights — and of course, the app that ties it all together.
Dividend Eagles Deliver ~$116B YTD
3 Top-Performing Dividend Eagles of October
The "Dividend Eagles List" comprises approximately 100 of the most reliable dividend-paying companies in the U.S. market, each boasting over 15 consecutive years of increasing dividends.
These companies have been meticulously selected based on stringent criteria established by the MaxDividends team.
🥉 +11.94% AVY Avery Dennison Corp
Labeling the World, Rewarding Long-Term Holders
Avery Dennison is the quiet giant behind billions of labels, tags, and materials that keep global commerce organized. From retail tags and logistics barcodes to pressure-sensitive packaging, the company’s products touch nearly every supply chain in the world.
Founded in 1935, Avery built its business on adhesives and evolved into a technology-driven materials leader serving retail, healthcare, logistics, and industrial markets. Its global scale, product diversity, and focus on sustainability give it a durable competitive edge.
Even though it operates in a cyclical materials industry, its pricing power, innovation pipeline, and strong customer relationships keep cash flows resilient — a model of quiet consistency.
🥈 +14.44% WST West Pharmaceutical Services
Delivering Precision, Preserving Health
West Pharmaceutical Services plays a critical yet often invisible role in global healthcare. The company designs and manufactures sophisticated containment and delivery systems for injectable drugs and vaccines — from rubber stoppers to complex auto-injector components used by major pharma and biotech firms.
Founded in 1923 and headquartered in Pennsylvania, West has spent a century perfecting the science of precision manufacturing. Its solutions support vaccine stability, drug purity, and patient safety, making it indispensable to the life sciences supply chain.
🥇 +24.26% JBHT J.B. Hunt Transport Services Inc
Hauling America’s Future, One Dividend at a Time
J.B. Hunt is one of the largest transportation and logistics companies in the U.S., orchestrating the movement of goods across rail, truck, and intermodal systems. Its scale, technology integration, and deep relationships with major retailers make it a bellwether for the U.S. economy.
Founded in 1961 and headquartered in Arkansas, J.B. Hunt pioneered the intermodal model — combining trucking with rail for cost efficiency and lower emissions. Today, it continues to invest in digital platforms and automation to optimize fleet utilization and service reliability.
Dividend One-Pager of the Month
A Proven Dividend Eagle 🦅
50+ consecutive years of dividend increases
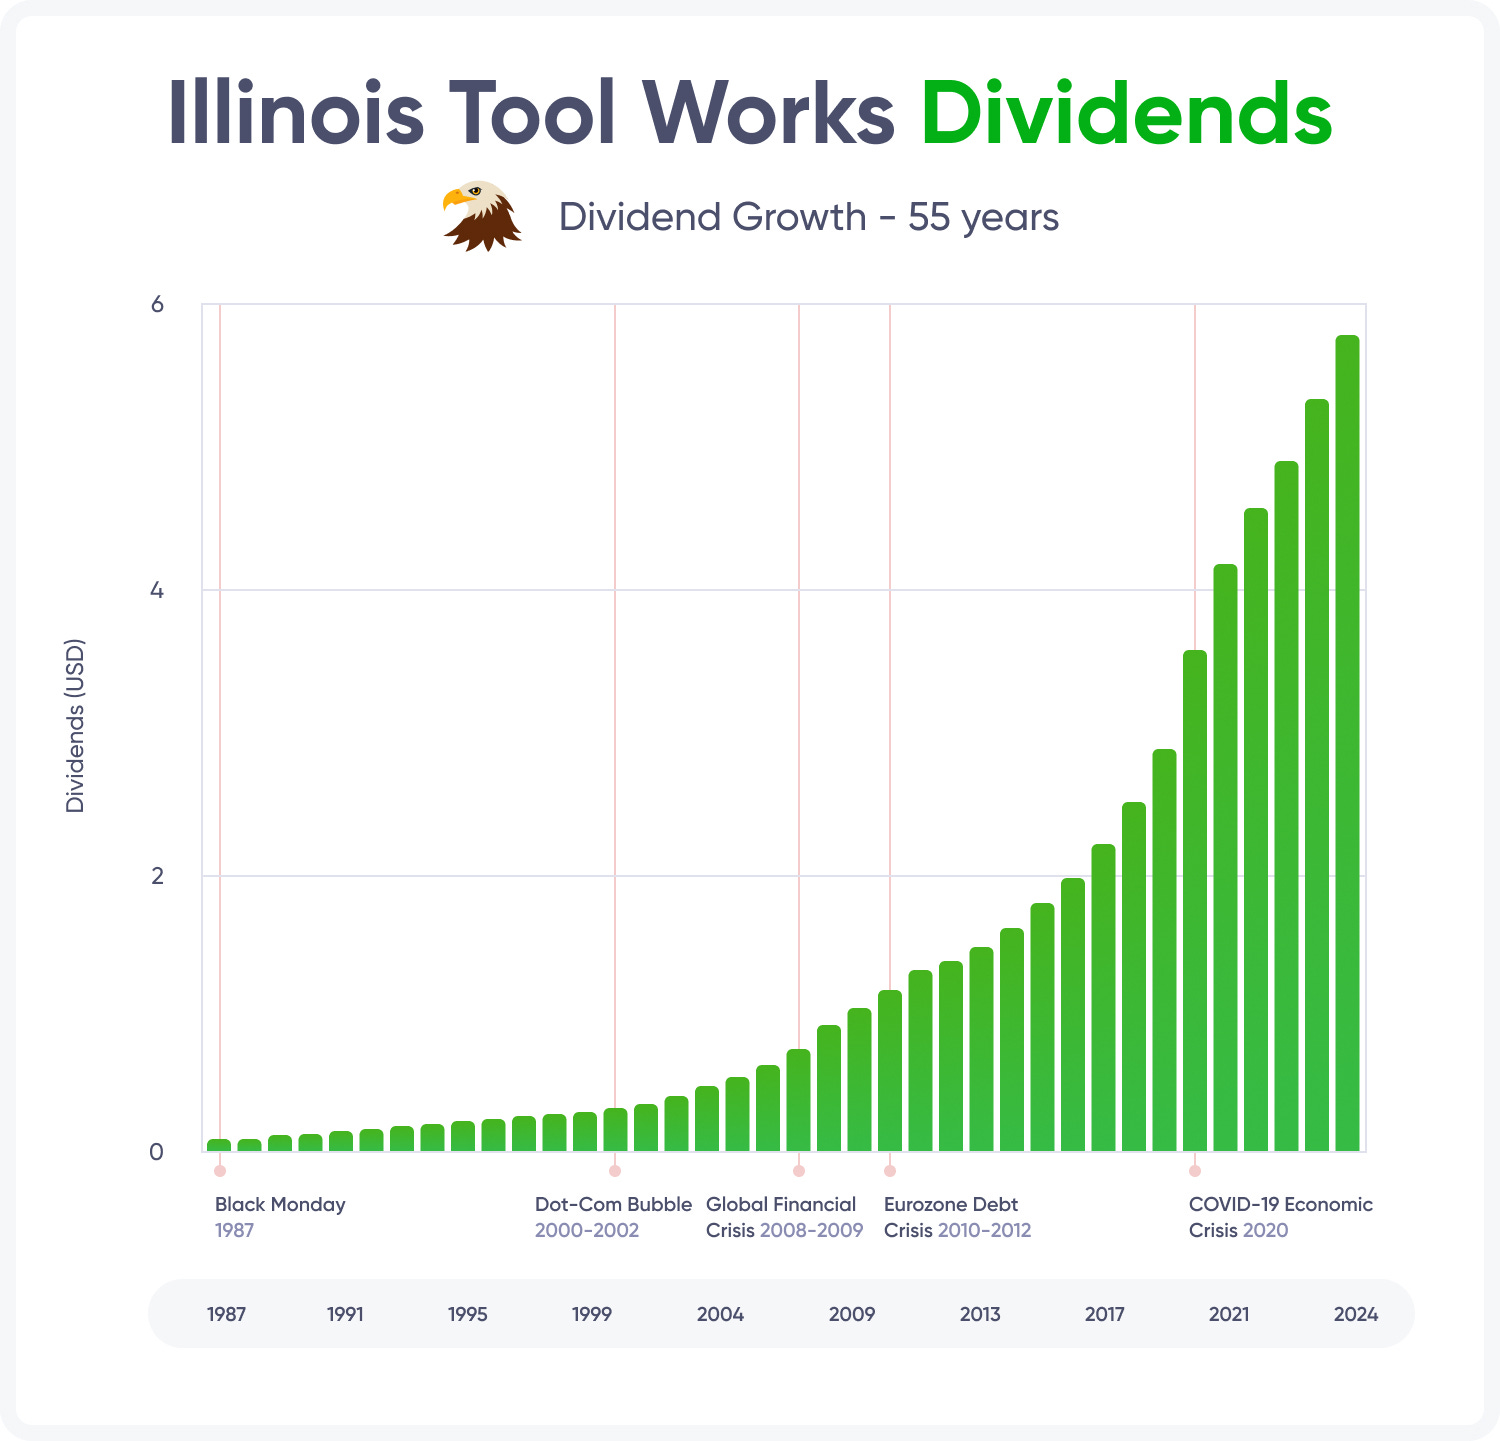
Illinois Tool Works Inc. (NYSE: ITW) demonstrates a consistent and reliable dividend policy, which underscores its financial stability and commitment to returning value to shareholders. Recently, the company’s Board of Directors announced a 7% increase in the quarterly dividend — to $1.61 per share, equivalent to an annual dividend of $6.44 per share. This step continues the company’s long-standing tradition of increasing payouts:
ITW has been raising dividends for 51 consecutive years, and its dividend yield is approximately 2.47%. Dividends are paid quarterly, with the nearest ex-dividend date on September 30, 2025, and the payment date on October 10, 2025. The payout ratio is at a level of about 51.65–53.58%, indicating a balanced approach between distributing profits to shareholders and reinvesting in business growth.
The average annual dividend growth rate in recent years has been about 7%, reflecting the company’s ability to generate stable cash flow and earnings. Such consistent dividend growth makes ITW an attractive asset for income investors focused on long-term and reliable payments.
🦅 Dividend Eagles: October ’25 Edition

An updated compilation of top-performing dividend stocks with 15+ years of consecutive dividend increases, known as Dividend Eagles, selected based on stringent criteria.
The Most Notable Dividend Increases of the Month
OZK Bank (OZK) - Dividend Increase: +2.30%
25+ consistent years of dividends
Bank OZK (NASDAQ: OZK) is a high‑return regional bank with a national footprint in commercial real estate lending through its Real Estate Specialties Group, alongside community banking, business banking, and treasury services across nine states — a not flashy but steady lender with disciplined underwriting and deposit‑gathering that travels well through cycles.
For Q2 2025, total revenue printed at $392.8 million, up 6.8% year over year, while net income available to common stockholders hit a record $178.9 million, up 3.1% YoY; diluted EPS was $1.58 as net interest income set a quarterly record and loan and deposit growth stayed solid — a margin play with credit costs contained and asset quality steady. Management also raised loan growth expectations on the back of healthy production pipelines, reinforcing operating momentum into the second half.
Dividend yield is 3.41% on an annual dividend of $1.76, backed by a 25‑year dividend increase track record — not flashy but steady cash returns. The bank has already raised the dividend twice in 2025, including an October move to $0.45 per share (61st consecutive quarterly increase), reflecting robust earnings power and conservative payout discipline. Five‑year dividend growth is +68.00%, and the dividend payout ratio is 28.57%, leaving ample room for organic growth, credit reserves, and buybacks without stressing capital — a solid setup as the rate and credit cycle evolves.
Lam Research Corp (LRCX) - Dividend Increase: +13.00%
10+ consecutive years of dividends.
Lam Research (NASDAQ: LRCX) builds core semiconductor fabrication tools — particularly etch, deposition, and cleaning equipment — that support advanced logic, memory, and packaging nodes. Its systems are critical in fabs worldwide, especially in Asia, the U.S., and Europe.
In the quarter ended June 29, 2025, the company reported revenue of $5,171 million, with U.S. GAAP net income of $1,720 million (EPS $1.35). Gross margin was 50.1%, and operating income margin reached 33.7%.
The company pays an annual dividend of $1.04, yielding 0.81%. Dividend Increase Track Record is 10 years, 5-Year Dividend Growth is +91.00%, and Dividend Payout Ratio is 25.00%.
RPM International (RPM) - Dividend Increase: +5.90%
50+ consecutive years of dividends.
A true Dividend King. The coatings and sealants leader keeps rewarding shareholders with reliable. growing payouts — half a century and counting.
RPM International (NYSE: RPM) makes specialty coatings, sealants, roofing systems, and building materials sold into industrial, specialty, and consumer end‑markets across North America and globally — a not flashy but steady play on maintenance, repair, and high‑performance building upgrades.
For fiscal Q1 2026 (quarter ended Aug. 31, 2025), sales were $2.11 billion, up 7.4% year over year, with net income of $227.6 million as adjusted EBIT reached $337.8 million — solid operating momentum and a clean margin play on mix and cost actions. Prior quarter results showed net sales of $2.081975 billion and net income of $225.758 million, underscoring steady execution into the fiscal year transition.
The company pays an annual dividend of $2.16, yielding 1.90%. RPM has increased its dividend for 51 years, with 5‑year dividend growth of +34.00% and a dividend payout ratio of 40.37% — balanced returns with room to fund growth and bolt‑on deals.
The Most Solid Recent Dividend Hikes
Cboe Global Markets (CBOE) +14.29%
Chemed (CHE) +20.00%
Dilard’s (DDS) +20.00%
Intuit (INTU) +15.38%
Lam Research (LRCX) +13.04%
ResMed (RMD) +13.21%
Dividend Macro Highlights: Global Dividend Trends
The macro report is updated quarterly
Global: Latest Dividend Data
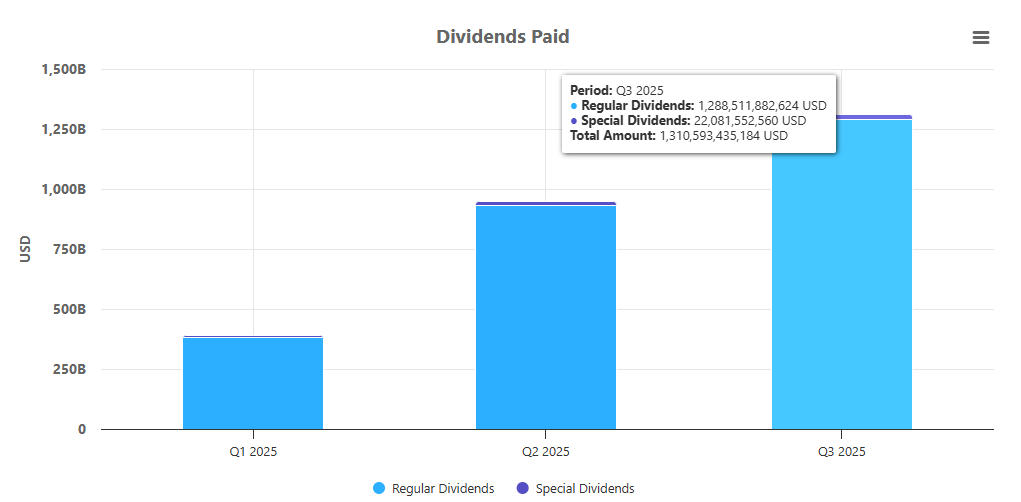
The global cumulative dividend payout for Q3 2025 continued the upward trend seen in Q2 2020.
This indicates that most dividend-paying companies have weathered the impact of the 2020 crisis and successfully adapted their businesses to the new reality.
Global Total Quarterly Dividend Payments (US$ Billions)
Companies paid out $640.5 billion in dividends in the second quarter of 2025. As of now, companies have already paid out $355.1 billion in the third quarter. This figure is expected to increase by the end of the quarter (Figure 1)
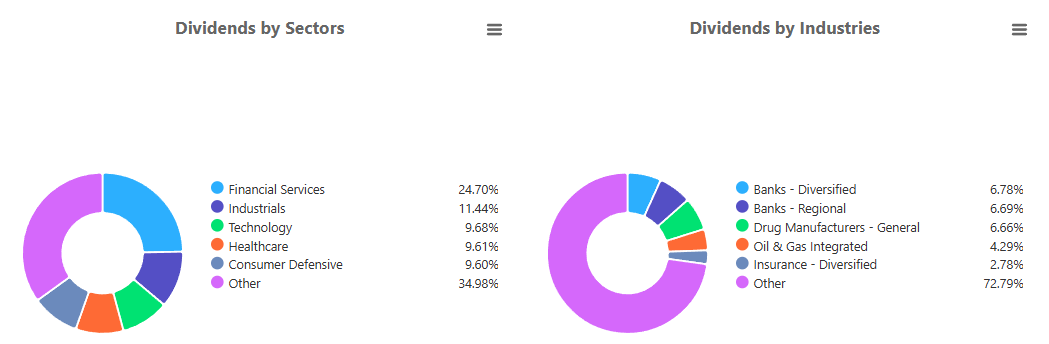
Global Dividend Breakdown — Q3 2025 Year-to-Date
The charts show the distribution of global dividend payments across sectors and industries for the first three quarters of 2025.
Financial Services lead the pack, accounting for nearly 25% of total payouts, followed by Industrials (11%), Technology (9.7%), Healthcare (9.6%), and Consumer Defensive (9.6%) sectors.
At the industry level, banks remain dominant — both diversified and regional lenders together contribute more than 13% of all dividends worldwide. Pharmaceuticals, integrated oil & gas, and insurance also play meaningful roles, while a broad “Other” category reflects the growing diversity of dividend-paying businesses across the global market.
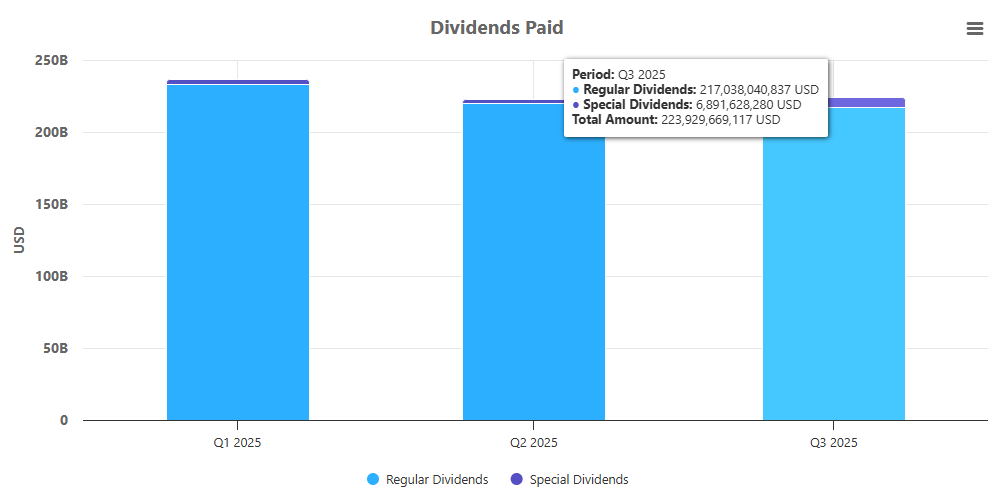
U.S. Dividend Landscape
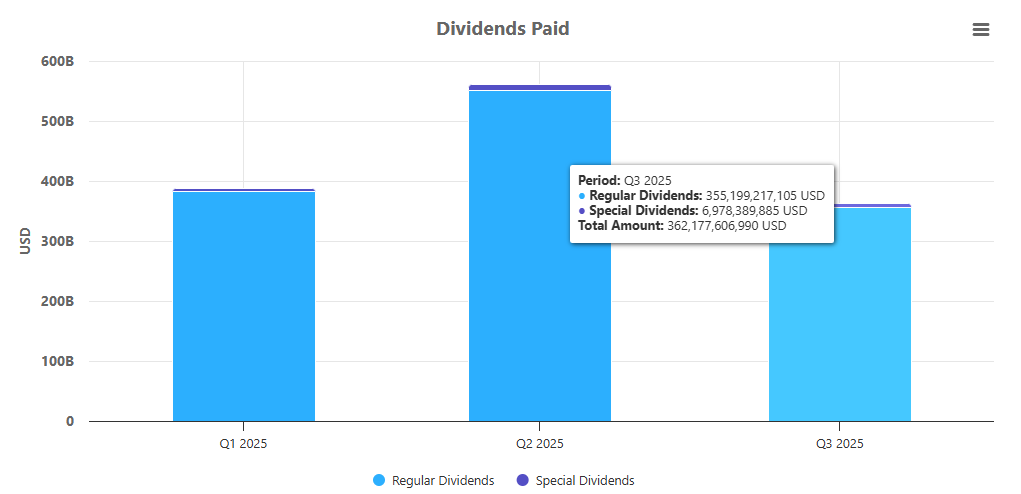
The chart illustrates total dividend payments by U.S. companies in 2025, broken down by quarter.
Q1 and Q2 maintained strong momentum, with payouts in the $230–240 billion range — reflecting healthy profits and continued commitment to shareholder returns.
For Q3 2025, total dividends reached $223.9 billion, including $217.0 billion in regular dividends and $6.9 billion in special dividends.
Regular payouts continue to make up the vast majority of distributions, while special dividends add a modest boost — together confirming that U.S. companies remain financially strong and shareholder-oriented heading into year-end.
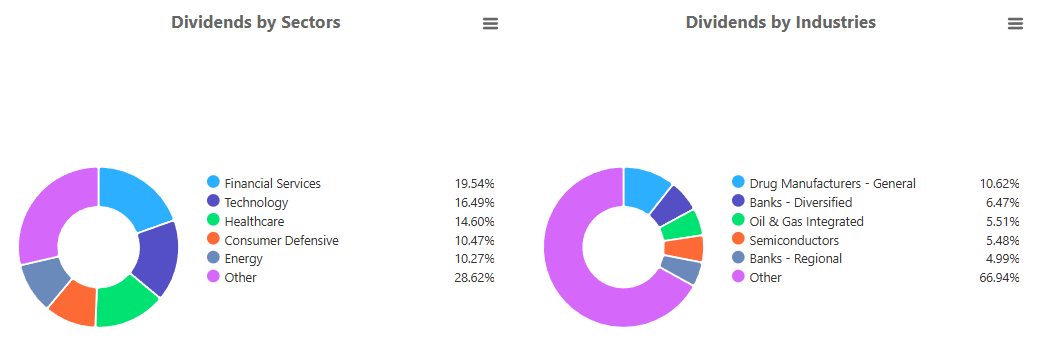
U.S. Dividend Breakdown — Q3 2025 Year-to-Date
The charts highlight how dividend payments in the U.S. market were distributed across sectors and industries during the first three quarters of 2025.
Financial Services remain the top-paying sector, contributing about 19.5% of total dividends, followed by Technology (16.5%), Healthcare (14.6%), Consumer Defensive (10.5%), and Energy (10.3%).
At the industry level, Drug Manufacturers lead with over 10% of total payouts, while banks — both diversified and regional — together add more than 11%. Oil & Gas and Semiconductors also hold strong positions, underscoring the balanced mix of traditional income sectors and modern growth industries driving America’s dividend landscape.
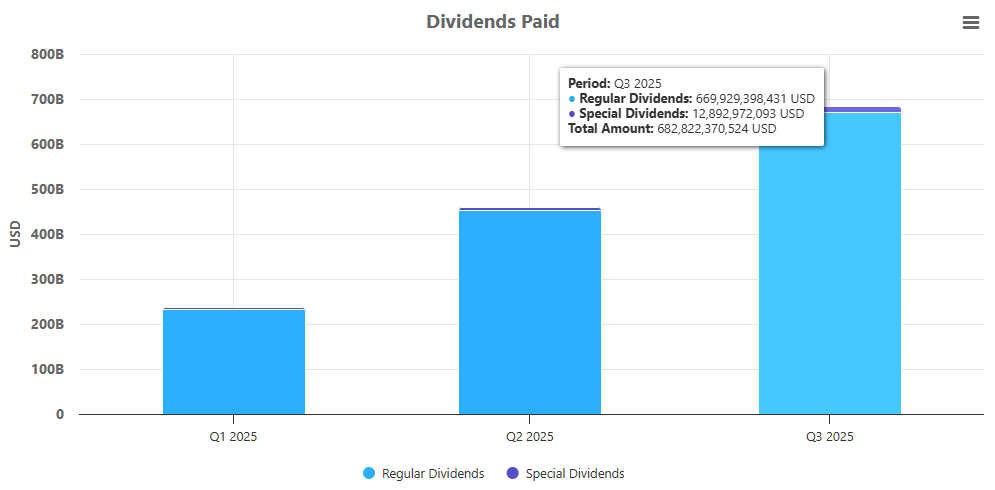
Cumulative dividends paid by US companies in 2025
Dividends paid by U.S. companies in 2025 continue to grow steadily as the year progresses.
Cumulative payouts reached roughly $235B by Q1, $470B by Q2, and have now climbed to more than $680B by Q3. Regular dividends represent the overwhelming majority of these payments, while special dividends contribute only a small share.
Cumulative dividends paid by US Dividend Eagles in 2025
Dividend Eagles — companies with 15+ years of consecutive dividend growth — have now paid out more than $110B in dividends year-to-date 2025.
Payouts continue to rise steadily: about $35B by Q1, nearly $75B by Q2, and just over $110B by Q3. This sustained growth highlights the resilience and reliability of America’s most consistent dividend payers.

Proof That Dividend Eagles Deliver, Year After Year
Over the past decade, US Dividend Eagles — companies with 15+ years of consecutive dividend increases — have nearly doubled their annual payouts, climbing from around $75B in 2016 to more than $139B in 2024. That’s pure cash returned to shareholders, without even counting the effect of reinvestment.
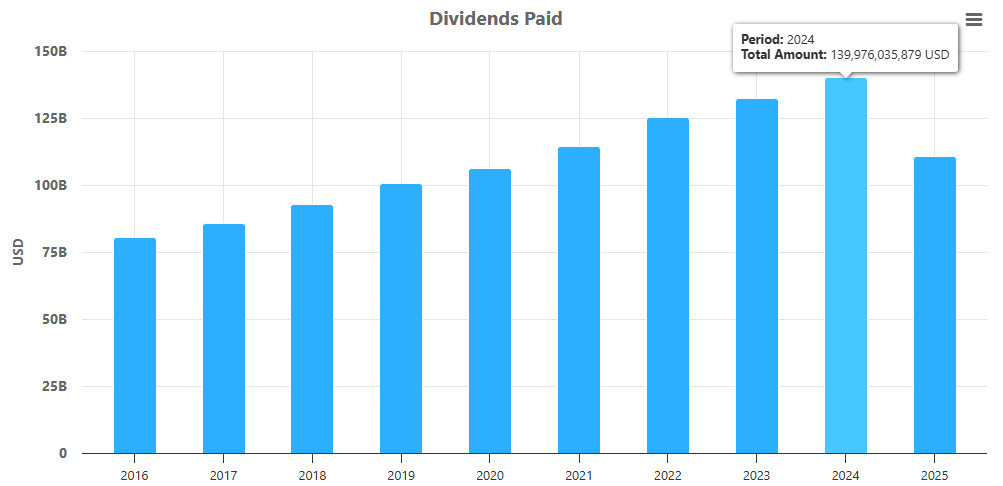
📊 This chart makes the MaxDividends concept crystal clear: when you own businesses that never stop paying and keep raising the bar every single year, your income stream snowballs in front of your eyes. These are not flashy promises — they are the most reliable wealth-building machines in the market.
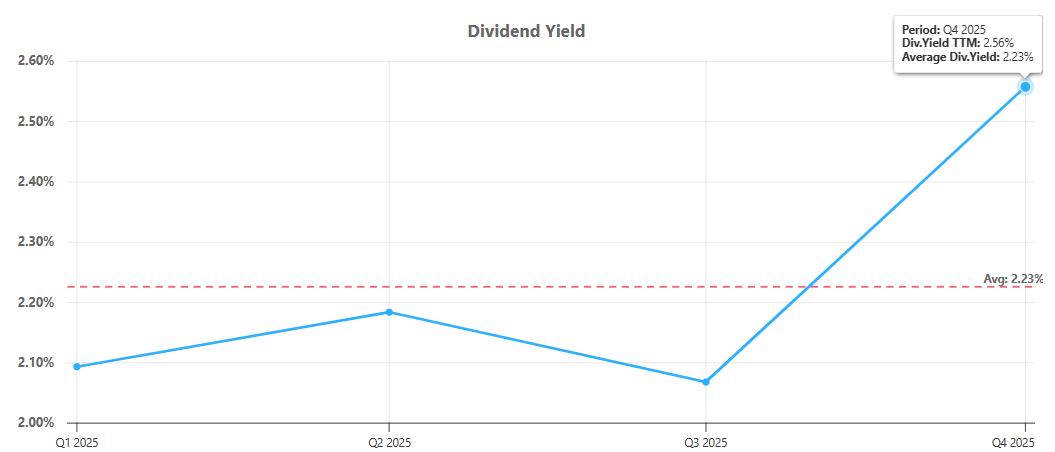
Average Dividend Yield of Dividend Eagles, Q4 2025
In 2025, the average dividend yield of Dividend Eagles has trended upward after a midyear dip. Yields started near 2.1% in Q1, eased slightly in Q3, and then surged to 2.56% in Q4, moving well above the long-term average of 2.23%. This late-year rebound highlights the strength and renewed value appeal of Dividend Eagles as dependable income generators.
🥇 Top 5 Dividend Eagles by Total Payouts (2025 YTD)
These are the heavyweights — the Dividend Eagles returning the most cash to shareholders right now:
Microsoft (MSFT) — 💵 $25.38B in dividends
Johnson & Johnson (JNJ) — 💵 $12.37B
Procter & Gamble (PG) — 💵 $10.25B
Home Depot (HD) — 💵 $9.10B
Coca-Cola (KO) — 💵 $8.81B
📊 Together, just these five companies alone have distributed over $55 billion in dividends so far — a powerful reminder of what it means to own reliable, world-class businesses that never stop paying.
And that’s exactly what the Dividend Eagles List is all about. 🦅 It’s our curated lineup of 100+ U.S. companies that have raised dividends for 15+ consecutive years — the strongest, most consistent payers in the market. These aren’t just stocks; they’re proven wealth-building machines built on financial stability, resilience, and decades of shareholder commitment.
👉 The full, always-updated Dividend Eagles List is available inside the MaxDividends App — exclusive to our community.
Created by the MaxDividends Team. Available only on MaxDividends. Exclusive.
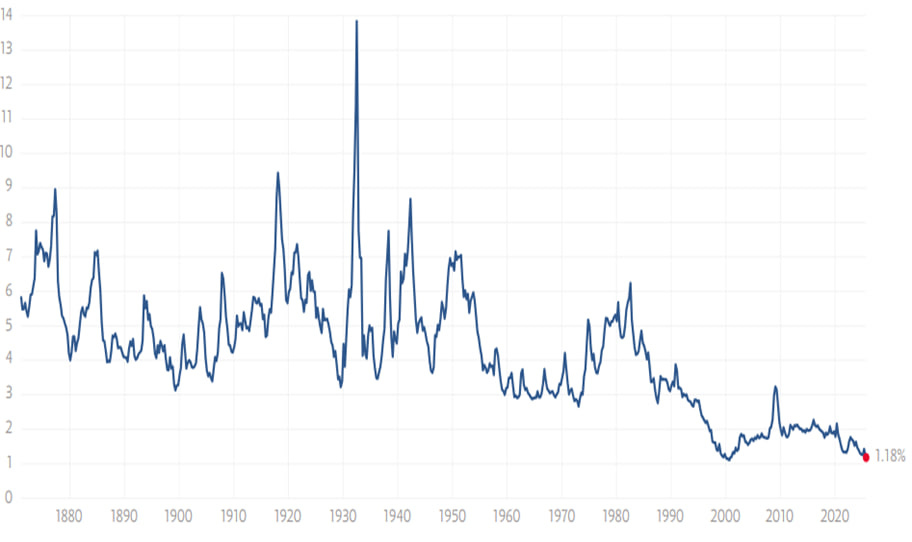
U.S. Dividend Landscape - (S&P 500)
The S&P 500 dividend yield has been cut in half over the past decade. It now stands at 1.18%, which means stock prices relative to dividends are higher than usual. As a result, the dividend yield is at record lows.
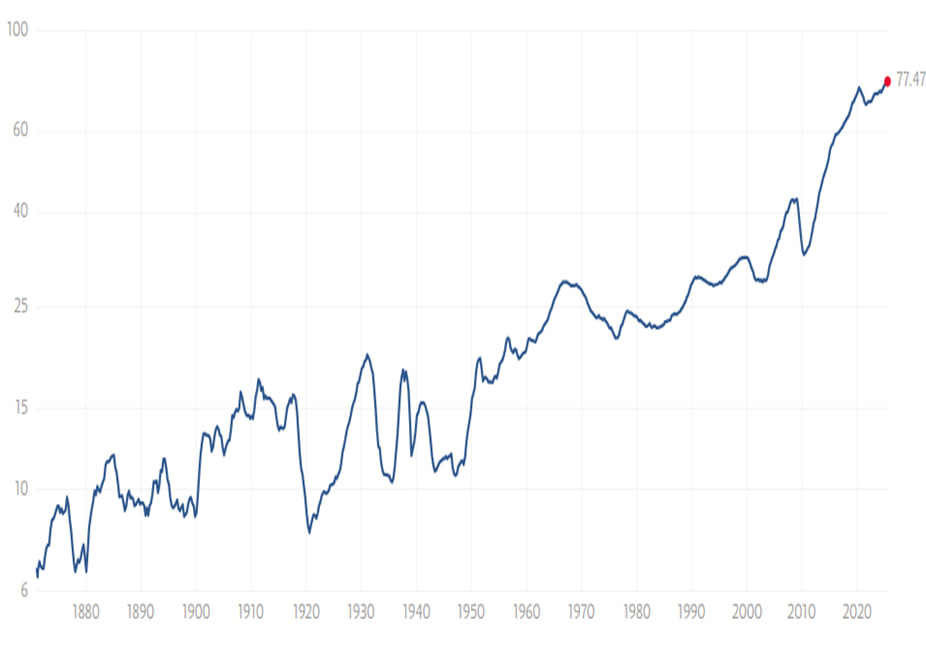
S&P 500 Historical Dividend Trends
Historical dividends from stocks that are part of the S&P 500 Index are shown in Figure 5. The data is adjusted for inflation. With the current inflation rate (Figure 4), there is a gradual acceleration in the growth of dividends on the S&P 500 Index.
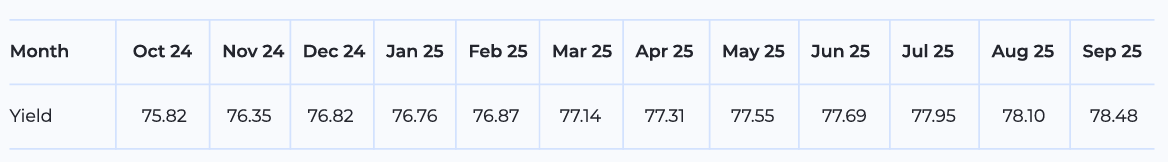
The previous peak was in May 2020, when the dividend was 73.09. Currently, this figure stands at 78.48.
S&P 500 Dividend Growth
The S&P 500 dividend growth is shown in Figure 6. Over the past 32 years, the chart has been negative only three times, and all of those periods were linked to crises.
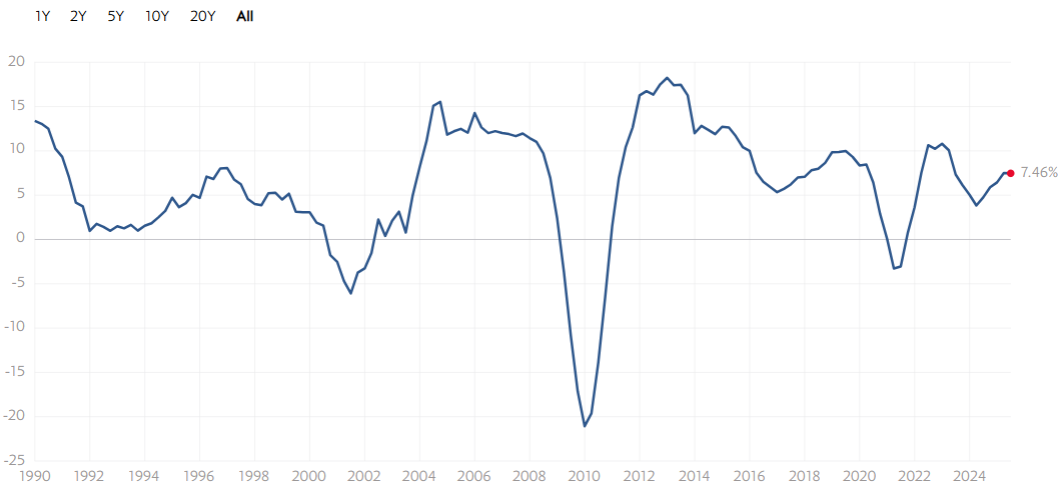
Over the past month, dividend growth has outpaced inflation, reaching 7.46%. The upward trend has continued over the past 12 months.
Inflation’s Impact on Dividends
Inflation has been rising faster than dividends have been increasing, leading to a correction in the S&P 500 dividend chart. Since mid-2022, inflation has been gradually declining, allowing the S&P 500 dividend chart to reflect growth. Since mid-2023, the pace of inflation’s decline has slowed significantly.
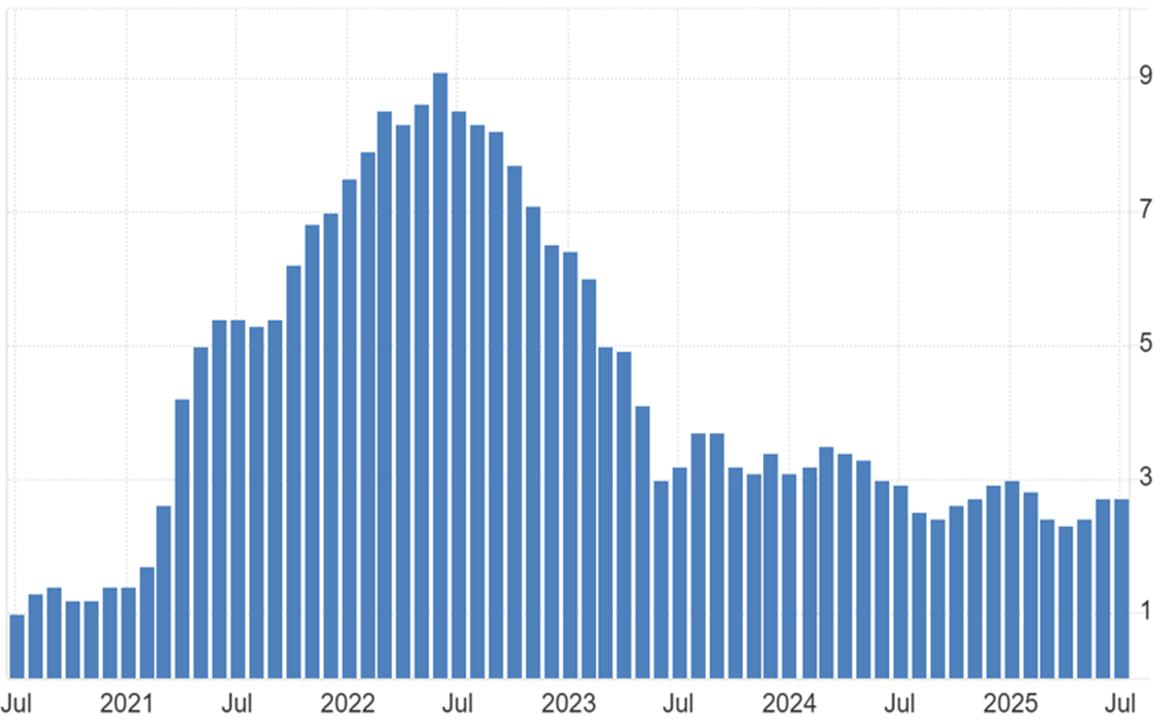
However, the ongoing downward trend in inflation continues to positively impact the growth of the S&P 500 dividend chart.
For your convenience, we have prepared a PDF version of the Dividend Macro Overview. You can download and review it at any time.
🎁 One More Bonus!
My Personal Stock Watchlist — October 2025
A hand-picked list of the dividend stocks I’m actively tracking this month.
Each month I hand-pick a focused shortlist of dividend stocks worth watching. No guesswork, no hype — I screen thousands of companies and keep only the ones with strong balance sheets, reliable dividend growth, and long-term wealth-building potential.
This watchlist is where I’m putting my energy — a mix of high-yield opportunities and growth names with the power to multiply income streams over time. If you’re serious about building a future where dividends cover your lifestyle, this is where to start.
🎯 My 6 Standout Candidates for October
Novo Nordisk (NVO)
Dividend Yield 3.08% | MaxRatio 17.36 | Financial Score 97
Novo Nordisk is a global healthcare leader best known for its diabetes and obesity treatments. Founded in 1923 and headquartered in Denmark, the company operates in more than 170 countries, with products serving millions of patients worldwide.
Key Business Segments
Diabetes & Obesity Care – Insulin, GLP-1 therapies, and innovative treatments for diabetes and weight management.
Rare Disease Treatments – Specialty medicines targeting hemophilia, growth disorders, and other rare conditions.
Biopharma & R&D – Heavy investment in next-generation biologics and clinical trials for chronic diseases.
Takeaway: With 29 straight years of dividend increases and 173% dividend growth in the last five years, Novo Nordisk is one of the most reliable healthcare dividend growth engines in the world.
Shoe Carnival (SCVL)
Dividend Yield 2.70% | MaxRatio 16.66 | Financial Score 98
Shoe Carnival Inc. is a U.S. footwear retailer offering affordable brand-name shoes for the entire family. Founded in 1978 and headquartered in Evansville, Indiana, it runs 400+ stores across the U.S. and Puerto Rico, blending value pricing with an upbeat in-store experience.
Key Business Segments
Retail Stores – Wide selection of athletic, casual, and dress footwear for men, women, and children.
E-Commerce – Online sales with buy-online, pick-up in-store convenience.
Private Label Brands – Exclusive offerings that boost margins and differentiate the product mix.
Loyalty Program (Shoe Perks) – Personalized promotions and repeat-customer rewards.
Takeaway: With 218% dividend growth in just five years and a conservative payout ratio under 20%, Shoe Carnival has emerged as a true dividend growth underdog.
Bank OZK (OZK)
Dividend Yield 3.44% | MaxRatio 9.39 | Financial Score 92
Bank OZK is a regional bank headquartered in Little Rock, Arkansas. Founded in 1903, it operates across the Southern U.S., offering retail and commercial banking services with a focus on conservative lending.
Key Business Segments
Community Banking – Personal checking, savings, and lending services across multiple states.
Commercial Real Estate Lending – Nationally recognized lender in real estate development finance.
Treasury & Wealth Management – Services tailored to both individuals and businesses.
Takeaway: With 25 consecutive years of dividend increases and a payout ratio under 30%, Bank OZK is a steady regional bank with dependable dividend growth.
goeasy Ltd (GSY) | Canada
Dividend Yield 3.54% | MaxRatio 40.68 | Financial Score 98
goeasy Ltd. is a Canadian financial services company providing non-prime lending and lease-to-own products. Founded in 1990 and headquartered in Mississauga, Ontario, it serves customers often overlooked by traditional banks.
Key Business Segments
easyfinancial – Non-prime consumer lending and installment loans across Canada.
easyhome – Lease-to-own business for household goods and furniture.
Credit & Insurance Services – Expanding portfolio of credit protection and related products.
Takeaway: With 277% dividend growth in the last five years and 21 straight years of raises, goeasy is one of the most aggressive dividend growth stories in North America.
FedEx (FDX)
Dividend Yield 2.37% | MaxRatio 12.05 | Financial Score 97
FedEx Corporation is a global leader in logistics, e-commerce, and business services. Founded in 1971 and headquartered in Memphis, Tennessee, it operates in over 220 countries and territories with one of the world’s largest express delivery networks.
Key Business Segments
FedEx Express – Time-definite international and domestic shipping.
FedEx Ground – Cost-effective package delivery across the U.S. and Canada.
FedEx Freight – Less-than-truckload freight services nationwide.
FedEx Logistics – Supply chain solutions including brokerage and warehousing.
Takeaway: With over 100% dividend growth in the last five years and a growing role in global trade, FedEx is turning into a surprisingly strong dividend growth stock.
Enghouse Systems (ENGH) | Canada
Dividend Yield 5.68% | MaxRatio 29.71 | Financial Score 99
Enghouse Systems Ltd. is a Canadian software and IT services company. Founded in 1984 and headquartered in Markham, Ontario, it develops enterprise software solutions for telecom, customer experience, and IT infrastructure worldwide.
Key Business Segments
Interactive Management Group – Contact center software, video collaboration, and customer engagement solutions.
Asset Management Group – Network software, operations support, and IT infrastructure tools.
Acquisitions – Growth strategy built around acquiring and integrating complementary software firms.
Takeaway: With a 5.7% yield, 138% dividend growth over five years, and 15 straight years of raises, Enghouse combines growth, scale, and income in one of the strongest packages among Canadian dividend stocks.
✨ These six are my “front runners” for October. They’ve cleared every screen, proven themselves over time, and sit at the top of my focus list this month.
A complete list of my favorite stocks I’m currently tracking—only the best make it in.
💬 Like, share, and repost to spread the dividend mindset! Happy dividends for all the holders!
- Max & MaxDividends Team
MaxDividends Mission
Helping people build growing passive income, retire early, and live off dividends.
Someone’s sitting in the shade today because someone planted a tree a long time ago. ― Warren Buffett.