


The MaxDividends Macro Report is your monthly deep dive into global dividend trends — packed with data, insights, and analysis from the most dividend-focused team and community in the world.
💬 Like, share, and repost to spread the dividend mindset!
Hey Dividend Investors!
Our latest MaxDividends Macro Report — February 2026 is here, and it’s loaded with sharp, data-driven insights to keep your income strategy moving upward.
Each week, we track thousands of dividend-paying companies across global markets — studying trends, running the numbers, and cutting through the noise so you don’t have to. Every chart, metric, and signal you see here comes from hours of careful analysis by the MaxDividends team.
And the mission behind all that work stays the same: helping you build a dividend income stream that’s reliable today and growing for years ahead.
We’re the most dividend-focused community on Earth — and you’re right in the heart of it.
The MaxDividends Macro Report
Dividend Eagles: 3 Top-Performing Dividend Stocks of the Month
Updated Dividend Eagles Top Stocks List
The Most Notable Dividend Increases
Dividend Macro Highlights:
Global Dividend Trends
US Dividend Trends
⭐ My Personal Stock Watchlist for February-March 2026
The new MaxDividends PDF Macro Report for February is a must-see for every dividend investor.
🎁 Bonus!
Inside, you’ll find 5 outstanding dividend stock ideas, fresh market trends, macro insights, and real-world plans to grow your income — all crafted by the MaxDividends team.
We’re sharing it today with the entire community so everyone can see just how powerful these reports are — packed with value, guidance, and data worth far more than a couple cups of coffee. Trends, top lists, strategies, support, insights — and of course, the app that ties it all together.
Dividend Eagles Deliver ~$9.5B in Dividends YTD
3 Top-Performing Dividend Eagles of February
The "Dividend Eagles List" comprises approximately 100 of the most reliable dividend-paying companies in the U.S. market, each boasting over 15 consecutive years of increasing dividends.
These companies have been meticulously selected based on stringent criteria established by the MaxDividends team.
🥉 +15.75% PPG — PPG Industries
Coloring the World’s Infrastructure
PPG is one of the largest global coatings companies, supplying paints, specialty coatings, and protective finishes used in aerospace, automotive, industrial equipment, marine applications, and residential housing. When buildings are constructed, aircraft are assembled, or factories expand — PPG products are often part of the process.
Founded in 1883 and headquartered in Pennsylvania, PPG operates across dozens of countries with a diversified industrial customer base. Its products aren’t optional add-ons — they protect surfaces, extend asset life, and improve performance. That creates repeat demand and pricing power over time.
This steady industrial footprint supports durable cash flow generation. Through cycles, PPG has maintained disciplined capital allocation and a consistent dividend growth policy — quietly compounding shareholder income for decades.
🥈 +17.27% WDFC — WD-40 Company
A Small Can with Global Reach
WD-40 is one of the most recognizable maintenance brands in the world. Its products solve everyday mechanical problems — lubrication, corrosion prevention, cleaning — across households, workshops, and industrial environments worldwide.
Founded in 1953 and based in California, the company operates a focused portfolio built around a handful of high-margin, globally distributed brands. The beauty of the model is simplicity: strong brand equity, global distribution, limited SKU complexity, and repeat purchase behavior.
That brand-driven moat translates into impressive operating margins and consistent free cash flow. WD-40 doesn’t need massive capital expenditures to grow — which leaves more room to steadily raise dividends year after year.
🥇 +23.50% GRC — The Gorman-Rupp Company
Pumps That Keep the Real World Moving
Gorman-Rupp manufactures pumps and pumping systems used in water, wastewater, industrial processing, construction, and municipal infrastructure. When water needs to move — in cities, plants, or industrial sites — reliability is everything.
Founded in 1933 and headquartered in Ohio, the company focuses on engineered products built for durability and mission-critical environments. Municipal and industrial clients value long service life and proven performance — which supports recurring demand and long customer relationships.
That practical, infrastructure-anchored business model produces steady operating cash flow and supports a long track record of dividend increases. It’s not flashy — but it’s exactly the kind of essential industrial backbone that keeps income compounding quietly in the background.
Dividend One-Pager of the Month
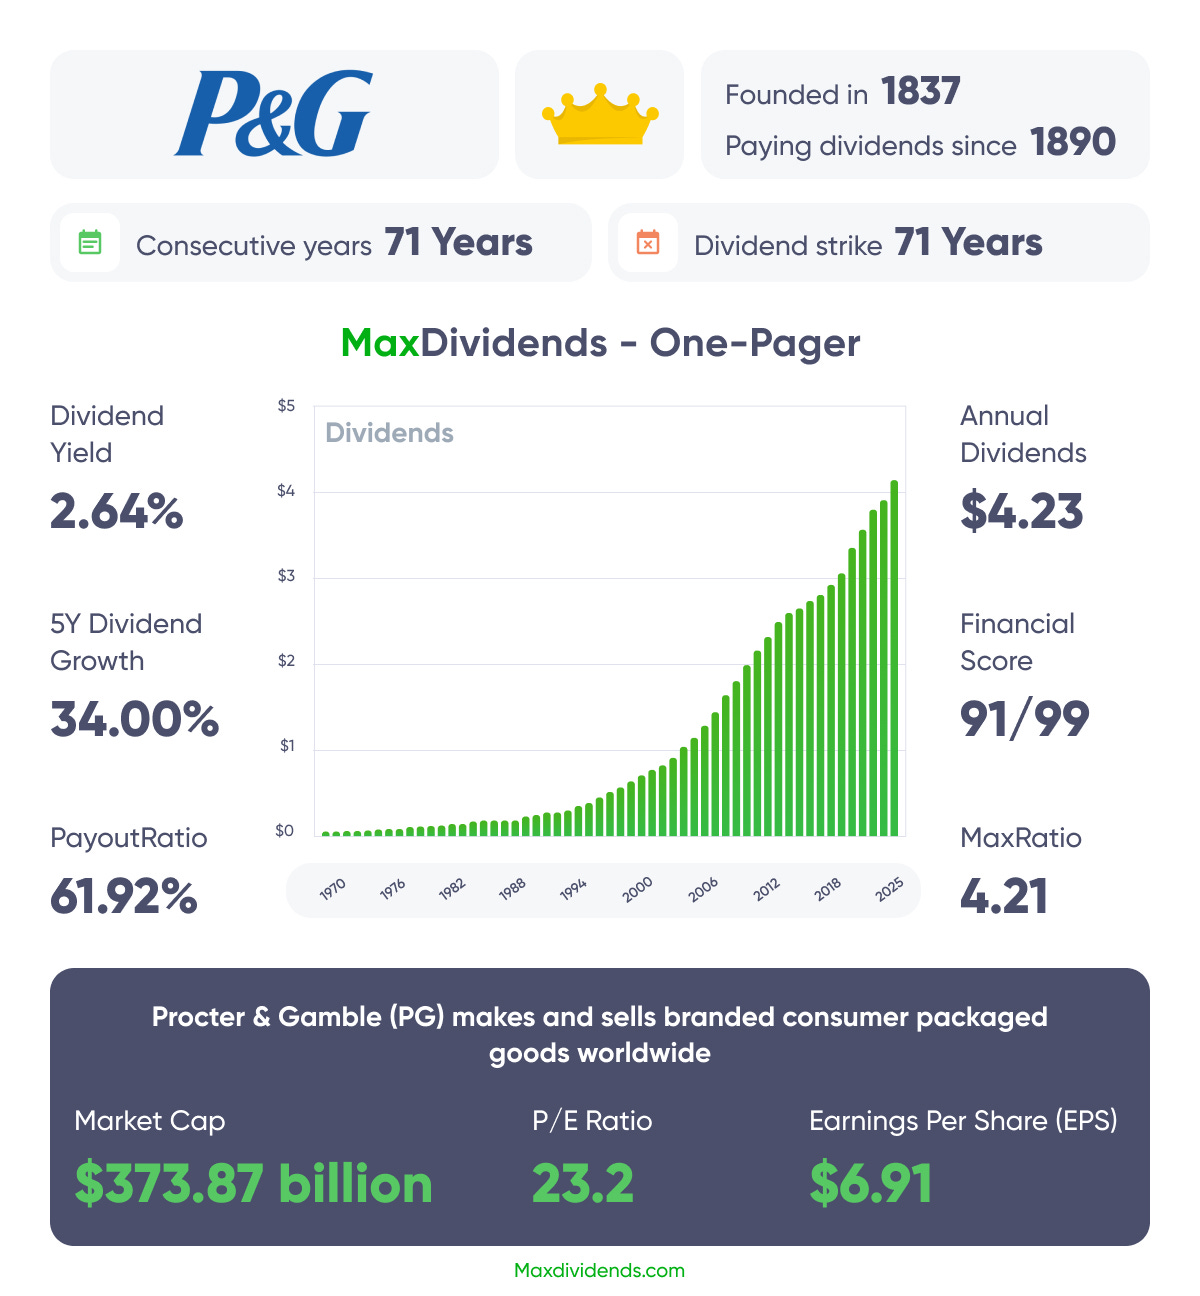
A Proven Dividend Eagle 🦅
15+ consecutive years of dividend increases
One of the defining features of Procter & Gamble’s shareholder proposition is its unusually long and uninterrupted dividend record. Since its incorporation in 1890, P&G has paid a cash dividend every single year for 135 consecutive years, making it one of the longest streaks in corporate history.
Moreover, the company has increased its dividend annually for 69 straight years, including a 5 % raise announced in 2025 that lifted the quarterly payout to $1.0568 per share.
This extended stretch of dividend growth underscores P&G’s commitment to returning cash to investors and reflects its ability to generate stable cash flow across economic cycles.
If you want to dive deeper, the full list of all Dividend Eagles — with up-to-date analytics, financial scores, valuations, streaks, payout metrics, and every data point you need — is available inside the MaxDividends App for all partners right here:
👉 the full list of all Dividend Eagles
This is where you can explore every Eagle in detail, compare quality, screen for opportunities, and build a portfolio with true long-term horsepower.
And now, let’s get into the good part — a hand-picked set of dividend ideas worth your attention this month, selected for reliability, growth, and real income-producing strength. Let’s dive in.
List of Undervalued Dividend Stocks (February) 🔥

The Most Notable Dividend Increases of the Month
Alamo Group (ALG) — Dividend Increase: +13.3%
30+ consecutive years of rising dividends
Alamo manufactures industrial equipment used in vegetation management, infrastructure maintenance, and agricultural applications. Its products are deployed by municipalities, contractors, and government agencies to maintain roadsides, public lands, and essential infrastructure. This is not cyclical consumer spending — it’s ongoing maintenance of the physical world.
Because its equipment supports essential services, demand tends to remain steady even when economic conditions fluctuate. The company operates with a focused product portfolio, disciplined capital allocation, and a long-term operating mindset.
Alamo raised its dividend by 13.3%, extending a three-decade streak of dividend growth. That kind of consistency reflects durable free cash flow generation and a management team that prioritizes shareholder returns alongside operational expansion.
Fastenal (FAST) — Dividend Increase: +9.1%
25+ consecutive years of rising dividends
Fastenal distributes industrial and construction supplies — fasteners, safety equipment, tools, and maintenance products — through a vast branch and on-site network across North America and beyond. Its model is built on proximity to customers and deep integration into their daily operations.
With thousands of locations and vending solutions embedded directly into client facilities, Fastenal benefits from repeat demand and high switching costs. Industrial customers rely on uptime and inventory availability, not price shopping every quarter.
The 9.1% dividend increase extends Fastenal’s multi-decade growth streak and signals continued confidence in its cash-generating ability. As long as factories operate and projects move forward, Fastenal remains positioned to quietly compound income.
Goldman Sachs (GS) — Dividend Increase: +12.5%
10+ consecutive years of rising dividends
Goldman Sachs is one of the world’s leading investment banks and asset managers, serving corporations, institutions, and governments globally. Its revenue streams span advisory, trading, asset management, and wealth management.
While capital markets businesses can be cyclical, Goldman’s scale, brand, and diversified operations provide resilience across market environments. Strong capital ratios and disciplined risk management allow the firm to navigate volatility while maintaining shareholder returns.
The 12.5% dividend increase reflects solid capital strength and management’s confidence in earnings power.
BlackRock (BLK) — Dividend Increase: +10%
15+ consecutive years of rising dividends
BlackRock is the world’s largest asset manager, overseeing trillions in client assets across ETFs, mutual funds, and institutional mandates. Its iShares platform alone has become foundational to modern portfolio construction.
Asset management is a scale-driven business. As assets grow, operating leverage improves, generating strong margins and substantial free cash flow. BlackRock benefits from global diversification, recurring fee revenue, and deep integration into institutional investment frameworks.
With a 10% dividend increase, BlackRock extends its streak of steady dividend growth. The raise underscores the structural strength of its fee-based model and its ability to convert market growth into rising shareholder income.
The Most Solid Recent Dividend Hikes
Balchem (BCPC) +10.34%
Canadian Imperial Bank (CM) +16.27%
Ecolab (ECL) +12.31%
Eli Lilly (LLY) +15.33%
Mastercard (MA) +14.47%
Owens Corning (OC) +14.49%
Oil-Dri Corp (ODC) +13.89%
WD-40 (WDFC) +8.51%
Dividend Macro Highlights: Global Dividend Trends
The macro report is updated quarterly
Global: Latest Dividend Data
The global cumulative dividend payout for Q4 2025 continued the upward trajectory observed since the post-pandemic recovery. Total dividends reached approximately $1.67 trillion, with the vast majority coming from regular dividend payments rather than special distributions.
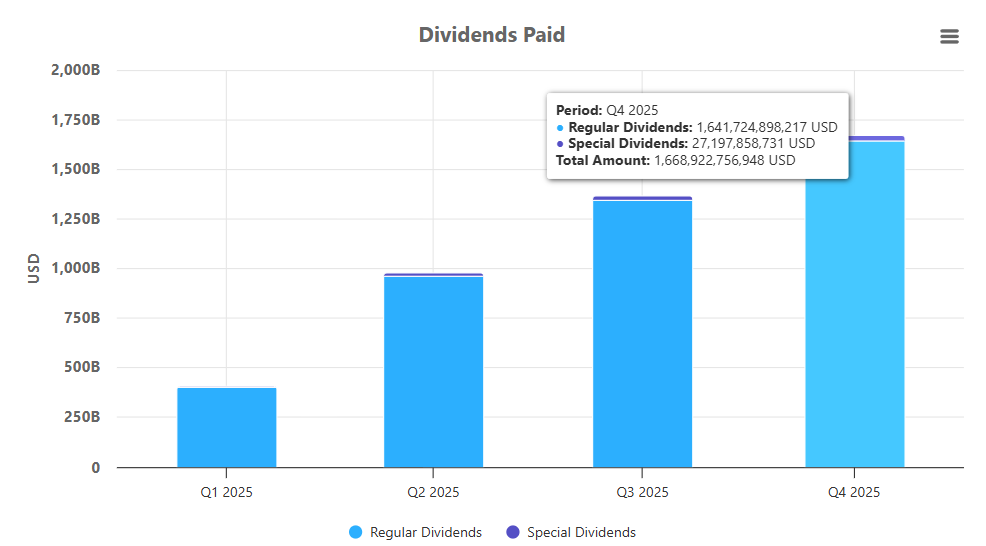
This composition indicates that dividend growth is being driven primarily by recurring operating cash flows, rather than one-time balance-sheet actions. The stability of regular payouts suggests that corporate earnings and cash-flow generation remain sufficiently strong to support ongoing shareholder distributions.
Global Total Quarterly Dividend Payments (US$ Billions)
Global dividend payments remained elevated throughout 2025, reflecting stable corporate earnings and sustained shareholder return policies across major markets. Companies distributed approximately $400 billion in dividends during the first quarter, followed by a peak of nearly $570 billion in the second quarter, driven in part by elevated special dividends.
In Q3 2025, total payouts moderated to roughly $380 billion as special distributions declined, while regular dividends remained stable.
With Q4 2025 now fully reported, global dividends totaled approximately $302 billion, including $297.5 billion in regular dividends and $4.3 billion in special dividends. The sharp reduction in special payouts compared to Q2 and Q3 indicates that dividend flows in late 2025 were almost entirely supported by recurring operating cash flows rather than one-time balance-sheet actions.
Overall, the quarterly pattern shows that while special dividends created temporary volatility earlier in the year, the underlying level of regular dividend payments remained consistently strong, confirming the durability of global corporate income generation into year-end (Figure 1).
Global Dividend Breakdown — Q1 2026 Year-to-Date
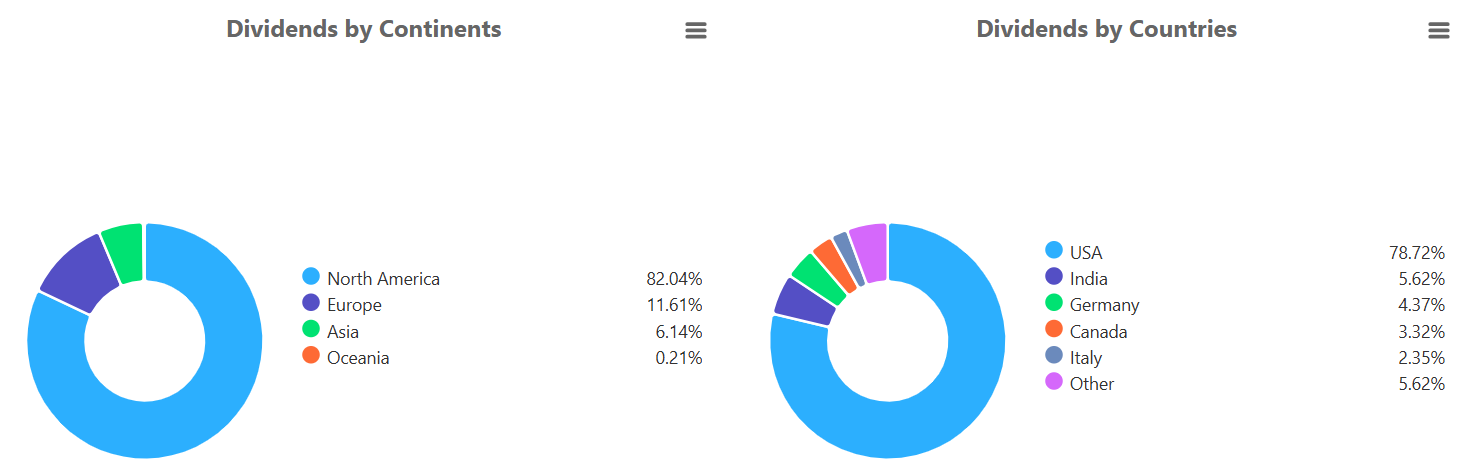
These charts show how global dividend payments have been distributed across sectors, industries, continents, and countries based on year-to-date data for the first quarter of 2026.
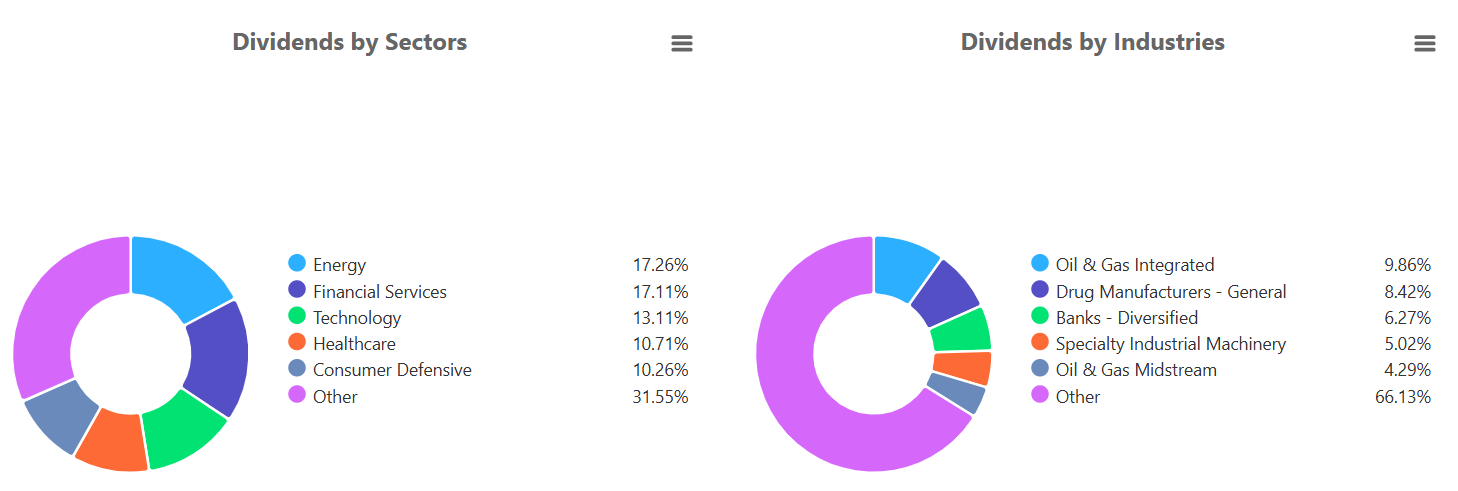
Energy currently leads all sectors, accounting for 17.26% of total global dividend payouts. Financial Services follow closely at 17.11%, while Technology (13.11%) has become an increasingly meaningful contributor to global income generation. Healthcare (10.71%) and Consumer Defensive (10.26%) continue to provide structural stability. The 31.55% “Other” category highlights the broad diversification of dividend-paying businesses across the global economy.
At the industry level, Oil & Gas Integrated companies represent the largest identifiable group at 9.86%. Drug Manufacturers contribute 8.42%, while Diversified Banks account for 6.27%. Specialty Industrial Machinery (5.02%) and Oil & Gas Midstream (4.29%) remain notable contributors. The sizable 66.13% “Other” segment underscores the wide spectrum of industries participating in global dividend generation.
Geographically, North America dominates year-to-date payouts at 82.04%, with Europe contributing 11.61% and Asia 6.14%. Oceania remains marginal at 0.21%.
By country, the United States represents 78.72% of total dividend payments so far in Q1 2026. India (5.62%) and Germany (4.37%) follow, while Canada (3.32%) and Italy (2.35%) contribute smaller but still meaningful shares. The remaining 5.62% is distributed across other countries.
Overall, the first-quarter data for 2026 shows a dividend landscape strongly concentrated in North America and energy-related sectors, while still supported by a diversified base of global industries.
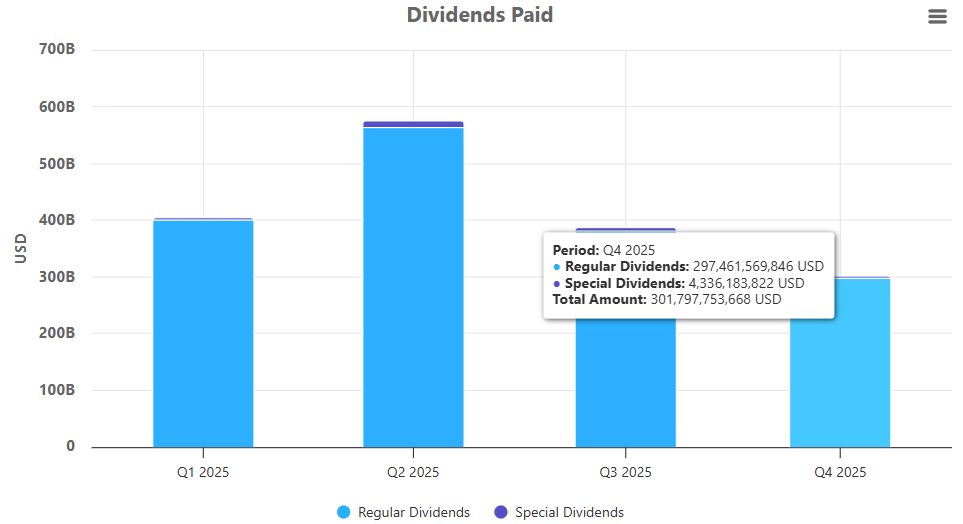
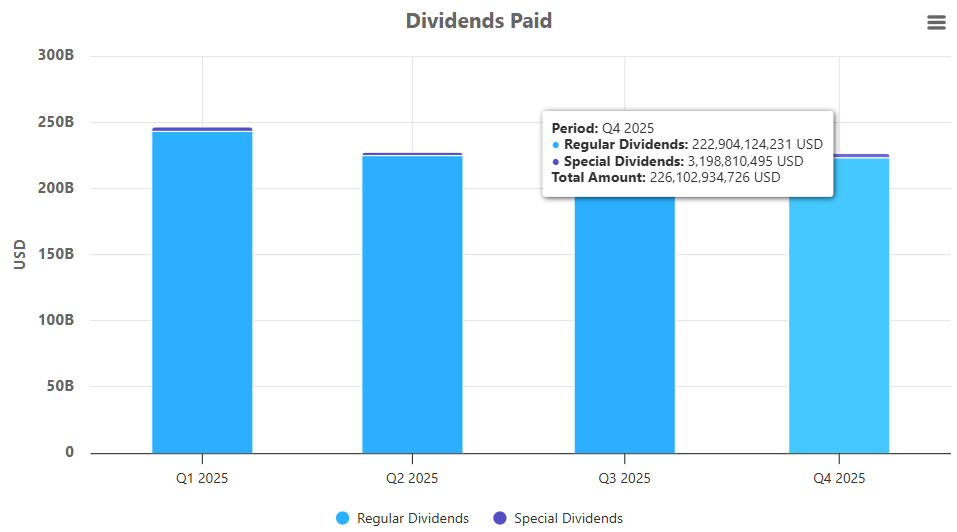
U.S. Dividend Landscape
The chart shows total dividend payments by U.S. companies in 2025, broken down by quarter.
Dividend distributions remained relatively stable throughout the year. Q1 2025 delivered approximately $245 billion, followed by $225 billion in Q2 and $230 billion in Q3, reflecting consistent earnings and ongoing shareholder return policies across corporate America.
With Q4 2025 now reported, total U.S. dividends reached $226.1 billion, consisting of $222.9 billion in regular dividends and $3.2 billion in special dividends. The further decline in special payouts confirms that dividend income in late 2025 was driven almost entirely by recurring, operating cash flows rather than one-time distributions.
Overall, the quarterly pattern for 2025 indicates a stable and sustainable level of dividend payments, with regular dividends forming the core of shareholder returns as U.S. companies entered 2026.
U.S. Dividend Breakdown — Q1 2026 Year-to-Date
These charts show how dividend payments in the U.S. market are distributed across sectors and industries based on the latest year-to-date data for the first quarter of 2026.
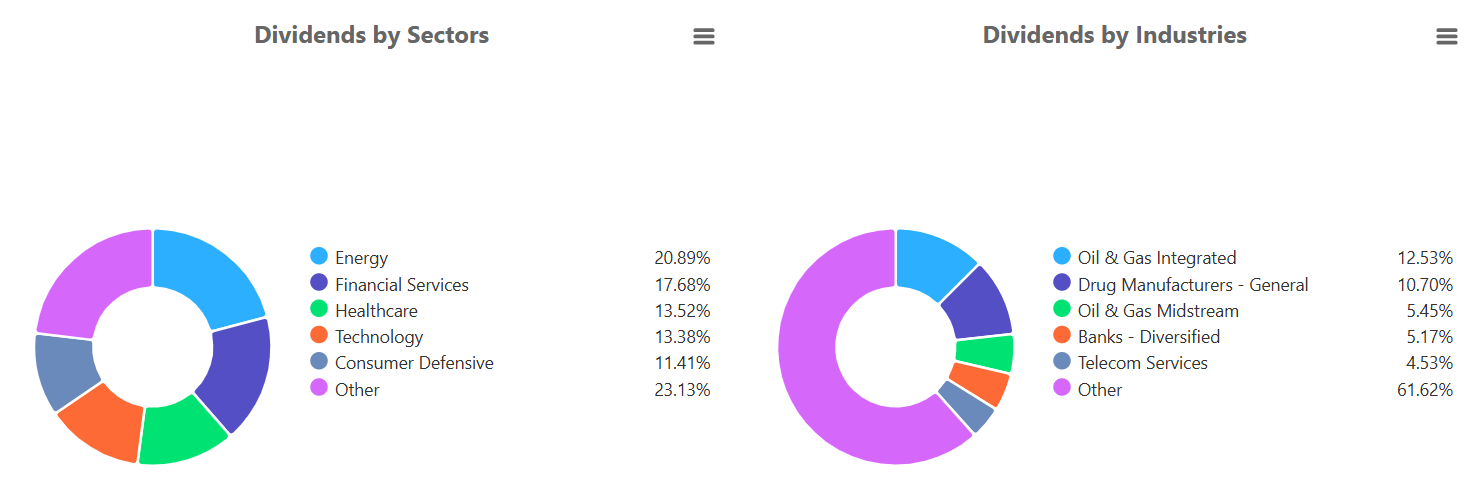
Energy has moved into the leading position, accounting for 20.89% of total U.S. dividend payouts. Financial Services follow at 17.68%, while Healthcare (13.52%) and Technology (13.38%) form a strong second tier of contributors. Consumer Defensive represents 11.41%, reinforcing the role of essential-goods businesses in maintaining steady income streams.
At the industry level, Integrated Oil & Gas now leads with 12.53% of total payouts. Drug Manufacturers contribute 10.70%, while Oil & Gas Midstream adds another 5.45%. Diversified Banks account for 5.17%, and Telecom Services represent 4.53%.
Overall, the updated Q1 2026 data shows a clear shift toward energy-related payouts while maintaining a diversified income base across healthcare, technology, financials, and defensive sectors.
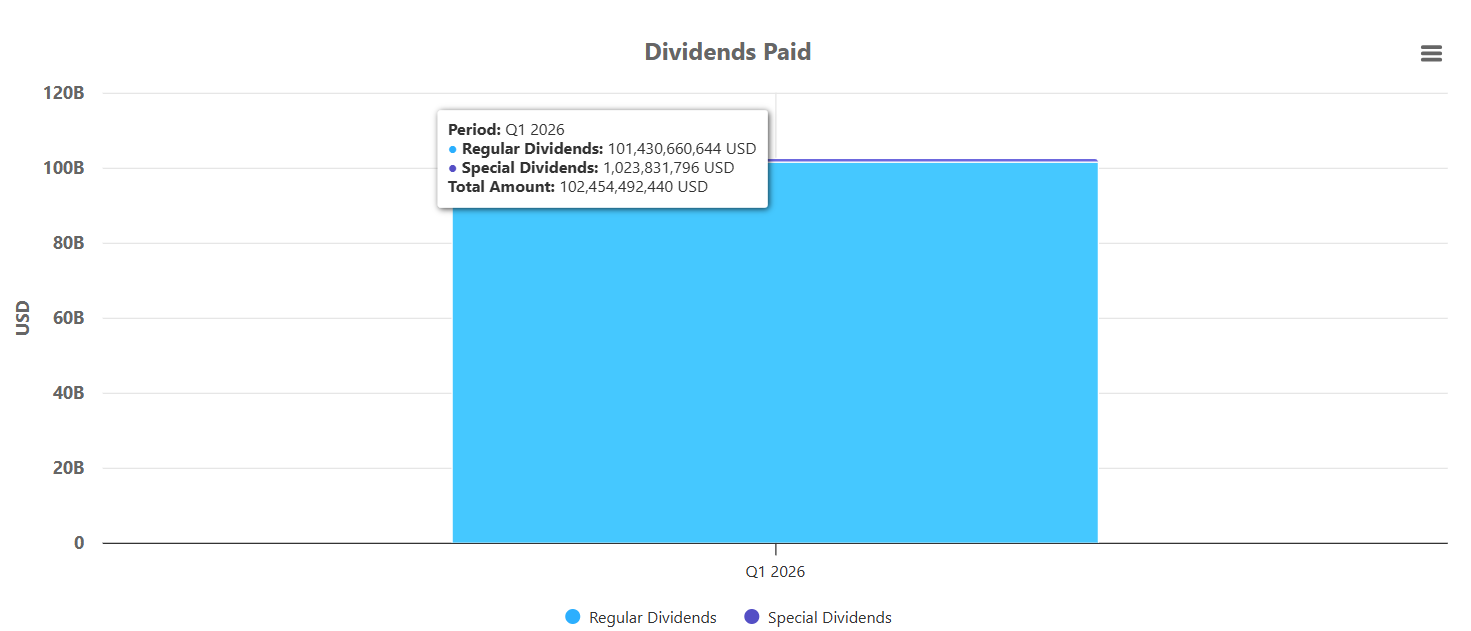
Cumulative Dividends Paid by U.S. Companies — Q1 2026 (YTD)
Dividend payments from U.S. companies continue to demonstrate stability in the first quarter of 2026, based on year-to-date data with the quarter still in progress.
So far in Q1 2026, total cumulative dividends paid amount to approximately $102.45 billion. Of that total, $101.43 billion represents regular dividends, while $1.02 billion comes from special dividends.
As in prior periods, the overwhelming majority of payouts are driven by recurring regular dividends rather than one-time distributions. This composition reinforces the structural strength of U.S. corporate cash flows and the continued reliance on sustainable operating earnings to support shareholder returns.
Since the quarter is not yet complete, these figures remain preliminary and will adjust as additional payments are reported. However, the current data indicates that dividend activity remains consistent and firmly supported by recurring distributions rather than special-event payouts.
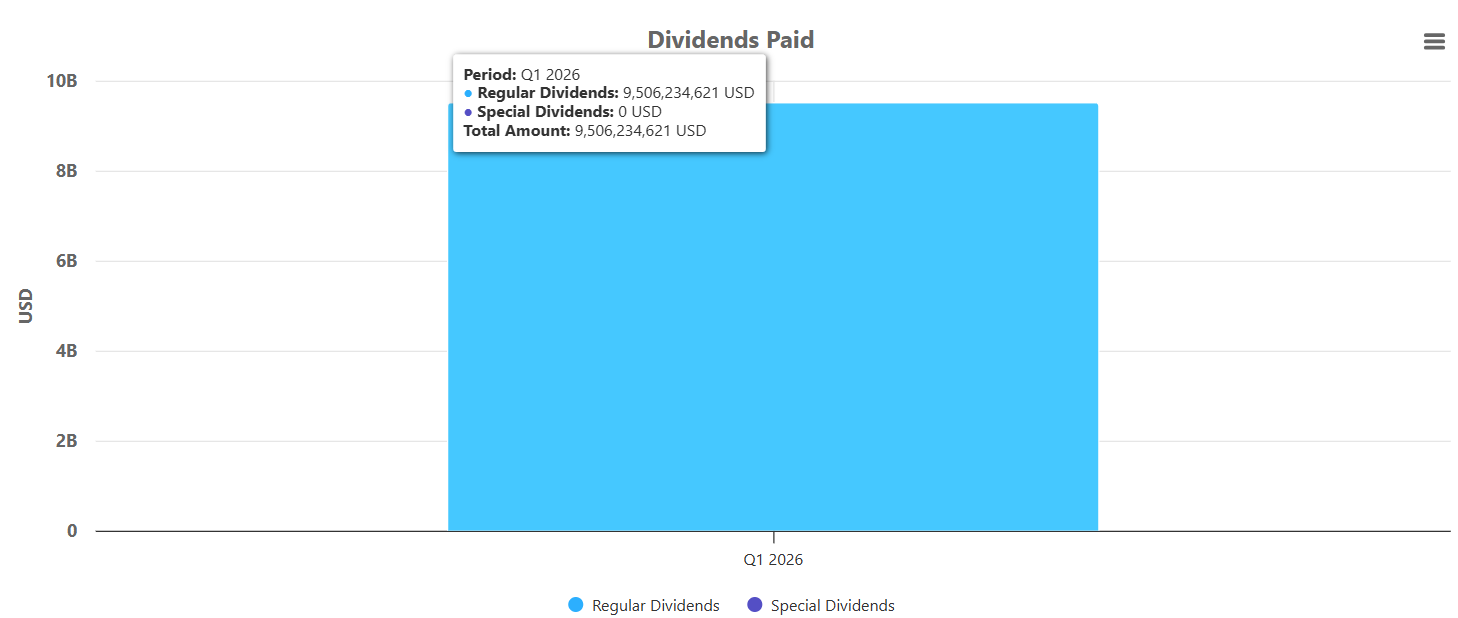
Cumulative dividends paid by US Dividend Eagles in 2026
Dividend Eagles — companies with 15+ consecutive years of dividend growth — continue to deliver consistent cash distributions in the first quarter of 2026.
So far in Q1 2026, cumulative dividends paid by Dividend Eagles total approximately $9.51 billion, entirely composed of regular dividends. No special dividends have been reported at this stage of the quarter.
As the quarter is still in progress, these figures remain preliminary and will adjust as additional payments are recorded. However, the current data once again highlights the structural strength of this group: distributions are driven purely by recurring operating cash flows rather than one-time events.
The continued dominance of regular dividends reinforces the predictability and durability of income generated by long-term dividend growth companies.
Proof That Dividend Eagles Deliver, Year After Year
Over the past decade, U.S. Dividend Eagles — companies with 15+ consecutive years of dividend increases — have shown a steady and sustained expansion in total cash returned to shareholders.
Annual dividend payouts grew from approximately $68 billion in 2015 to $134.4 billion in 2025, representing nearly a 100% increase over the period. This growth reflects not only rising earnings but also a consistent commitment by these companies to return cash through regular dividend increases across multiple economic cycles.
The decade-long trend demonstrates that Dividend Eagles have been able to maintain and expand their payout capacity through periods of economic recovery, inflation, and shifting market conditions — providing a long-term foundation of reliable and growing shareholder income.
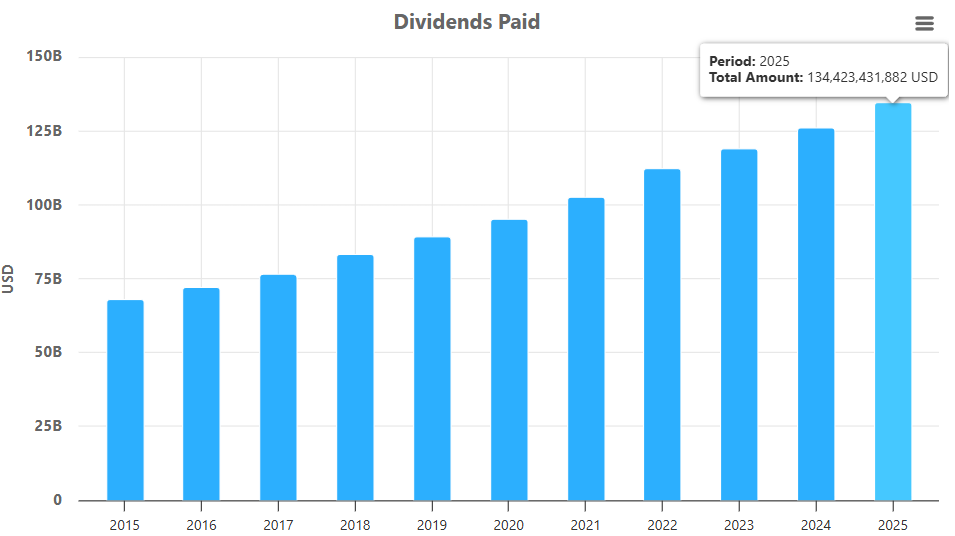
📊 This chart makes the MaxDividends concept crystal clear: when you own businesses that never stop paying and keep raising the bar every single year, your income stream snowballs in front of your eyes. These are not flashy promises — they are the most reliable wealth-building machines in the market.
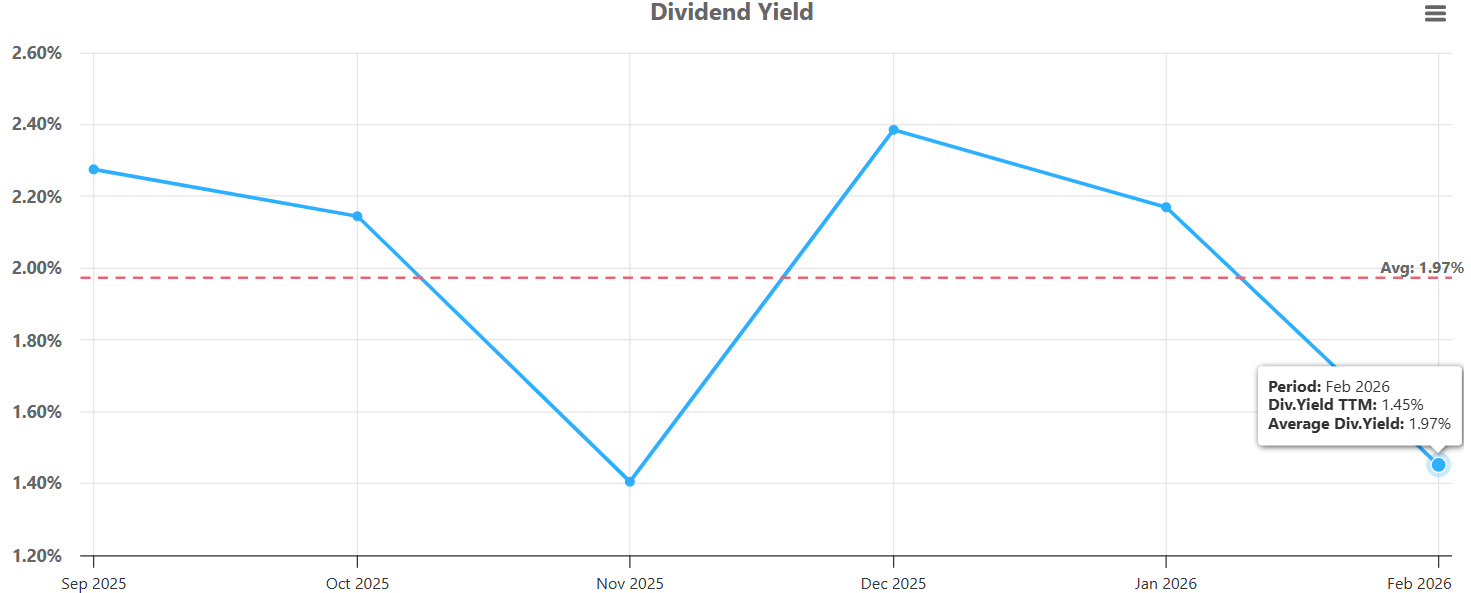
Average Dividend Yield of Dividend Eagles, Q1 2026 (YTD)
Over the past six months, the average dividend yield of Dividend Eagles has moved through a noticeable cycle, reflecting shifts in valuation and price performance.
Yields stood near 2.27% in September, gradually eased to 2.15% in October, and then declined sharply to around 1.40% in November. A strong rebound followed in December, with yields peaking near 2.38%, before moderating again to 2.17% in January.
As of February 2026, the average dividend yield has declined to 1.45%, well below the long-term average of 1.97%.
This compression in yield suggests that price appreciation has outpaced dividend growth in recent months, creating a tighter income environment. While underlying dividend payments remain stable, current valuations imply a more premium pricing backdrop for Dividend Eagles compared to their historical average yield level.
🥇 Top 5 Dividend Eagles by Total Payouts (2026 YTD)
These are the heavyweights — the Dividend Eagles returning the most cash to shareholders right now:
Microsoft (MSFT) — 💵 $6.79B
Johnson & Johnson (JNJ) — 💵 $3.16B
Procter & Gamble (PG) — 💵 $2.59B
Visa (V) — 💵 $1.47B
Qualcomm (QCOM) — 💵 $0.98B
📊 Together, these five companies have already distributed approximately $15.0 billion in dividends in 2026 year-to-date — a clear illustration of the scale and consistency behind the Dividend Eagles group.
And that’s exactly what the Dividend Eagles List is all about. 🦅 It’s our curated lineup of 100+ U.S. companies that have raised dividends for 15+ consecutive years — the strongest, most consistent payers in the market. These aren’t just stocks; they’re proven wealth-building machines built on financial stability, resilience, and decades of shareholder commitment.
👉 The full, always-updated Dividend Eagles List is available inside the MaxDividends App — exclusive to our community.
Created by the MaxDividends Team. Available only on MaxDividends. Exclusive.
U.S. Dividend Landscape - (S&P 500)
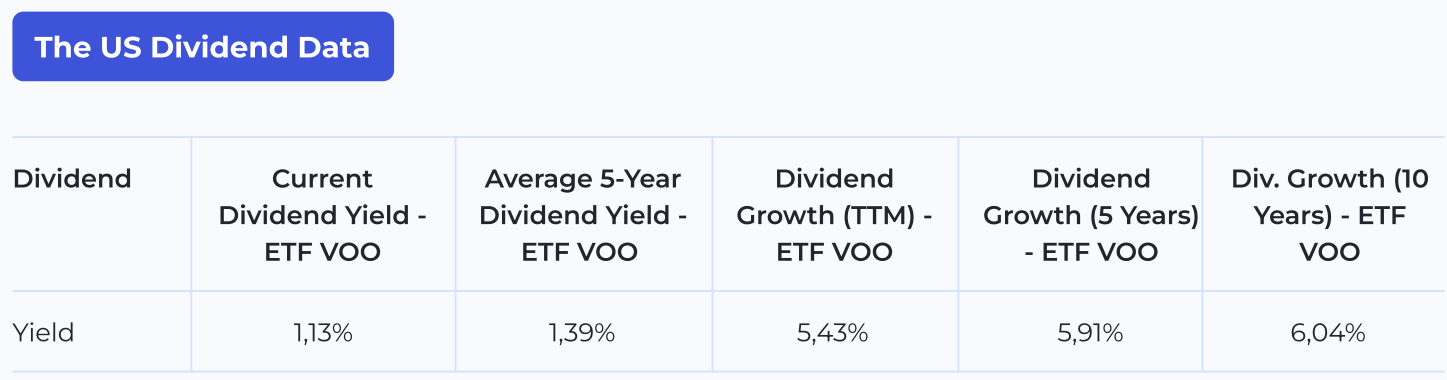
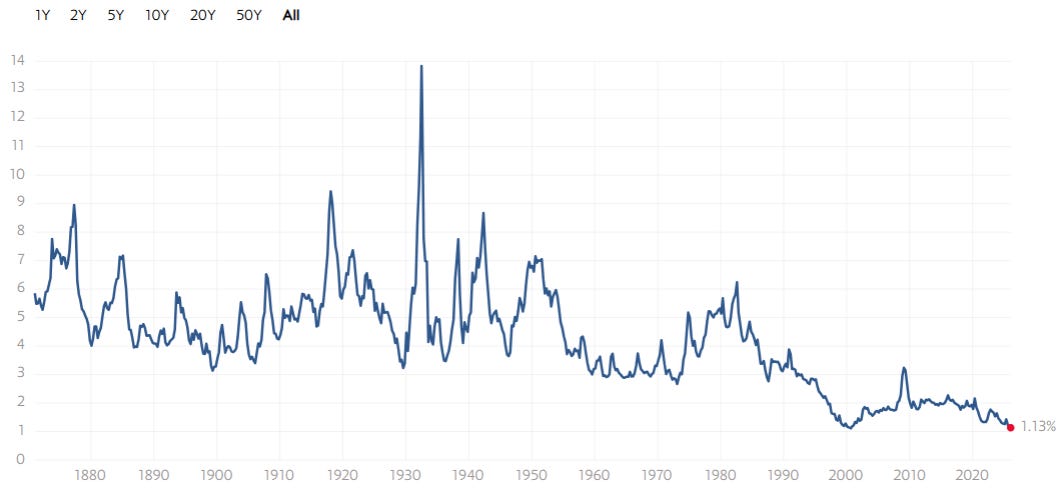
S&P 500 Dividend Yield — Historical Perspective
The S&P 500 dividend yield has drifted even lower, now sitting at 1.13% — one of the lowest levels in more than a century of market history. Stock prices remain high relative to the dividends companies pay, keeping yield levels deeply compressed.
When viewed against nearly 150 years of data, today’s yield stands far below the long-term historical norm of 3–5%.
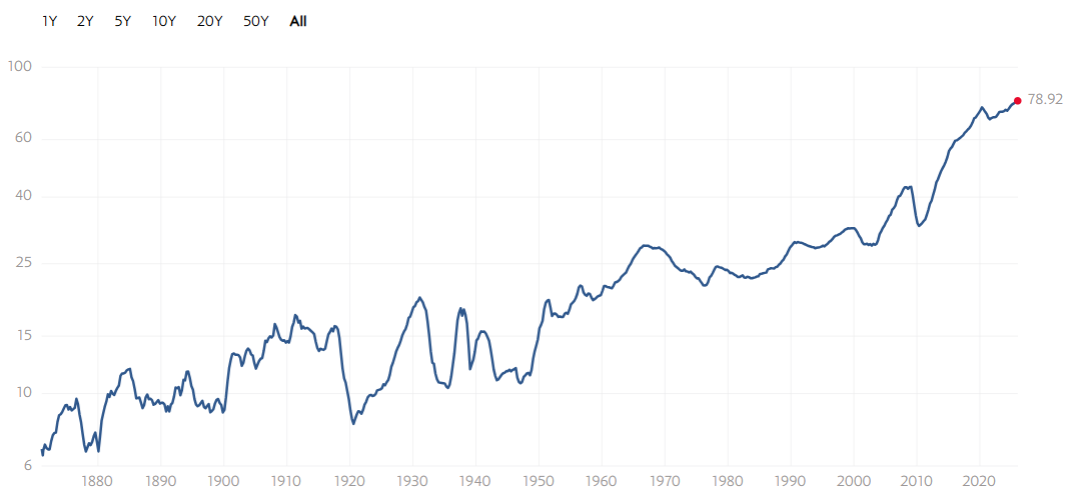
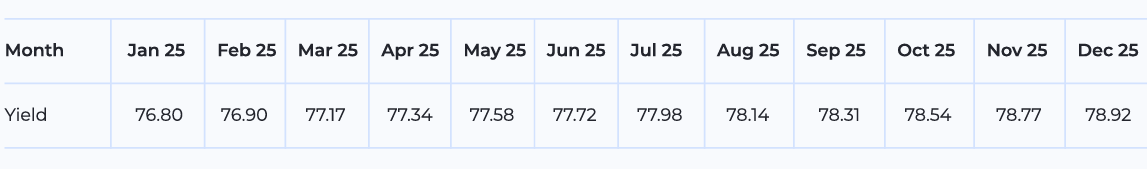
S&P 500 Historical Dividend Trends
Inflation-adjusted dividends for the S&P 500 continue to show a steady long-term upward trajectory. Even with periodic economic shocks and market volatility, the underlying growth trend in real dividends has remained intact for more than a century.
The previous inflation-adjusted peak came in May 2020, when dividends reached 73.09. Today, that figure stands at 78.92, setting a new all-time high and highlighting the ongoing strength of corporate cash flows within the index.
S&P 500 Dividend Growth
The S&P 500 dividend growth trend continues to demonstrate long-term resilience. Over more than three decades, negative dividend growth has occurred only during major economic stress periods, highlighting how rarely large U.S. companies reduce their payouts on a broad basis.
The latest reading shows dividend growth at approximately 5.46%, indicating a moderate but still positive pace of expansion across the index. While this level is below the higher growth rates seen during earlier recovery phases, it remains consistent with an environment of stable corporate earnings and ongoing cash distributions.
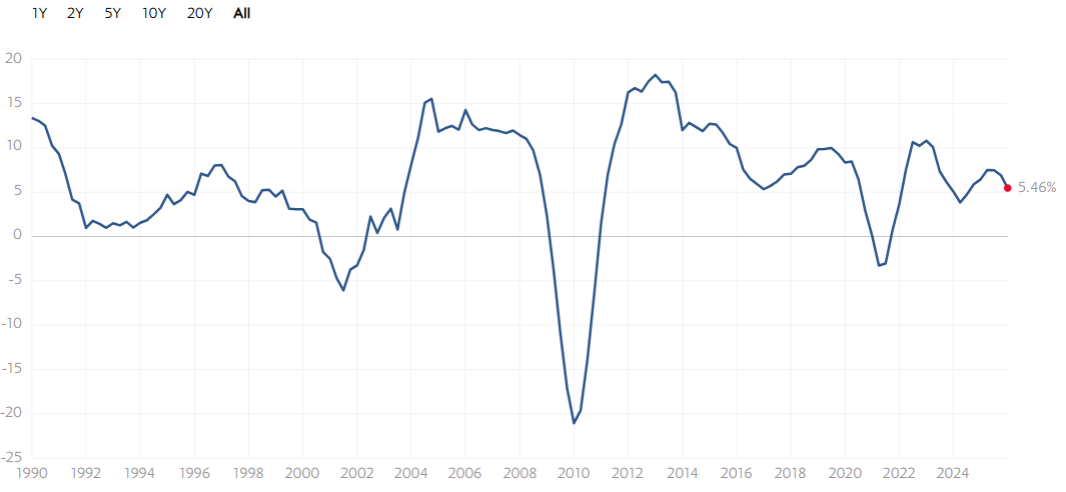
Despite market volatility and shifting economic conditions, the longer-term pattern of dividend growth remains positive, reflecting the ability of S&P 500 companies to maintain and gradually increase shareholder payouts over time.
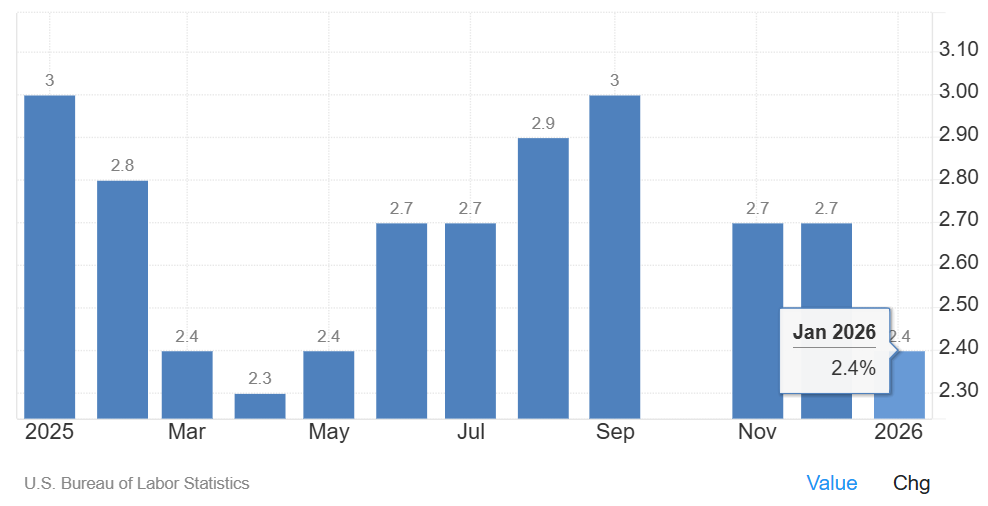
Inflation’s Impact on Dividends
Inflation has continued to move within a contained range entering 2026, shaping the real (inflation-adjusted) value of dividend income without creating renewed price instability.
After easing to a low near 2.3% in April 2025, inflation gradually accelerated through the summer, reaching 2.9% in August and peaking at 3.0% in September. It then moderated toward year-end, settling around 2.7% in November and December.
As of January 2026, inflation stands at 2.4%, marking a further decline from late-summer highs and bringing price growth closer to the mid-2% range.
This renewed moderation reduces pressure on real dividend income compared to the September peak. With inflation trending back toward the lower end of the recent range, nominal dividend increases are once again translating more effectively into real income growth.
For your convenience, we have prepared a PDF version of the Dividend Macro Overview. You can download and review it at any time.
🎁 One More Bonus!
My Personal Stock Watchlist — March 2026
A hand-picked list of the dividend stocks I’m actively tracking this month.
Each month I hand-pick a focused shortlist of dividend stocks worth watching. No guesswork, no hype — I screen thousands of companies and keep only the ones with strong balance sheets, reliable dividend growth, and long-term wealth-building potential.
This watchlist is where I’m putting my energy — a mix of high-yield opportunities and growth names with the power to multiply income streams over time. If you’re serious about building a future where dividends cover your lifestyle, this is where to start.
🎯 My 4 Standout Candidates for March
Keep reading with a 7-day free trial
Subscribe to MaxDividends to keep reading this post and get 7 days of free access to the full post archives.