

The MaxDividends Macro Report is your monthly deep dive into global dividend trends — packed with data, insights, and analysis from the most dividend-focused team and community in the world.
💬 Like, share, and repost to spread the dividend mindset!
Hey Dividend Investors!
Our latest MaxDividends Macro Report — December 2025 is here, and it’s loaded with sharp, data-driven insights to keep your income strategy moving upward.
Each week, we track thousands of dividend-paying companies across global markets — studying trends, running the numbers, and cutting through the noise so you don’t have to. Every chart, metric, and signal you see here comes from hours of careful analysis by the MaxDividends team.
And the mission behind all that work stays the same: helping you build a dividend income stream that’s reliable today and growing for years ahead.
We’re the most dividend-focused community on Earth — and you’re right in the heart of it.
The MaxDividends Macro Report
Dividend Eagles: 3 Top-Performing Dividend Stocks of the Month
Updated Dividend Eagles Top Stocks List
The Most Notable Dividend Increases
Dividend Macro Highlights:
Global Dividend Trends
US Dividend Trends
⭐ My Personal Stock Watchlist for December 2025
The new MaxDividends PDF Macro Report for December is a must-see for every dividend investor.
🎁 Bonus!
Inside, you’ll find 5 outstanding dividend stock ideas, fresh market trends, macro insights, and real-world plans to grow your income — all crafted by the MaxDividends team.
We’re sharing it today with the entire community so everyone can see just how powerful these reports are — packed with value, guidance, and data worth far more than a couple cups of coffee. Trends, top lists, strategies, support, insights — and of course, the app that ties it all together.
Dividend Eagles Deliver ~$157B YTD
3 Top-Performing Dividend Eagles of December
The "Dividend Eagles List" comprises approximately 100 of the most reliable dividend-paying companies in the U.S. market, each boasting over 15 consecutive years of increasing dividends.
These companies have been meticulously selected based on stringent criteria established by the MaxDividends team.
🥉 +18.19% ADI Analog Devices
Precision Powering the Digital World
Analog Devices is a global leader in high-performance analog, mixed-signal, and digital signal processing semiconductors. Its chips sit deep inside mission-critical systems — from industrial automation and automotive electronics to communications infrastructure and healthcare equipment.
Founded in 1965 and headquartered in Massachusetts, ADI has built its reputation on engineering excellence and long product lifecycles. Many of its components remain in use for decades, creating stable, recurring demand that few semiconductor companies can match.
This durability translates into strong free cash flow across cycles. Combined with disciplined capital allocation and a conservative payout philosophy, it has supported ADI’s long-standing record of consistent dividend growth — even through volatile tech cycles.
🥈 +18.65% ACU Acme United Corp
Essential Tools, Quietly Compounding
Acme United is a niche manufacturer of everyday, mission-critical tools — including first-aid kits, cutting instruments, and safety products used in homes, schools, workplaces, and industrial environments.
Founded in 1867 and headquartered in Connecticut, Acme United operates with a focused, no-nonsense business model. Its brands may not grab headlines, but they occupy stable, repeat-purchase categories with steady demand across economic conditions.
This consistency shows up in reliable cash generation and conservative balance-sheet management. By keeping operations lean and capital needs modest, Acme United has quietly maintained a durable dividend growth record — a textbook example of how boring businesses often make excellent income investments.
🥇 +23.61% JBHT J.B. Hunt Transport Services
Moving America, Mile After Mile
J.B. Hunt is one of the largest and most influential logistics operators in the United States, managing freight across trucking, rail, and intermodal networks. Its services form a critical backbone of the U.S. supply chain, supporting retailers, manufacturers, and industrial customers nationwide.
Founded in 1961 and based in Arkansas, J.B. Hunt pioneered the truck-to-rail intermodal model — long before efficiency and emissions became industry priorities. Today, its scale, technology platform, and long-term customer contracts give it a powerful competitive position.
Those advantages drive steady operating cash flow through economic cycles. Combined with disciplined reinvestment and shareholder-friendly capital allocation, J.B. Hunt continues to grow dividends while modernizing the infrastructure that keeps American commerce moving.
Dividend One-Pager of the Month
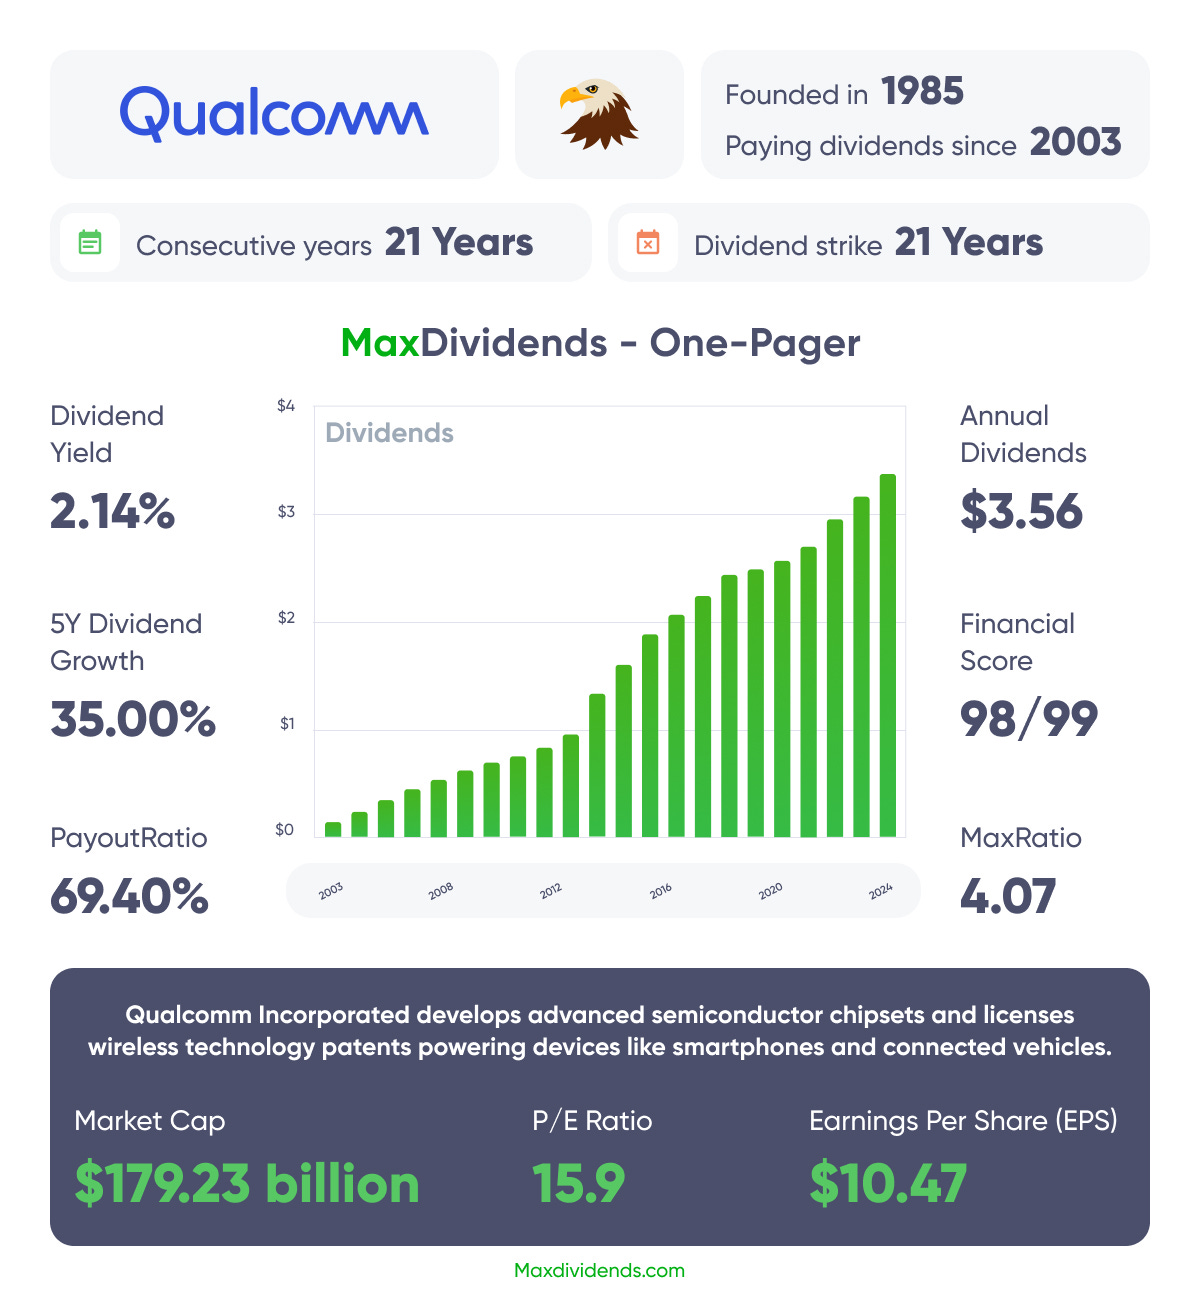
A Proven Dividend Eagle 🦅
15+ consecutive years of dividend increases
Qualcomm pays a quarterly cash dividend — as of now, it’s $0.89 per share. That adds up to roughly $3.56 per share per year, giving a yield of around 2.05%.
The company has been steadily raising its dividend: in March 2025, Qualcomm bumped it up from $0.85 to $0.89. Their long-term track record shows consistent growth — according to Dearborn Partners, that was the 21st consecutive annual dividend increase.
When it comes to sustainability, the payout ratio (how much of its earnings Qualcomm pays out as dividends) is moderate. Based on trailing earnings, it’s about 72.8%, but based on estimates for next year it drops to around 36%.
On top of dividends, Qualcomm also returns capital via share buybacks, which helps boost total shareholder returns.
If you want to dive deeper, the full list of all Dividend Eagles — with up-to-date analytics, financial scores, valuations, streaks, payout metrics, and every data point you need — is available in Premium inside the MaxDividends App for all partners right here:
👉 the full list of all Dividend Eagles
This is where you can explore every Eagle in detail, compare quality, screen for opportunities, and build a portfolio with true long-term horsepower.
And now, let’s get into the good part — a hand-picked set of dividend ideas worth your attention this month, selected for reliability, growth, and real income-producing strength. Let’s dive in.
List of Undervalued Dividend Stocks (December) 🔥

💡 MaxDividends Mission: Helping people build growing passive income, retire early, and live off dividends.
The Most Notable Dividend Increases of the Month
Mastercard (MA) — Dividend Increase: +14.5%
14+ consecutive years of rising dividends
Mastercard operates one of the world’s largest global payments networks, enabling electronic transactions across consumers, merchants, banks, and digital platforms in more than 200 countries. Its asset-light, toll-booth business model benefits from global commerce growth, pricing power, and secular shifts away from cash.
The company’s scale, trusted brand, and embedded role in global payment infrastructure translate into consistently high margins and strong free cash flow generation across economic cycles.
Mastercard raised its quarterly dividend from $0.76 to $0.87 per share, a 14.5% increase, extending its dividend growth streak to 14 consecutive years. The increase reflects strong underlying cash generation and a long runway for continued dividend growth supported by low capital intensity and disciplined capital allocation.
Automatic Data Processing (ADP) — Dividend Increase: +10.4%
50+ consecutive years of rising dividends
Automatic Data Processing is a global leader in payroll processing, human capital management, and workforce services. Its deeply embedded client relationships, recurring revenue model, and mission-critical services create highly predictable cash flows.
ADP’s business benefits from employment scale, regulatory complexity, and high switching costs — factors that support resilience through economic cycles and make it a cornerstone holding for income-focused investors.
The company increased its quarterly dividend from $1.54 to $1.70 per share, a 10.4% raise, extending an exceptional 51-year dividend growth streak. This places ADP among the most elite long-term dividend compounders in the market, supported by decades of conservative financial management and durable earnings power.
Atmos Energy (ATO) — Dividend Increase: +14.9%
40+ consecutive years of rising dividends
Atmos Energy is a regulated natural gas utility serving residential, commercial, and industrial customers across multiple U.S. states. Its earnings are driven primarily by rate-based infrastructure investments and long-term regulatory frameworks designed to deliver steady returns.
As a utility, Atmos prioritizes system safety, modernization, and predictable capital deployment — resulting in stable earnings visibility and dependable cash flows largely insulated from economic volatility.
Atmos raised its quarterly dividend from $0.87 to $1.00 per share, a 14.9% increase, extending its dividend growth streak to 42 consecutive years. The hike reflects confidence in its regulated growth model and reinforces Atmos Energy’s role as a reliable, income-focused compounder within dividend portfolios.
The Most Solid Recent Dividend Hikes
ACNB (ACNB) +11.76%
American Financial Group (AFG) +10.00%
Amphenol (APH) +51.52%
D.R. Horton (DHI) +12.50%
CRA (CRAI) +16.33%
Comfort Systems USA (FIX) +20.00%
Murphy USA (MUSA) +18.87%
Dividend Macro Highlights: Global Dividend Trends
The macro report is updated quarterly
Global: Latest Dividend Data
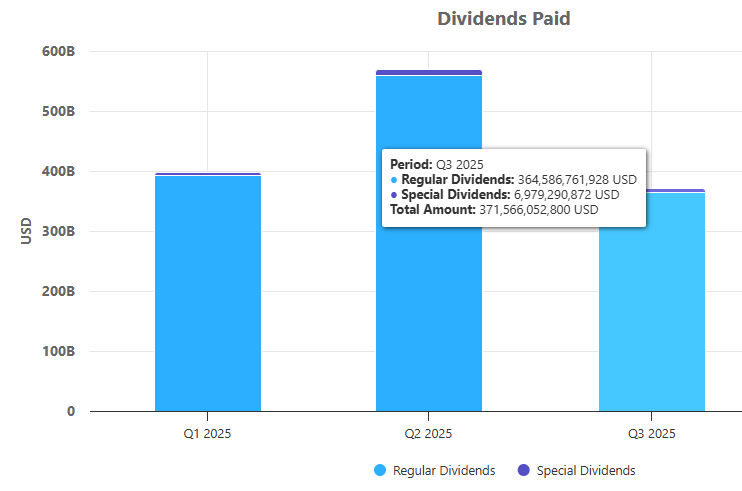
The global cumulative dividend payout for Q3 2025 continued the upward trend seen in Q2 2020.
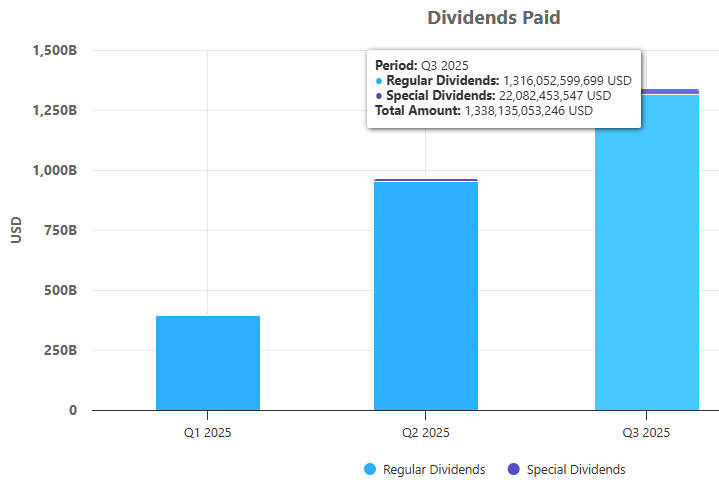
This indicates that most dividend-paying companies have weathered the impact of the 2020 crisis and successfully adapted their businesses to the new reality.
Global Total Quarterly Dividend Payments (US$ Billions)
Global dividend payments continued to show strong momentum through 2025. Companies paid out approximately $390 billion in dividends during the first quarter, followed by a significantly higher $570+ billion in the second quarter.
With Q3 now fully reported, total dividend payments reached $371.6 billion, including regular and special distributions. While lower than the exceptionally strong Q2 levels, the third quarter still reflects a solid global payout pace and underscores the resilience of corporate cash flows across major markets (Figure 1).
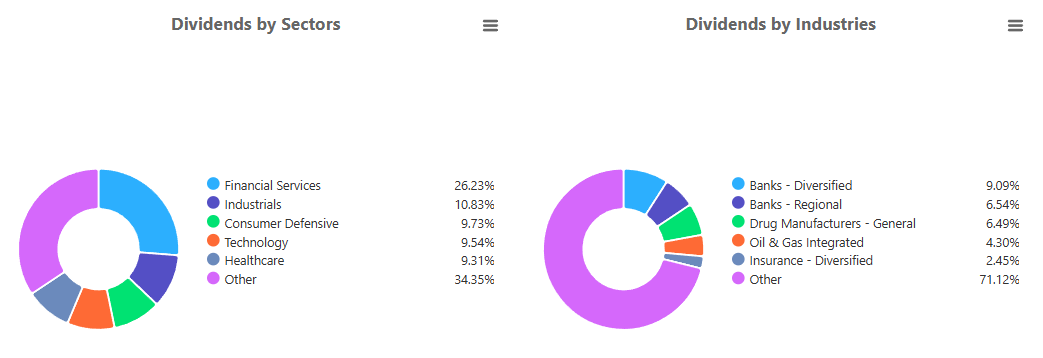
Global Dividend Breakdown — Q4 2025 Year-to-Date
These charts show how global dividend payments have been distributed across sectors and industries through the latest data for 2025.
Financial Services remain firmly in the lead, accounting for 26.23% of all global dividend payouts. Industrials contribute 10.83%, while Consumer Defensive (9.73%), Technology (9.54%), and Healthcare (9.31%) each play similarly sized roles in the global income landscape. The broad 34.35% “Other” category underscores the growing diversification of dividend-paying companies worldwide.
At the industry level, banks continue to dominate, with diversified and regional banks combining for 15.63% of total global payouts. Drug manufacturers (6.49%), integrated oil & gas (4.30%), and diversified insurance (2.45%) also remain meaningful contributors.
Meanwhile, the large 71.12% “Other” segment reflects the wide range of industries now participating in global dividend generation.
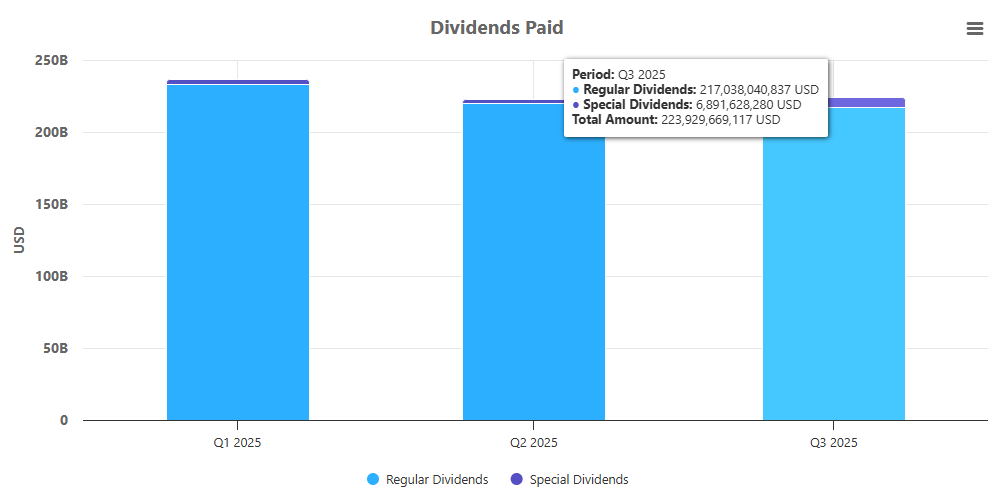
U.S. Dividend Landscape
The chart illustrates total dividend payments by U.S. companies in 2025, broken down by quarter.
Q1 and Q2 maintained strong momentum, with payouts in the $230–240 billion range — reflecting healthy profits and continued commitment to shareholder returns.
For Q3 2025, total dividends reached $223.9 billion, including $217.0 billion in regular dividends and $6.9 billion in special dividends.
Regular payouts continue to make up the vast majority of distributions, while special dividends add a modest boost — together confirming that U.S. companies remain financially strong and shareholder-oriented heading into year-end.
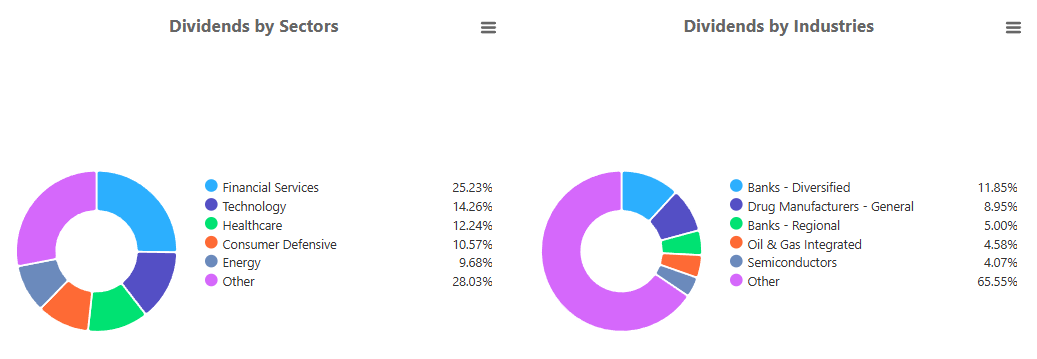
U.S. Dividend Breakdown — Q4 2025 Year-to-Date
These charts show how dividend payments in the U.S. market are distributed across sectors and industries as 2025 approaches its final stretch.
Financial Services remain the dominant dividend-paying sector, contributing 25.23% of all U.S. payouts. Technology follows with 14.26%, while Healthcare (12.24%), Consumer Defensive (10.57%), and Energy (9.68%) form a balanced group of steady contributors. The 28.03% “Other” category continues to signal a broadening dividend base across the market.
At the industry level, diversified banks lead with 11.85% of total payouts. Drug manufacturers add 8.95%, while regional banks contribute another 5.00%. Integrated oil & gas (4.58%) and semiconductors (4.07%) round out the next tier. The large 65.55% “Other” share highlights the wide variety of industries now playing meaningful roles in the U.S. dividend landscape.
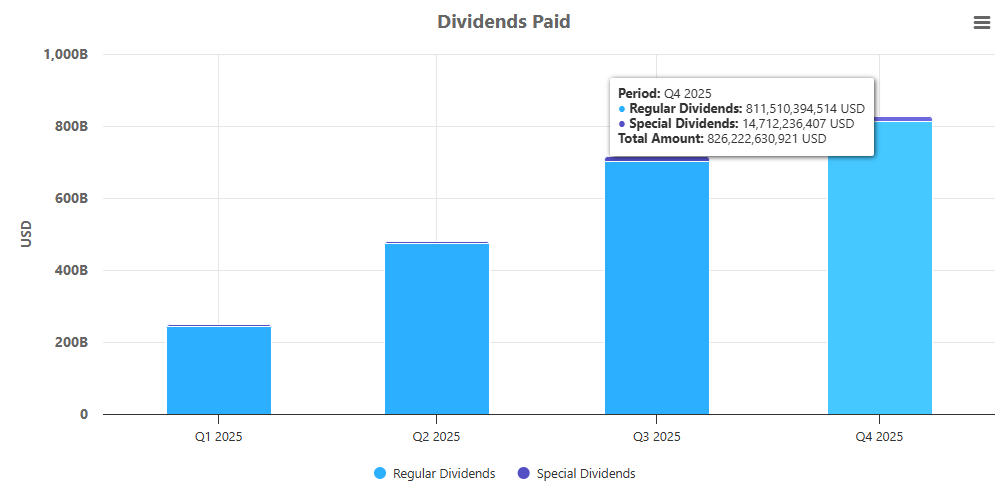
Cumulative dividends paid by US companies in 2025
Dividends paid by U.S. companies in 2025 continue to grow steadily as the year progresses.
Cumulative payouts reached roughly $235B by Q1, climbed to around $470B by Q2, and moved past $680B in Q3. As of the latest Q4 data — with the quarter still underway — cumulative dividends have already exceeded $820B, pointing to another strong finish for the year.
Regular dividends remain the dominant driver of total payouts, while special dividends contribute only a small share, underscoring the reliability and consistency of U.S. corporate cash distributions.
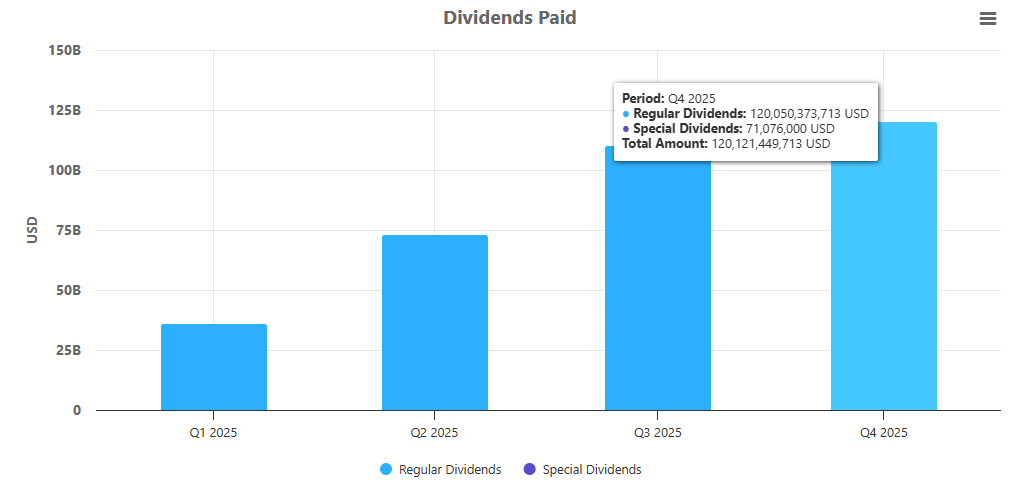
Cumulative dividends paid by US Dividend Eagles in 2025
Dividend Eagles — companies with 15+ years of consecutive dividend growth — have now paid out more than $120B in dividends year-to-date 2025.
Payouts continued to rise quarter after quarter: roughly $35B by Q1, nearly $75B by Q2, and just over $110B by Q3. With Q4 still underway, total dividends have already surpassed $120B, reflecting another strong year of steady, reliable cash returns from America’s most consistent dividend growers.
Proof That Dividend Eagles Deliver, Year After Year
Over the past decade, US Dividend Eagles — companies with 15+ years of consecutive dividend increases — have nearly doubled their annual payouts, climbing from around $75B in 2016 to more than $140B in 2024. That’s pure cash returned to shareholders, without even counting the effect of reinvestment.
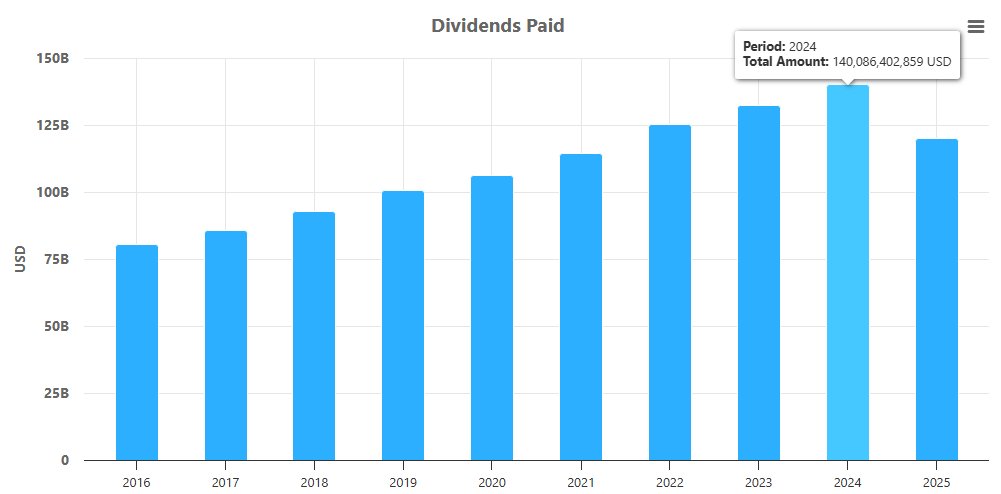
📊 This chart makes the MaxDividends concept crystal clear: when you own businesses that never stop paying and keep raising the bar every single year, your income stream snowballs in front of your eyes. These are not flashy promises — they are the most reliable wealth-building machines in the market.
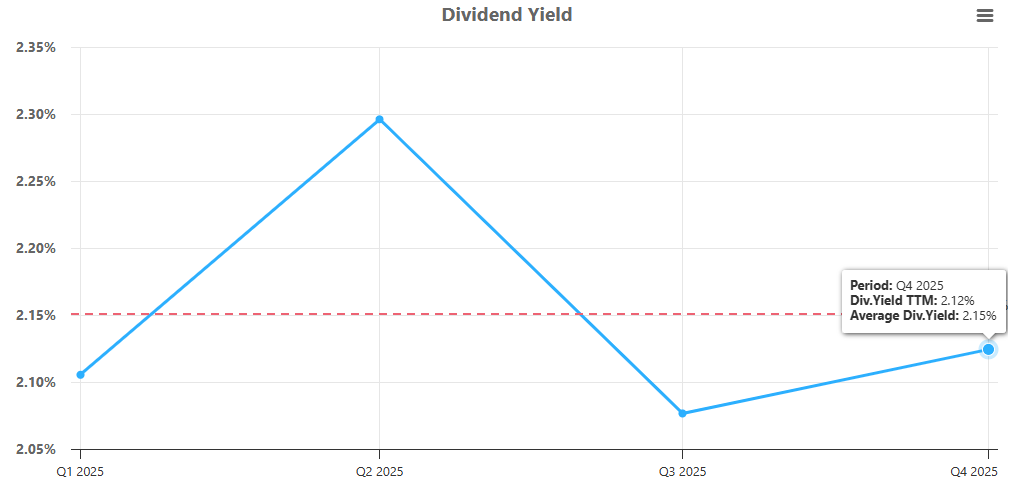
Average Dividend Yield of Dividend Eagles, Q4 2025
In 2025, the average dividend yield of Dividend Eagles moved through a modest midyear cycle before stabilizing into year-end. Yields started near 2.10% in Q1, peaked around 2.30% in Q2, and then dipped to just above 2.08% in Q3.
By Q4, the average yield recovered to 2.12%, landing slightly below the long-term average of 2.15%. This mild rebound suggests steady income conditions and a broadly stable valuation backdrop for America’s most reliable dividend growers.
🥇 Top 5 Dividend Eagles by Total Payouts (2025 YTD)
These are the heavyweights — the Dividend Eagles returning the most cash to shareholders right now:
Microsoft (MSFT) — 💵 $25.38B in dividends
Johnson & Johnson (JNJ) — 💵 $12.37B
Procter & Gamble (PG) — 💵 $10.25B
Home Depot (HD) — 💵 $9.02B
Coca-Cola (KO) — 💵 $8.81B
📊 Together, just these five companies alone have distributed over $55 billion in dividends so far — a powerful reminder of what it means to own reliable, world-class businesses that never stop paying.
And that’s exactly what the Dividend Eagles List is all about. 🦅 It’s our curated lineup of 100+ U.S. companies that have raised dividends for 15+ consecutive years — the strongest, most consistent payers in the market. These aren’t just stocks; they’re proven wealth-building machines built on financial stability, resilience, and decades of shareholder commitment.
👉 The full, always-updated Dividend Eagles List is available inside the MaxDividends App — exclusive to our community.
Created by the MaxDividends Team. Available only on MaxDividends. Exclusive.
U.S. Dividend Landscape - (S&P 500)
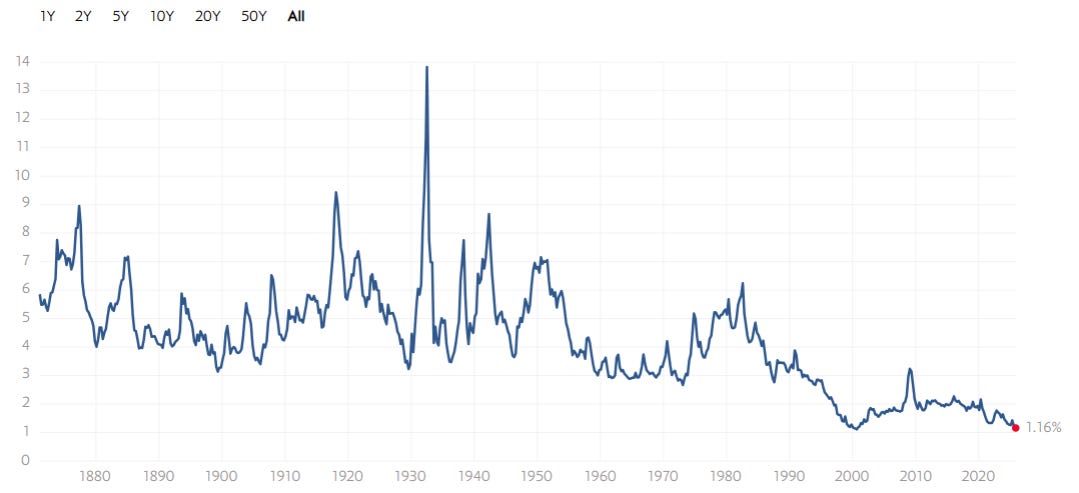
S&P 500 Dividend Yield — Historical Perspective
The S&P 500 dividend yield has drifted even lower, now sitting at 1.16% — one of the lowest levels in more than a century of market history. Stock prices remain high relative to the dividends companies pay, keeping yield levels deeply compressed.
When viewed against nearly 150 years of data, today’s yield stands far below the long-term historical norm of 3–5%.
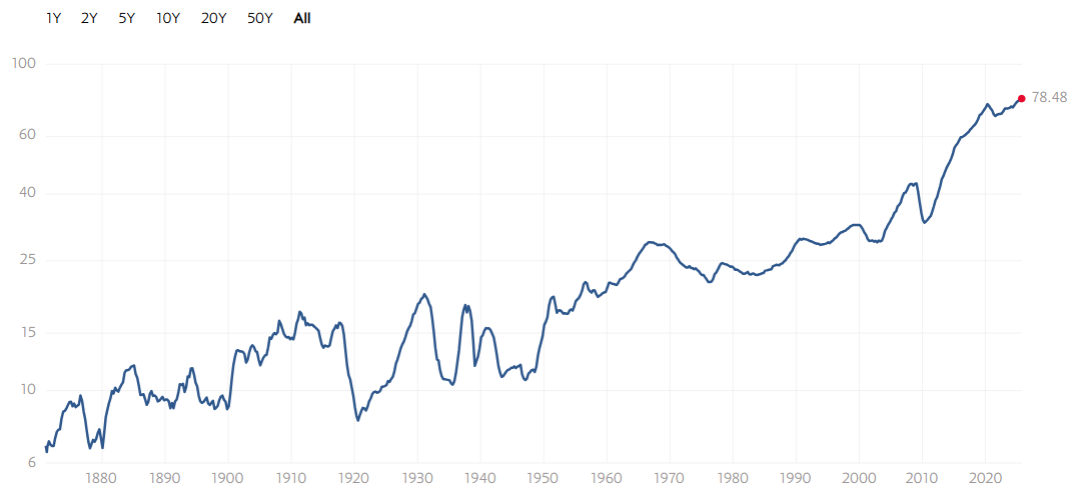
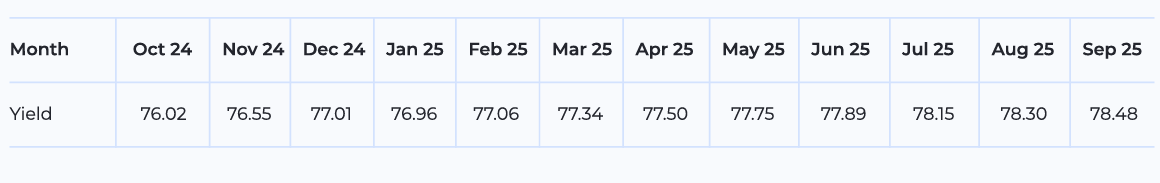
S&P 500 Historical Dividend Trends
Inflation-adjusted dividends for the S&P 500 continue to show a steady long-term upward trajectory. Even with periodic economic shocks and market volatility, the underlying growth trend in real dividends has remained intact for more than a century.
The previous inflation-adjusted peak came in May 2020, when dividends reached 73.09. Today, that figure stands at 78.48, setting a new all-time high and highlighting the ongoing strength of corporate cash flows within the index.
S&P 500 Dividend Growth
The S&P 500 dividend growth trend continues to demonstrate long-term resilience. Over the past 32 years, negative dividend growth has appeared only during major crisis periods — confirming how rarely large U.S. companies reduce their payouts.
The latest reading shows dividend growth at 6.92%, reflecting a steady pace of expansion and solid earnings support across the index.
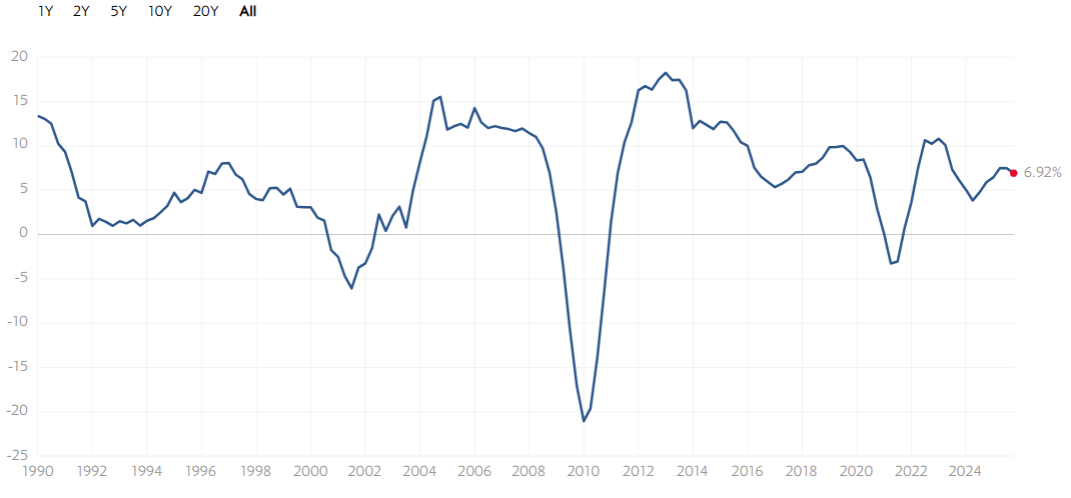
Despite market volatility and shifting economic conditions, the broader pattern remains firmly positive.
Inflation’s Impact on Dividends
Inflation has continued to move in a narrow range through 2025, shaping how real (inflation-adjusted) S&P 500 dividends appear on the long-term chart. After cooling sharply from the 2022 peak, inflation remained subdued in early 2025 — dipping to 2.3% in March — which provided a more supportive backdrop for real dividend growth.
Through mid-2025, inflation hovered between 2.4% and 2.7%, before rising again toward 2.9% in late summer and touching 3.0% in September.
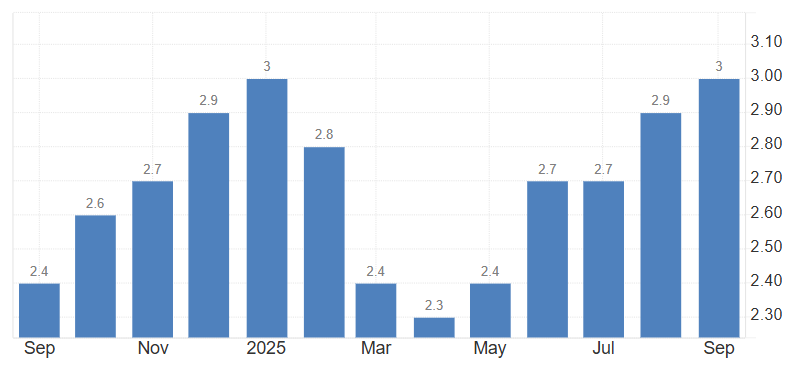
This mild reacceleration limits the pace at which inflation-adjusted S&P 500 dividends can expand, keeping real dividend growth steady but far from the powerful upswing seen right after the 2022 inflation peak.
For your convenience, we have prepared a PDF version of the Dividend Macro Overview. You can download and review it at any time.
🎁 One More Bonus!
My Personal Stock Watchlist — December 2025
A hand-picked list of the dividend stocks I’m actively tracking this month.
Each month I hand-pick a focused shortlist of dividend stocks worth watching. No guesswork, no hype — I screen thousands of companies and keep only the ones with strong balance sheets, reliable dividend growth, and long-term wealth-building potential.
This watchlist is where I’m putting my energy — a mix of high-yield opportunities and growth names with the power to multiply income streams over time. If you’re serious about building a future where dividends cover your lifestyle, this is where to start.
🎯 My 6 Standout Candidates for December
Novo Nordisk (NVO)
Dividend Yield 3.76% | MaxRatio 26.98 | Financial Score 98
Novo Nordisk is a global healthcare leader best known for its diabetes and obesity treatments. Founded in 1923 and headquartered in Denmark, the company operates in more than 170 countries, with products serving millions of patients worldwide.
Key Business Segments
Diabetes & Obesity Care – Insulin, GLP-1 therapies, and innovative treatments for diabetes and weight management.
Rare Disease Treatments – Specialty medicines targeting hemophilia, growth disorders, and other rare conditions.
Biopharma & R&D – Heavy investment in next-generation biologics and clinical trials for chronic diseases.
Takeaway: With 29 straight years of dividend increases and 173% dividend growth in the last five years, Novo Nordisk is one of the most reliable healthcare dividend growth engines in the world.
Shoe Carnival (SCVL)
Dividend Yield 3.19% | MaxRatio 19.02 | Financial Score 96
Shoe Carnival Inc. is a U.S. footwear retailer offering affordable brand-name shoes for the entire family. Founded in 1978 and headquartered in Evansville, Indiana, it runs 400+ stores across the U.S. and Puerto Rico, blending value pricing with an upbeat in-store experience.
Key Business Segments
Retail Stores – Wide selection of athletic, casual, and dress footwear for men, women, and children.
E-Commerce – Online sales with buy-online, pick-up in-store convenience.
Private Label Brands – Exclusive offerings that boost margins and differentiate the product mix.
Loyalty Program (Shoe Perks) – Personalized promotions and repeat-customer rewards.
Takeaway: With 218% dividend growth in just five years and a conservative payout ratio under 20%, Shoe Carnival has emerged as a true dividend growth underdog.
Bank OZK (OZK)
Dividend Yield 3.81% | MaxRatio 10.25 | Financial Score 90
Bank OZK is a regional bank headquartered in Little Rock, Arkansas. Founded in 1903, it operates across the Southern U.S., offering retail and commercial banking services with a focus on conservative lending.
Key Business Segments
Community Banking – Personal checking, savings, and lending services across multiple states.
Commercial Real Estate Lending – Nationally recognized lender in real estate development finance.
Treasury & Wealth Management – Services tailored to both individuals and businesses.
Takeaway: With 25 consecutive years of dividend increases and a payout ratio under 30%, Bank OZK is a steady regional bank with dependable dividend growth.
Snap-on Incorporated (SNA)
Dividend Yield 2.82% | MaxRatio 10.90 | Financial Score 99
Snap-on is a global leader in professional tools, diagnostics, and equipment used by automotive technicians, industrial operators, and repair professionals. Its premium brands are deeply embedded in daily workflows, supported by a franchise-based distribution model that reinforces pricing power and customer loyalty.
Founded in 1920 and headquartered in Wisconsin, Snap-on operates worldwide, combining manufacturing excellence with direct customer relationships. Its tools are mission-critical, non-discretionary purchases — making demand resilient even during economic slowdowns.
Key Business Segments
Tools Group – Hand tools, power tools, and tool storage for professional technicians
Repair Systems & Information – Diagnostics, software, and repair solutions for modern vehicles
Commercial & Industrial – Tools and equipment for aerospace, defense, and heavy industry
Franchise Network – Direct distribution model enhancing margins and customer retention
Takeaway: With a Financial Score of 99, a balanced 45% payout ratio, and nearly 100% dividend growth over the past five years, Snap-on exemplifies a high-quality dividend growth business. While fairly valued today, its strong margins, brand power, and long dividend history support continued compounding for patient income investors.
G-Tekt Corp (5970)
Dividend Yield 5.00% | MaxRatio 15.97 | Financial Score 96
G-Tekt Corp is a Japanese manufacturer of automotive body and chassis components, specializing in high-precision metal stamping and structural parts for global automakers. The company plays a critical role in vehicle safety, weight reduction, and manufacturing efficiency — areas that remain essential regardless of economic cycles.
Founded in 1952 and headquartered in Japan, G-Tekt operates production facilities across Asia, North America, and Europe, supplying long-term customers under multi-year contracts. Its close integration with OEM production lines creates stable demand and high switching costs.
Key Business Segments
Automotive Structural Components – Body frames, chassis parts, and high-strength steel components used in passenger vehicles
Metal Stamping & Tooling – Precision manufacturing technologies supporting large-scale automotive production
Global OEM Supply – Long-term supply relationships with major Japanese and international automakers
Takeaway: With a 5.0% dividend yield, a conservative 35% payout ratio, and 15 consecutive years of dividend increases, G-Tekt stands out as an undervalued, income-oriented compounder. Dividend growth of 81% over the past five years highlights improving capital returns, while strong financial discipline supports sustainability even in cyclical auto markets.
Zoetis (ZTS)
Dividend Yield 1.64% | MaxRatio 10.41 | Financial Score 99
Zoetis is the world’s largest animal health company, supplying medicines, vaccines, diagnostics, and precision technologies for both pets and livestock. Founded in 1952 as part of Pfizer and headquartered in New Jersey, it operates in more than 60 countries and supports veterinarians, farmers, and pet owners globally.
Key Business Segments
Companion Animal Health – Treatments, vaccines, dermatology solutions, and diagnostics for dogs, cats, and horses — the company’s fastest-growing segment driven by rising pet ownership.
Livestock Health – Veterinary pharmaceuticals and vaccines for cattle, swine, poultry, and fish, helping producers maintain herd health and farm productivity.
Diagnostics & Precision Animal Tech – Digital tools, diagnostic platforms, and monitoring solutions that improve clinical accuracy and long-term care.
Biopharma R&D – A robust pipeline focused on parasiticides, dermatology, chronic conditions, and next-gen vaccines.
Takeaway: With more than a decade of uninterrupted dividend increases, high-margin products, and a dominant position in the global animal health market, Zoetis stands out as a long-term compounder.
✨ These six are my “front runners” for December. They’ve cleared every screen, proven themselves over time, and sit at the top of my focus list this month.
A complete list of my favorite stocks I’m currently tracking—only the best make it in.
💬 Like, share, and repost to spread the dividend mindset!
Happy dividends for all the holders!
- Max & MaxDividends Team
MaxDividends Mission
Helping people build growing passive income, retire early, and live off dividends.
Someone’s sitting in the shade today because someone planted a tree a long time ago. ― Warren Buffett.