


The MaxDividends Macro Report is your quarterly deep dive into global dividend trends — packed with data, insights, and analysis from the most dividend-focused team and community in the world.
MaxDividends Mission: Helping people build growing passive income, retire early, and live off dividends.
💬 Like, share, and repost to spread the dividend mindset!
Hey Dividend Investors!
Our latest MaxDividends Macro Report — Q4 2026 is here, and it’s loaded with sharp, data-driven insights to keep your income strategy moving upward.
Each week, we track thousands of dividend-paying companies across global markets — studying trends, running the numbers, and cutting through the noise so you don’t have to. Every chart, metric, and signal you see here comes from hours of careful analysis by the MaxDividends team.
And the mission behind all that work stays the same: helping you build a dividend income stream that’s reliable today and growing for years ahead.
We’re the most dividend-focused community on Earth — and you’re right in the heart of it.
The MaxDividends Macro Report
Inside: 5 Outstanding Dividend Stock Ideas
Dividend Eagles: 3 Top-Performing Dividend Stocks of the Quarter
Updated Dividend Eagles Top Stocks List
The Most Notable Dividend Increases
Dividend Macro Highlights:
Global Dividend Trends
US Dividend Trends
The new MaxDividends PDF Macro Report is a must-see for every dividend investor.
Like, share, and repost to spread the dividend mindset!
🎁 Bonus!
Inside, you’ll find 5 outstanding dividend stock ideas, fresh market trends, macro insights, and real-world plans to grow your income — all crafted by the MaxDividends team.
We’re sharing it today with the entire community so everyone can see just how powerful these reports are — packed with value, guidance, and data worth far more than a couple cups of coffee. Trends, top lists, strategies, support, insights — and of course, the app that ties it all together.
Dividend Eagles Deliver ~$97.74B in Dividends YTD
3 Top-Performing Dividend Eagles of Q3 2026
The “Dividend Eagles List” comprises approximately 100 of the most reliable dividend-paying companies in the U.S. market, each boasting over 15 consecutive years of increasing dividends.
These companies have been meticulously selected based on stringent criteria established by the MaxDividends team.
🥉 +34.49% MSFT — Microsoft Corporation
The Infrastructure Behind the AI Economy
Microsoft is one of the world’s largest technology companies, with businesses spanning cloud computing, enterprise software, productivity tools, cybersecurity, gaming, and artificial intelligence. Products such as Azure, Microsoft 365, Windows, and GitHub are deeply embedded in the daily operations of businesses around the world.
What makes Microsoft particularly powerful is the recurring nature of its revenue. Enterprise customers rely on its software and cloud infrastructure for mission-critical workloads, creating high switching costs and durable customer relationships. At the same time, Microsoft’s enormous investment capacity gives it a leading position in the ongoing expansion of AI infrastructure and services.
🥈 +40.77% MKTX — MarketAxess Holdings Inc
Digitizing the Global Bond Market
MarketAxess operates one of the world’s leading electronic trading platforms for fixed-income securities, connecting institutional investors and dealers across global credit markets. Its technology helps bring greater liquidity, transparency, and efficiency to a market that historically relied heavily on traditional dealer-based trading.
The company sits at the center of a long-term structural shift toward electronic bond trading. As more institutional fixed-income activity moves onto digital platforms, MarketAxess can benefit from higher trading volumes, network effects, and the growing value of its data and analytical tools.
🥇 +42.01% ACN — Accenture plc
Powering the Digital Transformation of Global Business
Accenture is one of the world’s largest professional services and technology companies, helping businesses modernize operations, migrate to the cloud, strengthen cybersecurity, adopt artificial intelligence, and redesign how they operate in an increasingly digital economy.
Its greatest advantage is the depth of its relationships with the world’s largest organizations. Accenture works across industries and technologies rather than depending on a single product or platform, allowing it to participate in multiple waves of enterprise technology spending. As AI becomes a larger strategic priority, that broad expertise gives Accenture another major long-term opportunity.
Dividend One-Pager of the Quarter
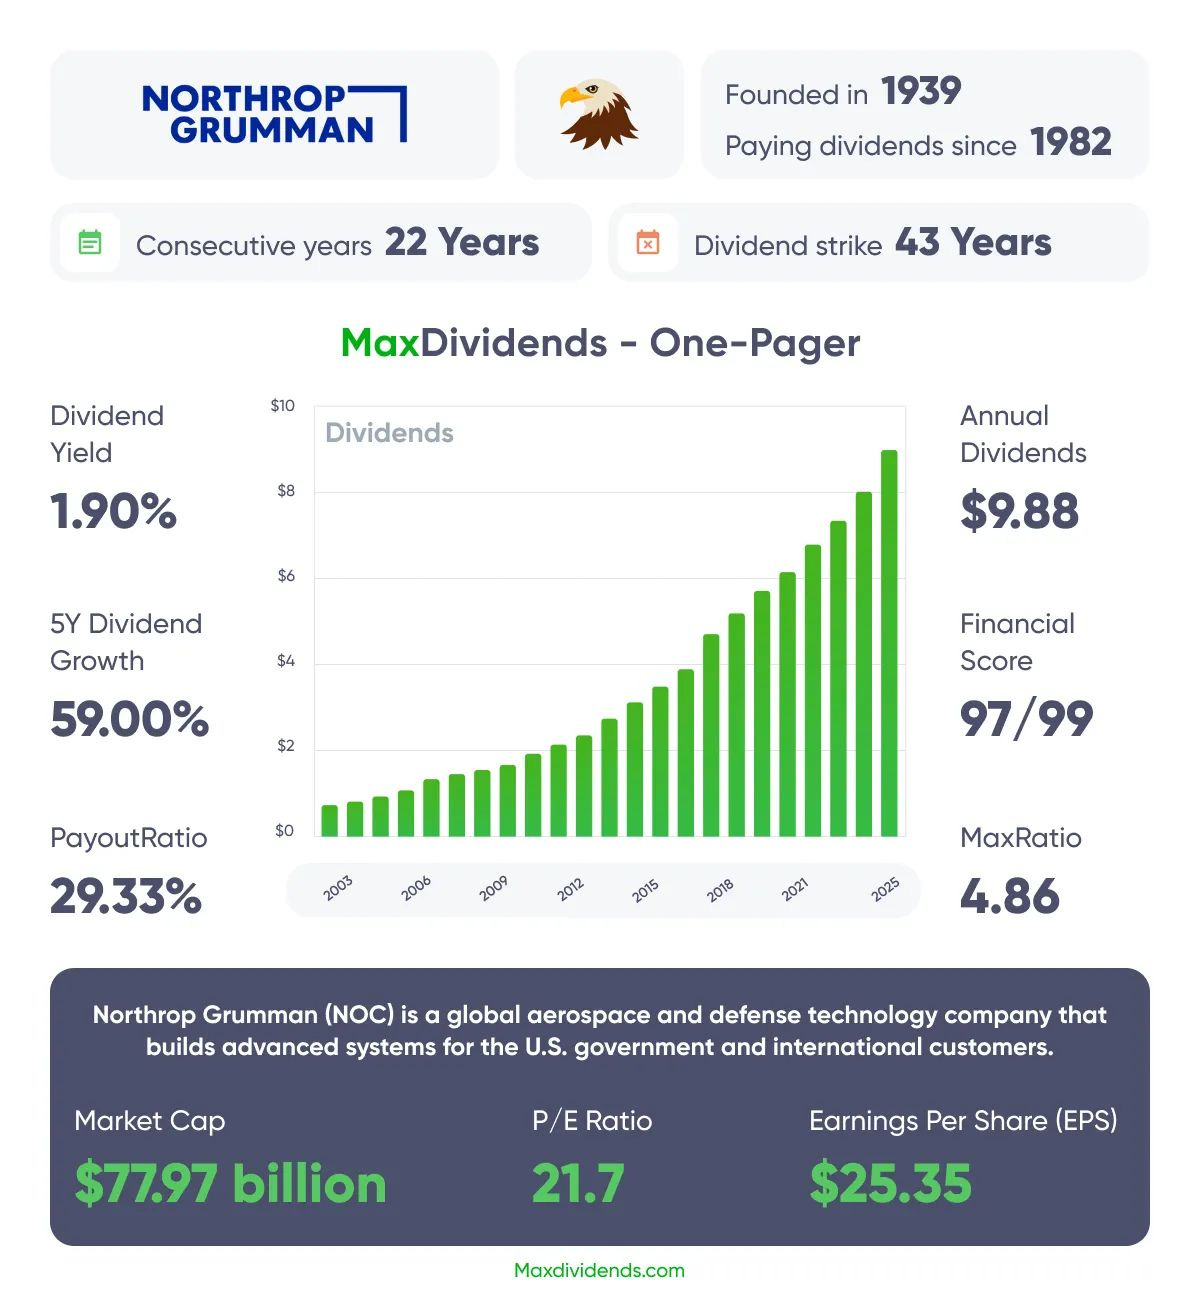
A Proven Dividend Eagle 🦅
15+ consecutive years of dividend increases
Northrop Grumman Corporation (NOC) in its current form was created in 1994, when Northrop Corporation merged with Grumman Corporation — two major U.S. aerospace and defense companies with long histories in military aviation and aircraft manufacturing .
After the merger, the company rapidly expanded through a series of major acquisitions that shaped its modern structure. One of the most important steps came in 2001, when Northrop Grumman acquired Litton Industries, significantly strengthening its position in defense electronics, shipbuilding, and government technology systems . In the same year, the company also restructured under a new holding company and continued integrating large defense and aerospace businesses, laying the foundation for its role as a top-tier global defense contractor.
Later, in 2002, Northrop Grumman acquired TRW Inc., further expanding into space systems, sensors, and advanced mission technologies, which helped establish the company’s strong presence in both defense and space industries today.
The Most Notable Dividend Increases of the Quarter
Nordson Corporation (NDSN) — Dividend Increase: +14.63%
62 consecutive years of rising dividends
Nordson develops precision dispensing, fluid management, and other highly engineered technologies used across electronics, medical, industrial, and consumer applications. Its systems often perform highly specialized functions within customers’ production processes, creating sticky relationships and attractive competitive positions.
The company combines exposure to long-term growth markets with a diversified portfolio of niche technologies. Its focus on mission-critical applications, disciplined acquisitions, and strong profitability has helped Nordson generate the cash flow required to consistently reinvest in the business while returning capital to shareholders.
The latest increase lifts the quarterly dividend from $0.82 to $0.94 per share, up 14.63%. That is an unusually strong increase for a company with such a mature dividend record — and it extends Nordson’s remarkable streak to 62 consecutive years of rising dividends.
American States Water Company (AWR) — Dividend Increase: +8.23%
71 consecutive years of rising dividends
American States Water is a regulated utility primarily providing water services to communities in California, while also operating contracted water and wastewater systems for U.S. military installations. Water is one of the most essential services in the economy, giving the business an unusually defensive demand profile.
Its regulated operations provide relatively predictable revenue and cash-flow characteristics, while long-term infrastructure investment supports gradual expansion of the company’s rate base. That combination has allowed American States Water to build one of the most extraordinary dividend records in the U.S. market.
The latest increase takes the quarterly dividend from approximately $0.504 to $0.546 per share, up 8.23%. Even more impressive is the longevity behind it: 71 consecutive years of dividend increases, making American States Water one of the longest-running dividend growth companies in the market.
Illinois Tool Works (ITW) — Dividend Increase: +6.83%
55 consecutive years of rising dividends
Illinois Tool Works is a diversified industrial company operating across automotive, food equipment, welding, construction products, polymers, specialty products, and other industrial markets. Its decentralized operating structure allows individual businesses to remain focused on highly specialized customer needs while benefiting from the resources of a global organization.
ITW has built its reputation around operational discipline, strong margins, and a highly focused portfolio of businesses with differentiated products and customer relationships. This model has produced durable cash generation across economic cycles and supported decades of consistent shareholder returns.
The latest dividend increase raises the quarterly payout from $1.61 to $1.72 per share, up 6.83%. With a Business Quality Score and Dividend Score of 98, the increase extends an already exceptional record to 55 consecutive years of rising dividends.
Altria Group (MO) — Dividend Increase: +4.72%
61 dividend increases over the past 57 years
Altria is one of the largest tobacco companies in the U.S., anchored by Marlboro and complemented by a growing portfolio of smoke-free nicotine products. Its powerful brands, pricing strength, and highly recurring consumer demand have historically supported substantial cash generation.
The traditional cigarette business is mature and declining in volume, but Altria’s pricing power and relatively low capital requirements continue to generate significant cash for shareholders. The dividend remains a central part of the company’s capital allocation strategy and one of the defining characteristics of the investment case.
The latest increase lifts the quarterly dividend from $1.06 to $1.11 per share, up 4.72%. More importantly, it represents Altria’s 61st dividend increase in the past 57 years — an extraordinary record of shareholder income growth spanning more than half a century.
McDonald’s Corporation (MCD) — Dividend Increase: +3.76%
50 consecutive years of rising dividends
McDonald’s is one of the world’s largest restaurant companies, operating and franchising restaurants across more than 100 countries. Its globally recognized brand, enormous scale, and predominantly franchised business model create a highly resilient stream of royalty and rental income.
The franchise model is central to the company’s economics. Franchisees provide much of the capital required to operate restaurants, while McDonald’s benefits from recurring fees tied to restaurant sales. Combined with its global footprint, real estate advantages, and tremendous brand recognition, this has helped create one of the most durable consumer businesses in the market.
The latest increase takes the quarterly dividend from $1.86 to $1.93 per share, up 3.76%. More importantly, it marks 50 consecutive years of dividend growth — a major milestone that places McDonald’s among the rare group of companies that have increased shareholder income for five full decades.
The Most Solid Recent Dividend Hikes
Bank of America Corporation (BAC) +14.29%
The Bank of New York Mellon Corp. (BNY) +18.87%
Community Trust Bancorp, Inc. (CTBI) +22.64%
Howmet Aerospace Inc. (HWM) +16.67%
Lithia Motors, Inc. (LAD) +22.81%
The PNC Financial Services Group (PNC) +17.65%
Lam Research Corporation (LRCX) +26.92%
Intuit Inc. (INTU) +15.00%
Cboe Global Markets, Inc. (CBOE) +19.44%
Chemed Corporation (CHE) +16.67%
StepStone Group Inc. (STEP) +17.86%
Dividend Macro Highlights: Global Dividend Trends
The macro report is updated quarterly
Global: Latest Dividend Data
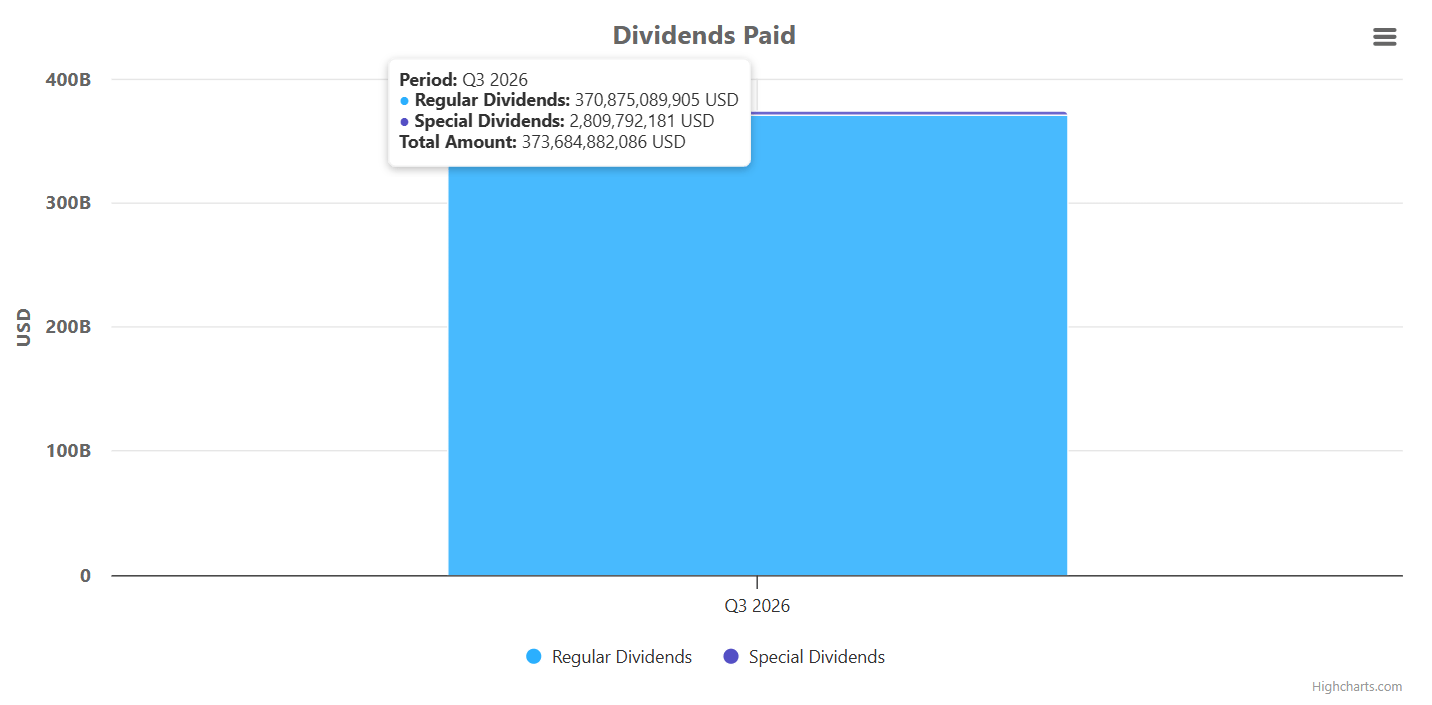
The global cumulative dividend payout for Q3 2026 reached approximately $373.7 billion, demonstrating that global corporate distributions remain at a strong level. Of this total, roughly $370.9 billion came from regular dividends, while special dividends contributed just $2.8 billion.
Source: maxdividends.com by BeatMarket
The overwhelming share of regular payments highlights the underlying stability of global dividend flows, with distributions driven primarily by recurring corporate cash generation rather than one-time special payouts.
Global Total Quarterly Dividend Payments (US$ Billions)
Global dividend payments through Q3 2026 show a strong cumulative increase in distributions over the course of the year. Total payouts rose from approximately $386 billion in Q1 to around $1.01 trillion by Q2, reaching nearly $1.38 trillion on a cumulative basis by Q3 2026.
Regular dividends remain overwhelmingly responsible for this growth. By the end of Q3, cumulative regular distributions had reached approximately $1.35 trillion, while special dividends contributed only about $36.5 billion. This means recurring payments account for more than 97% of all global dividends paid so far in 2026.
The relatively small contribution from special dividends highlights the underlying quality of the payout trend. Rather than being driven by exceptional one-time distributions, the vast majority of shareholder income continues to come from regular dividends supported by ongoing corporate cash generation.
Overall, the 2026 trend points to a resilient global dividend environment. With cumulative distributions approaching $1.4 trillion through the first three quarters, and regular dividends dominating the payout mix, global companies continue to return substantial and recurring cash to shareholders (Figure 1).
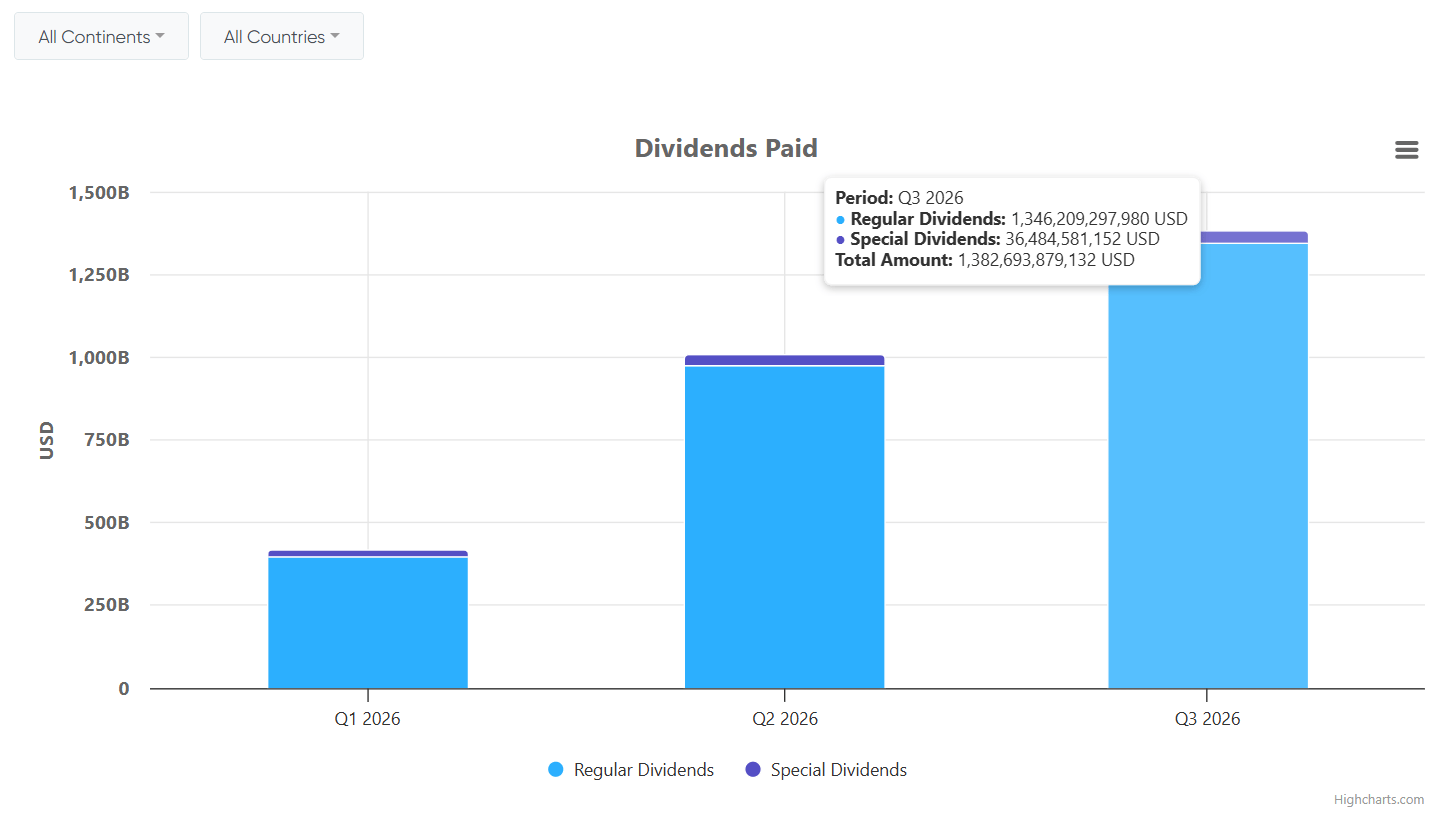
Figure 1: Global Total Quarterly Dividend Payments (US$ Billions), TTM. Source: maxdividends.com by BeatMarket
Global Dividend Breakdown — Q3-Q4 2026
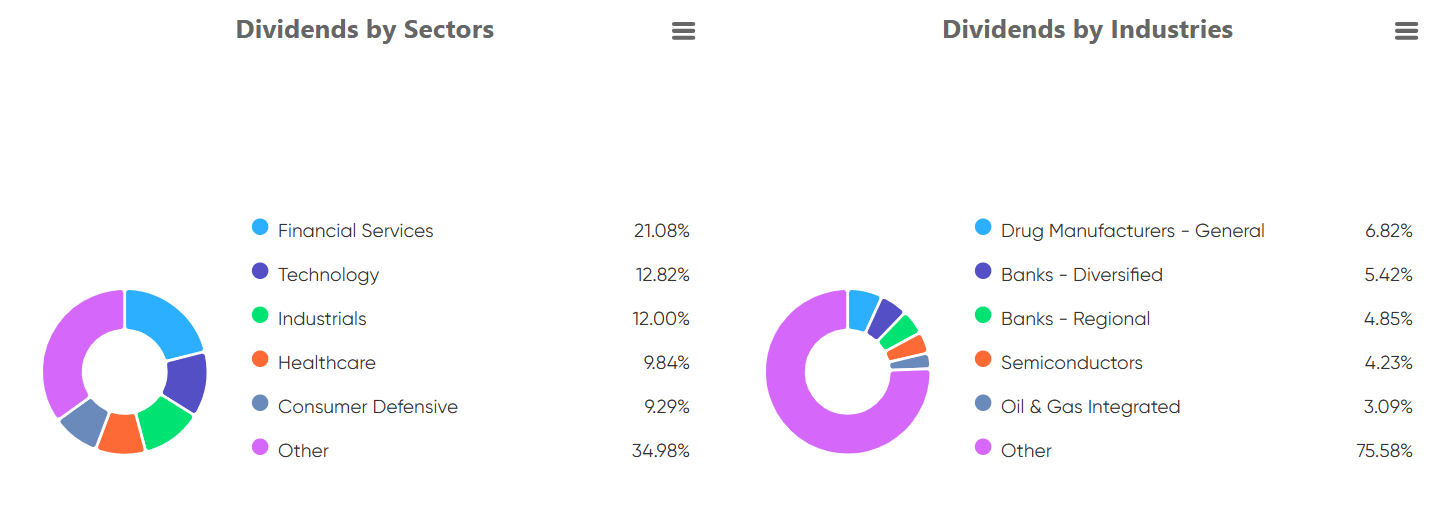
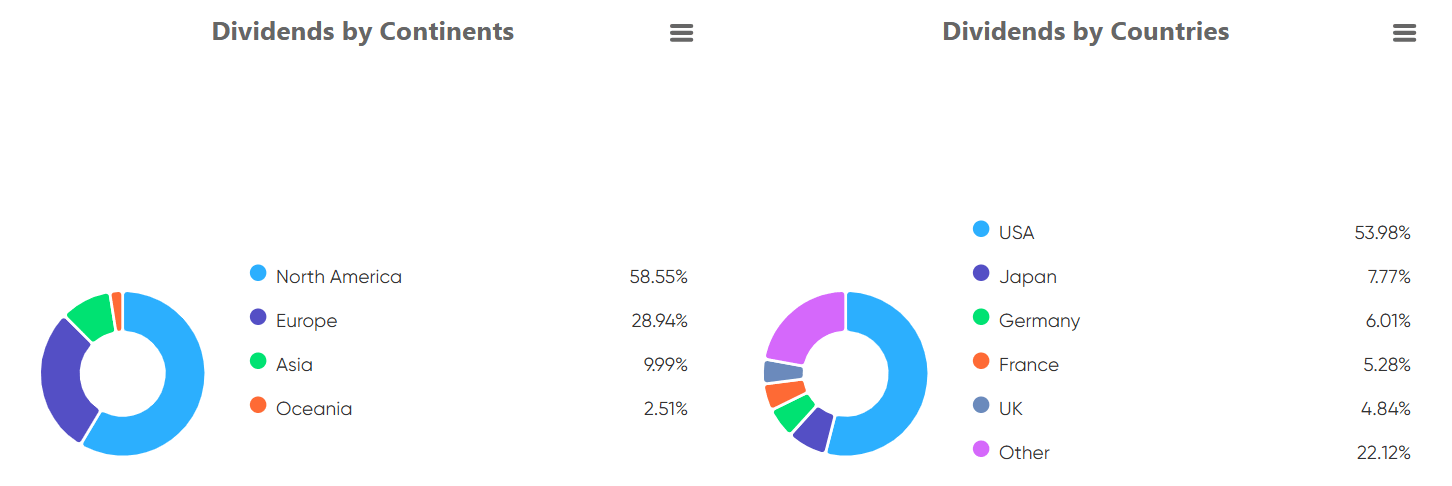
These charts show how global dividend payments have been distributed across sectors, industries, continents, and countries based on year-to-date data for the first quarter of 2026.
Source: beatmarket.com & maxdividends.com
Source: beatmarket.com & maxdividends.com
Financial Services continue to lead all sectors, accounting for 21.08% of total global dividend payouts. Technology follows at 12.82%, while Industrials contribute 12.00%. Healthcare represents 9.84%, with Consumer Defensive close behind at 9.29%. The 34.98% “Other” category continues to highlight the broad diversification of dividend-paying businesses across the global economy.
At the industry level, Drug Manufacturers remain the largest identifiable group at 6.82%. Diversified Banks account for 5.42%, followed by Regional Banks at 4.85% and Semiconductors at 4.23%. Oil & Gas Integrated companies contribute 3.09%, while the sizable 75.58% “Other” segment underscores just how widely global dividend payments are distributed across individual industries.
Geographically, North America remains dominant, accounting for 58.55% of total payouts. Europe represents a substantial 28.94%, while Asia contributes 9.99%. Oceania remains the smallest major geographic contributor at 2.51%.
By country, the United States continues to lead by a wide margin, representing 53.98% of global dividend payments. Japan follows at 7.77%, with Germany at 6.01%, France at 5.28%, and the UK at 4.84%. The remaining 22.12% is distributed across other countries, reflecting a meaningful level of geographic diversification beyond the largest dividend-paying markets.
Overall, the latest 2026 data shows Financial Services maintaining their leadership position, while Technology and Industrials provide another strong layer of global dividend generation. North America remains the largest source of payouts, but Europe now represents nearly 29% of the total, highlighting a broader geographic contribution to global shareholder income. At the same time, the large “Other” share across sectors, industries, and countries reinforces the diversified nature of global dividend generation.
U.S. Dividend Landscape
The chart shows total dividend payments by U.S. companies during the first three quarters of 2026, including a breakdown between regular and special distributions.
U.S. dividend payments remained strong through Q3 2026, reaching approximately $239.2 billion for the quarter. Of this amount, $238.5 billion came from regular dividends, while special dividends contributed just $697 million — less than 0.3% of total distributions.
The quarterly trend also highlights the consistency of U.S. dividend payments. Following approximately $237 billion in Q1 and $245 billion in Q2, total distributions remained close to $240 billion in Q3. Despite some fluctuations between quarters, the overall level of shareholder income has remained remarkably stable throughout 2026.
One particularly interesting development is the shrinking contribution of special dividends. While one-time distributions were more noticeable earlier in the year, they represented only a tiny fraction of Q3 payments. Regular dividends accounted for approximately 99.7% of the quarter’s total, reinforcing the importance of recurring distributions in the U.S. dividend landscape.
Overall, the first three quarters of 2026 paint a picture of a resilient dividend-paying market. For long-term income investors, the key takeaway is the continued strength and consistency of regular corporate distributions, which remain the foundation of sustainable dividend income.
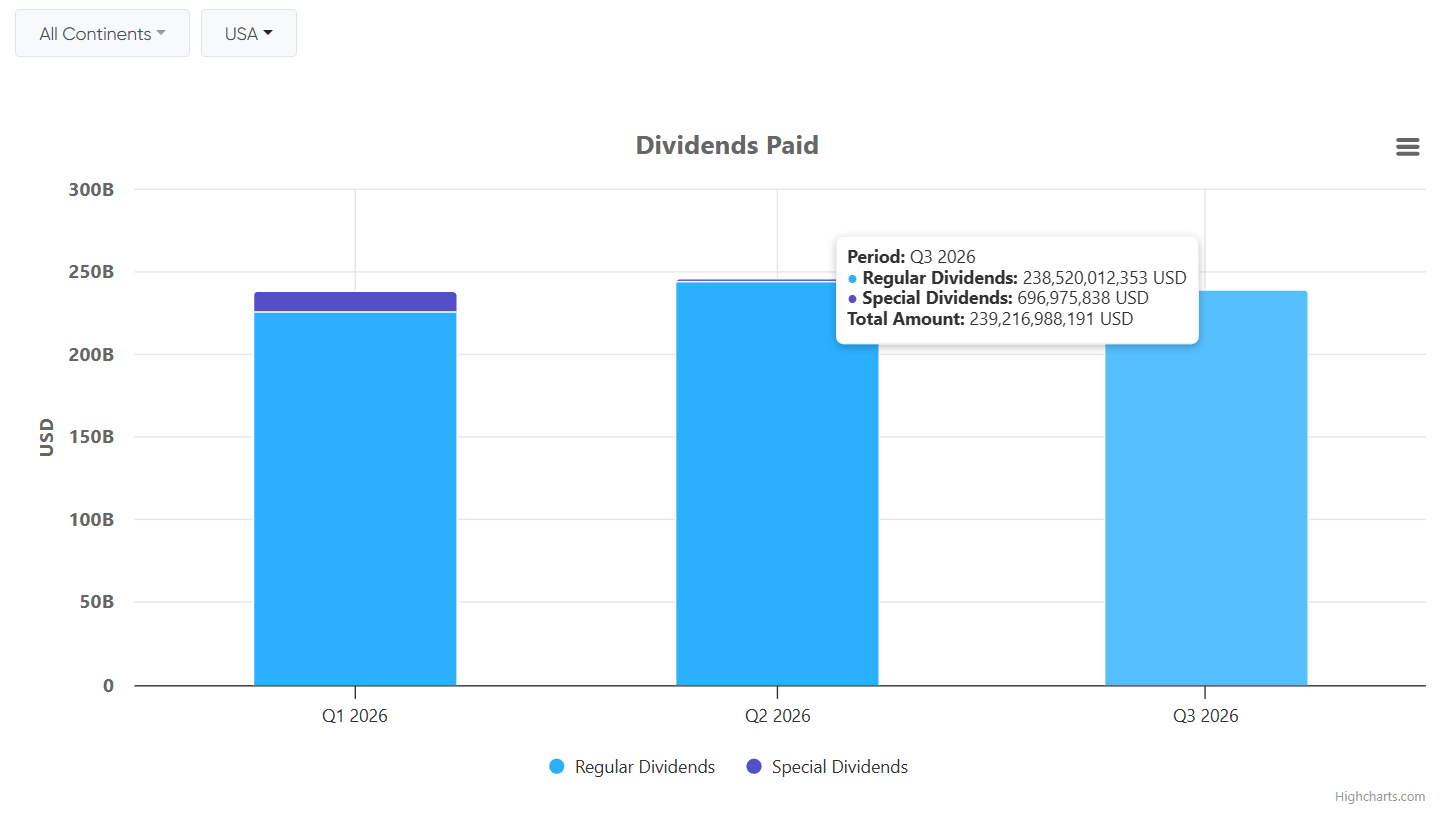
U.S. quarterly dividend payments, Q1–Q3 2026, including regular and special dividends. Source: beatmarket.com
U.S. Dividend Breakdown — Q2-Q3 2026
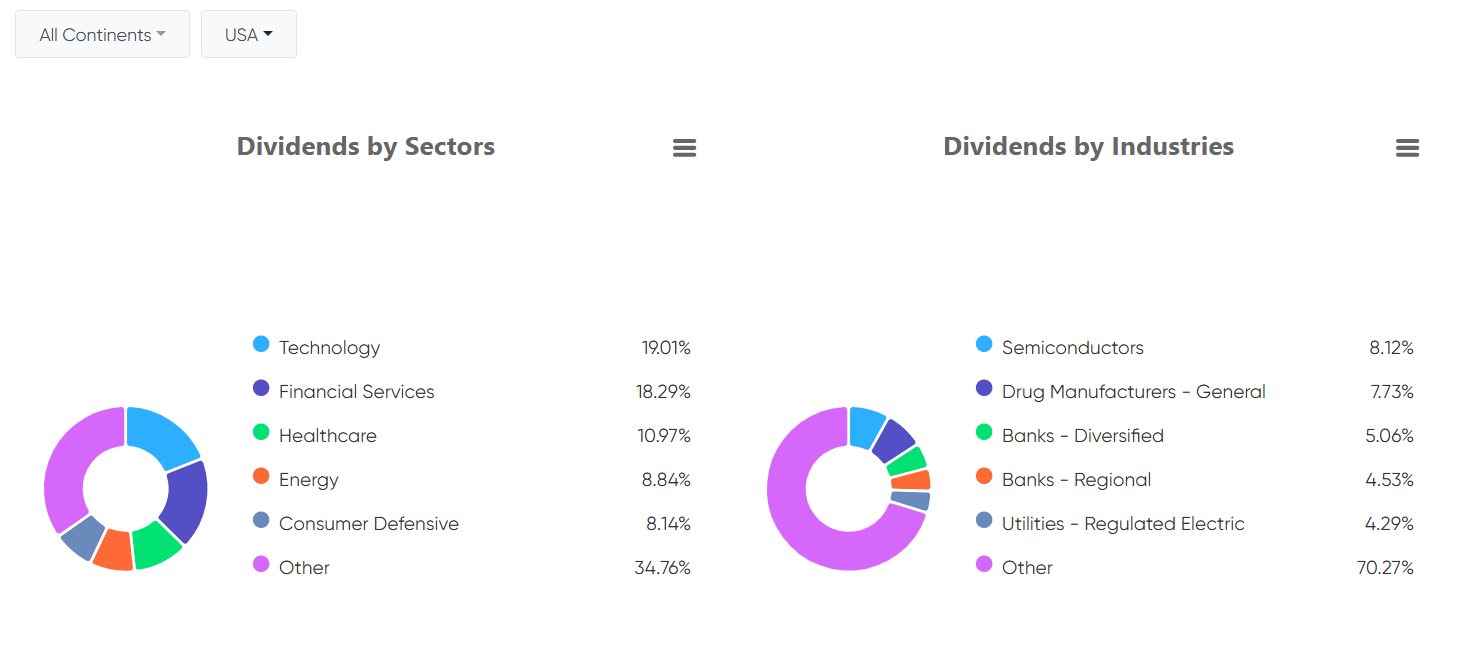
These charts show how dividend payments in the U.S. market are distributed across sectors and industries, based on the latest data covering Q2–Q3 2026.
Source: beatmarket.com & maxdividends.com
Technology has moved into the leading position among U.S. dividend-paying sectors, accounting for 19.01% of total distributions, narrowly ahead of Financial Services at 18.29%. Healthcare follows at 10.97%, while Energy contributes 8.84% and Consumer Defensive represents 8.14%. The remaining 34.76% falls into the “Other” category, highlighting the broad range of sectors contributing to shareholder income across the U.S. economy.
At the industry level, Semiconductors lead with 8.12% of total dividend payments, followed closely by Drug Manufacturers at 7.73%. Diversified Banks contribute 5.06%, Regional Banks account for 4.53%, and Regulated Electric Utilities represent 4.29%. The substantial 70.27% “Other” category demonstrates how widely dividend distributions are spread across individual industries, well beyond the largest contributors.
One notable development is the growing prominence of Technology in the U.S. dividend landscape. With Technology now slightly ahead of Financial Services and Semiconductors leading the industry breakdown, the data highlights the increasingly important role of technology businesses in generating shareholder income.
Overall, the Q2–Q3 2026 figures reveal a broadly diversified U.S. dividend market, with Technology and Financial Services leading distributions, supported by Healthcare, Energy, and a wide variety of other industries. This diversity remains an important characteristic of the American dividend-paying landscape.
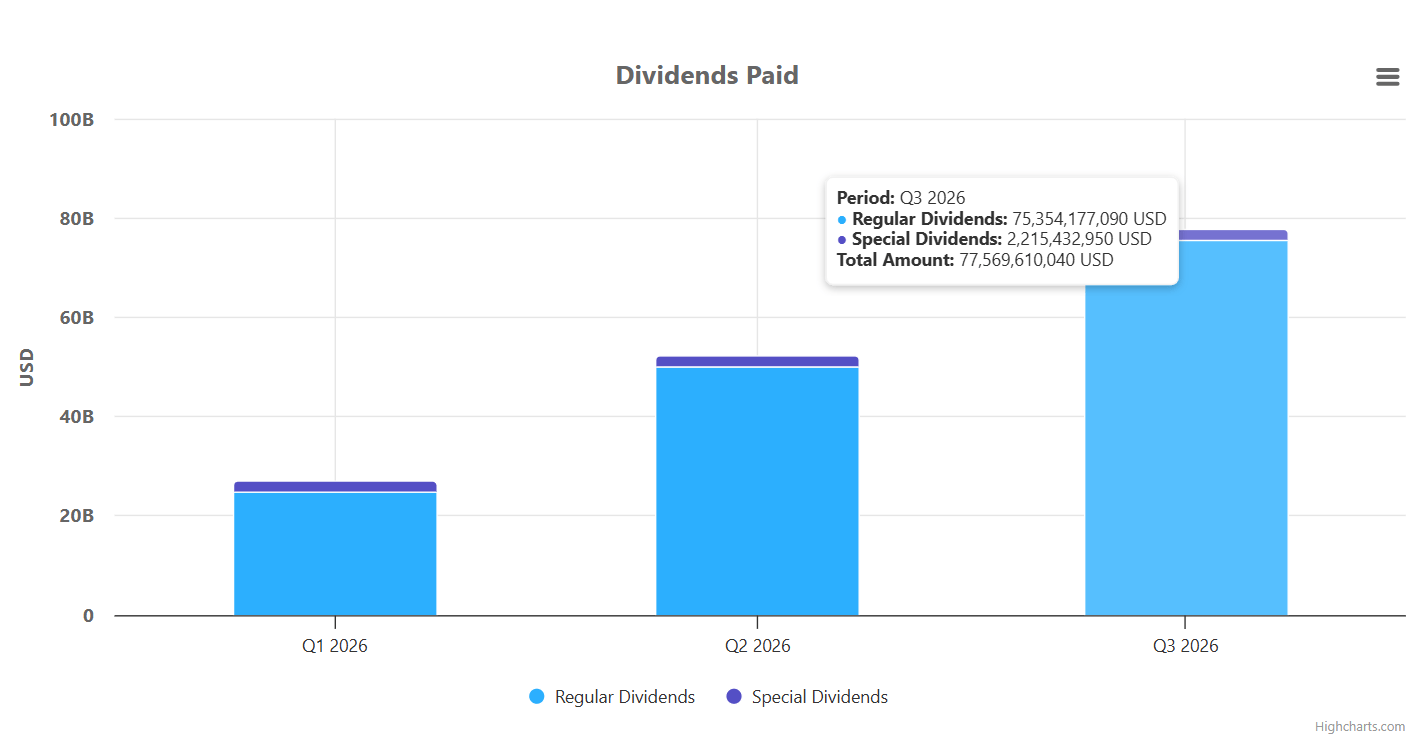
Cumulative dividends paid by US Dividend Eagles in Q3 2026
Dividend Eagles — companies with 15+ consecutive years of dividend growth — continued to deliver substantial cash distributions in the third quarter of 2026.
In Q3 2026, cumulative dividends paid by Dividend Eagles reached approximately $77.57 billion, including $75.35 billion in regular dividends and $2.22 billion in special dividends.
Regular dividends accounted for approximately 97% of total distributions, highlighting the dominant role of recurring payments. Special dividends contributed around 3%, providing additional income beyond regular payouts.
The data also shows a steady increase in recorded distributions across the first three quarters of 2026, with Q3 reaching the highest level so far.
The continued dominance of regular dividends reinforces the importance of consistent, recurring cash distributions among long-term dividend growth companies.
Source: beatmarket.com & maxdividends.com
Proof That Dividend Eagles Deliver, Year After Year
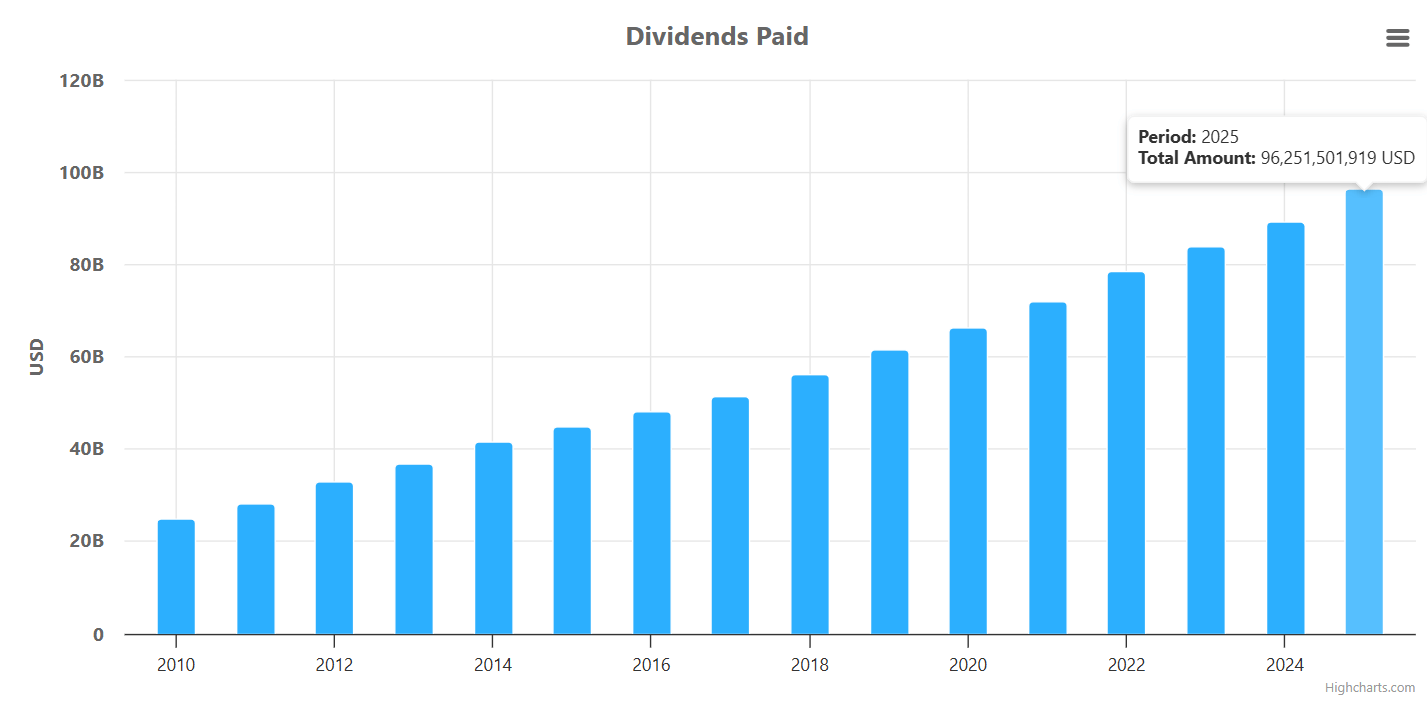
Over the past 15 years, U.S. Dividend Eagles — companies with 15+ consecutive years of dividend increases — have demonstrated remarkable consistency in growing the total cash returned to shareholders.
Annual dividend payouts increased from approximately $25 billion in 2010 to $96.25 billion in 2025, representing nearly a fourfold increase over the period.
The chart shows uninterrupted annual growth in total distributions across the entire 15-year period, including the COVID-19 pandemic, periods of high inflation, and changing interest-rate environments.
This long-term trend highlights the ability of Dividend Eagles to consistently expand their collective dividend payouts across different economic cycles, reinforcing the importance of dividend growth as a foundation for long-term income investing.
Source: beatmarket.com
📊 This chart makes the MaxDividends concept crystal clear: when you own businesses that keep paying dividends and raising them year after year, your income has the potential to grow substantially over time. From $25 billion to more than $96 billion in annual payouts — that’s the power of consistent dividend growth in action.
Average Dividend Yield of Dividend Eagles, Q3 2026
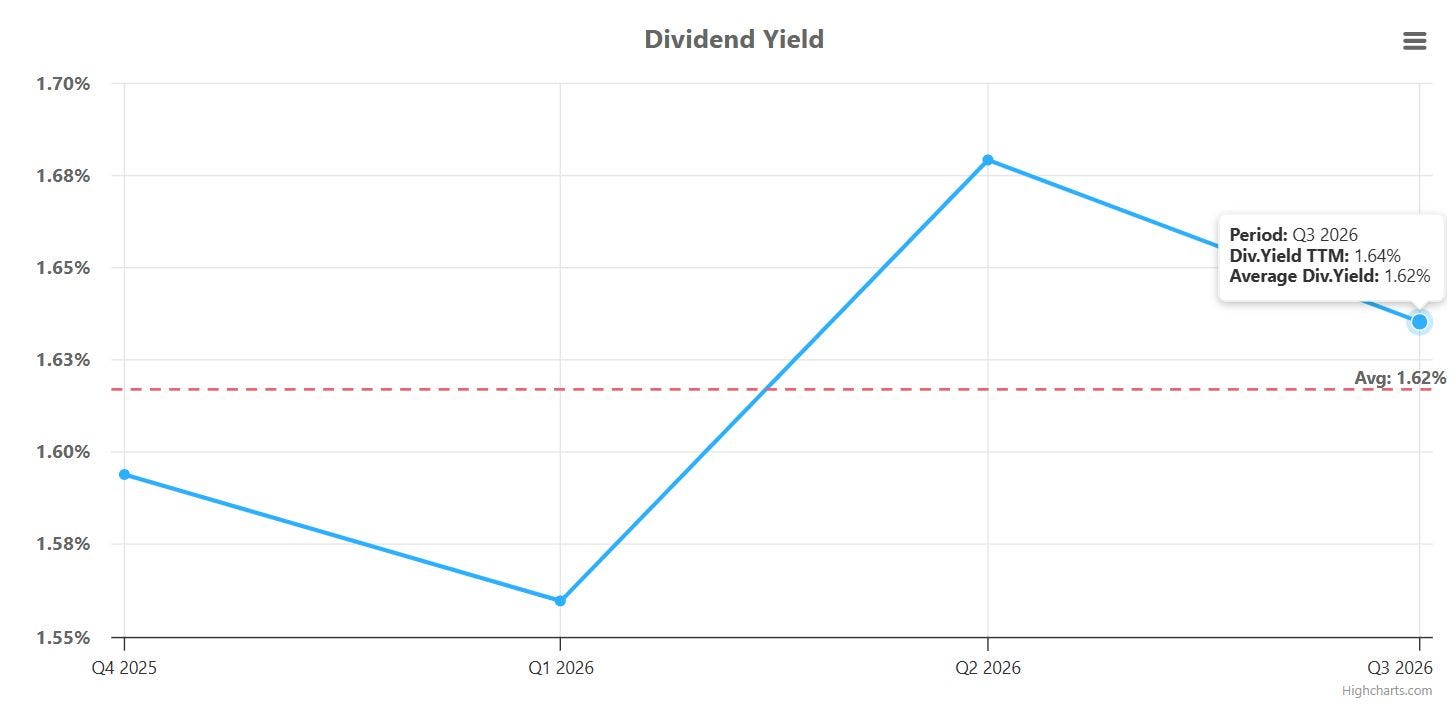
The average dividend yield of Dividend Eagles has remained within a relatively narrow range over the past four quarters, reflecting changes in market valuations and the relationship between share prices and dividend payments.
The yield stood at approximately 1.59% in Q4 2025, before declining to around 1.56% in Q1 2026, the lowest point in the period. A recovery followed in Q2, when the yield climbed to approximately 1.68%, before moderating to 1.64% in Q3 2026.
The latest reading remains slightly above the period’s average dividend yield of 1.62%, suggesting that current income yields are broadly in line with recent historical levels. Despite quarterly fluctuations, the overall range has remained relatively tight, with a difference of just 0.12 percentage points between the highest and lowest readings.
For dividend investors, this stability highlights an important distinction between dividend income and market pricing. While yields naturally fluctuate as share prices and distributions change, the relatively narrow range suggests that the income profile of Dividend Eagles has remained broadly consistent over the observed period.
Source: beatmarket.com & maxdividends.com
🥇 Top 5 Dividend Eagles by Total Payouts (Q3 2026)
These are the heavyweights — the Dividend Eagles returning the most cash to shareholders so far in 2026:
Microsoft (MSFT) — 💰 $27.65B
Johnson & Johnson (JNJ) — 💰 $9.67B
Abbott Laboratories (ABT) — 💰 $4.40B
Accenture (ACN) — 💰 $4.08B
Visa (V) — 💰 $3.97B
📊 Together, these five companies have distributed approximately $49.77 billion in dividends in 2026 year-to-date, highlighting the enormous scale of shareholder distributions generated by some of America’s most established dividend-growing businesses.
Microsoft stands out particularly strongly, accounting for more than half of the total payouts among these five companies. Meanwhile, the presence of healthcare leaders, a global consulting business, and a payments network illustrates how substantial dividend income can come from very different industries.
And that’s exactly what the Dividend Eagles List is all about. 🦅 It’s our curated lineup of 100+ U.S.-listed companies with 15+ consecutive years of dividend increases — businesses with established records of rewarding shareholders through growing cash distributions.
👉 The full, always-updated Dividend Eagles List is available inside the MaxDividends Research Platform — exclusive to our community.
U.S. Dividend Landscape - (S&P 500)
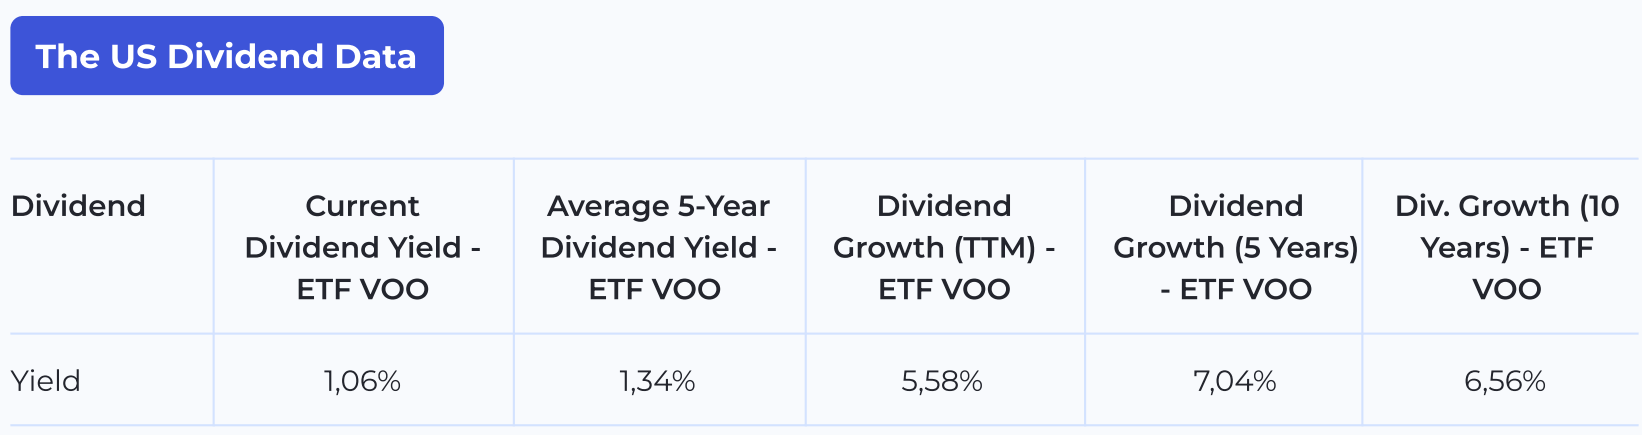
Table 1. Q3’26. Overall performance. Source: maxdividends.com
S&P 500 Dividend Yield — Historical Perspective
The S&P 500 dividend yield has declined to just 1.04%, reaching one of the lowest levels in more than a century of market history. Even compared with the late 1990s, today’s yield looks exceptionally compressed, reflecting elevated valuations and the significant influence of lower-yielding companies on the index.
Historically, dividend yields frequently ranged between 3% and 5%. Yet today’s market presents an interesting paradox: while the index suggests expensive valuations and limited income opportunities, many individual high-quality dividend-paying companies continue to trade at reasonable valuations.
The late 1990s offer an intriguing parallel, when enthusiasm surrounding internet companies created similar market distortions. History never repeats itself exactly, but certain patterns can look remarkably familiar. For dividend investors, this reinforces the importance of looking beyond index averages and evaluating individual businesses (Figure 3).
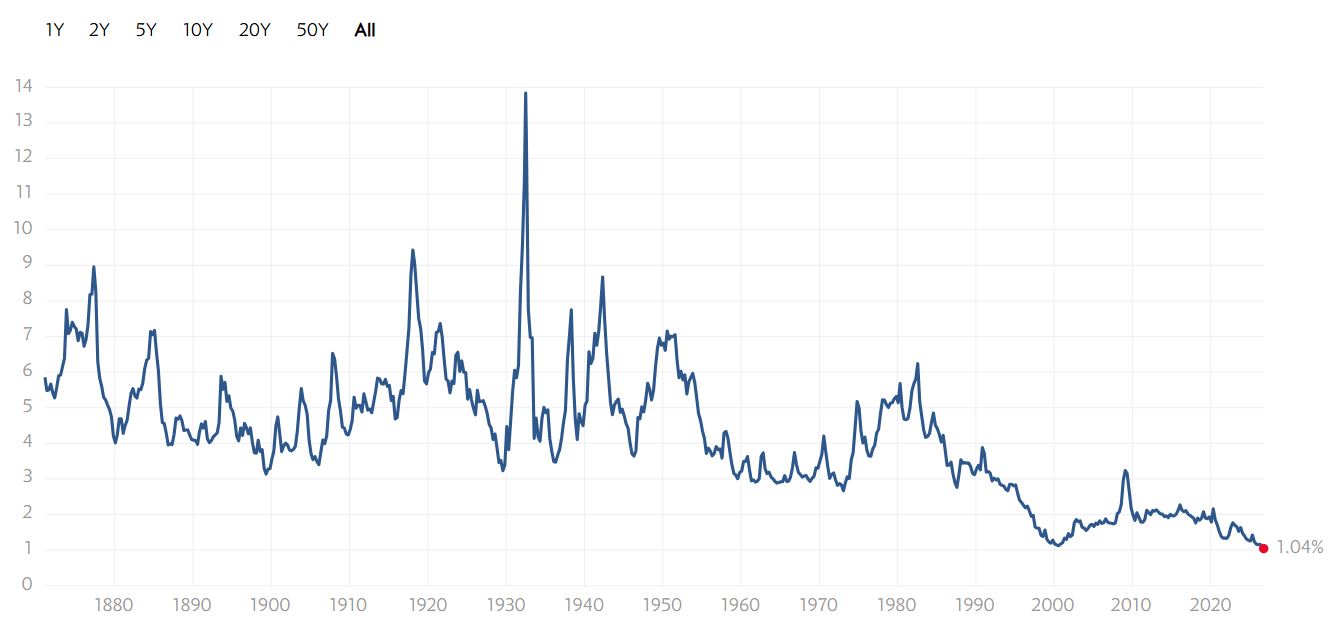
Figure 3: Dividend Yield of the S&P 500. Source: multpl.com
S&P 500 Historical Dividend Trends
Inflation-adjusted dividends for the S&P 500 continue their long-term upward trajectory, reaching a new historical high of 81.69. Despite numerous economic cycles, recessions, and periods of market volatility, the underlying trend in real dividend payments has remained remarkably resilient.
The latest reading represents an increase of approximately 3.1% from the previously reported level of 79.21, extending the index’s record of long-term dividend growth. This continued progress highlights the ability of major U.S. companies to expand shareholder distributions over time, even after accounting for inflation.
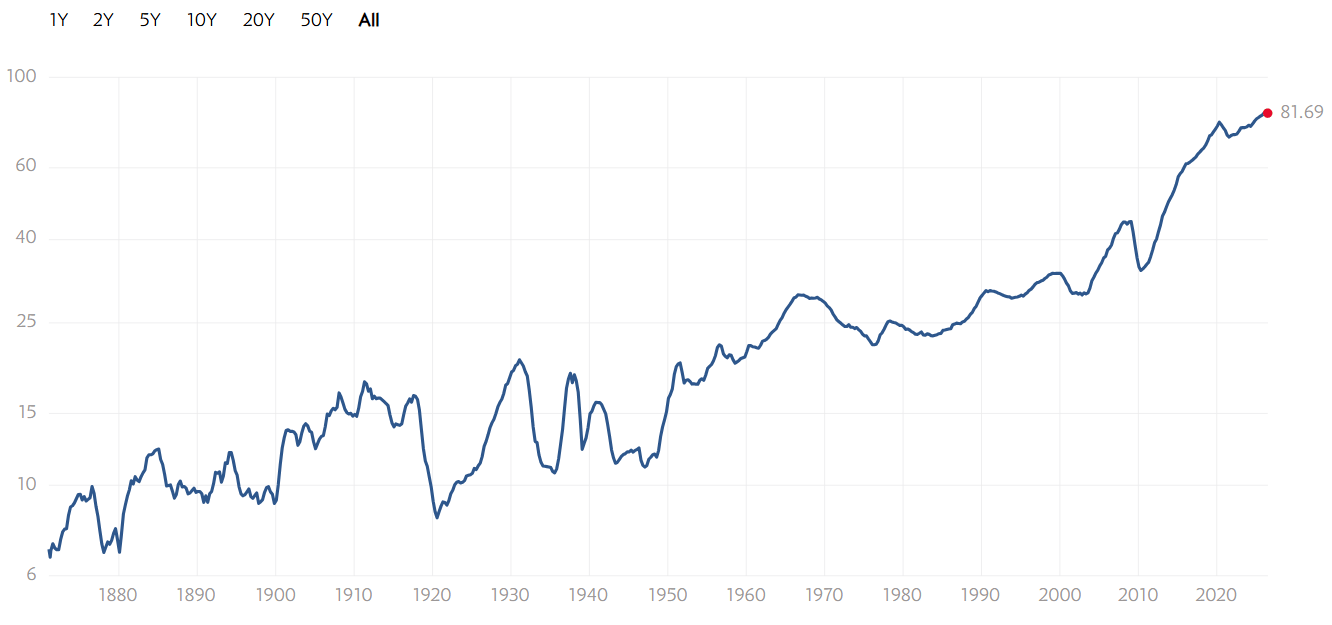
Figure 5: S&P 500 Dividends Adjusted for Inflation. Source: multpl.com

Table 2: S&P 500 Dividends Adjusted for Inflation. Last 12 Months. Source: maxdividends.com
S&P 500 Dividend Growth
The S&P 500 continues to demonstrate a resilient long-term dividend growth trend. Over the past several decades, periods of declining dividends have been relatively rare, generally coinciding with major economic disruptions such as the 2008 financial crisis and the COVID-19 pandemic.
The latest reading stands at 5.46%, reflecting a moderate but positive pace of dividend growth. Although below the double-digit growth rates observed during stronger expansion periods, the current level suggests that dividend payments across the index continue to increase at a healthy pace.
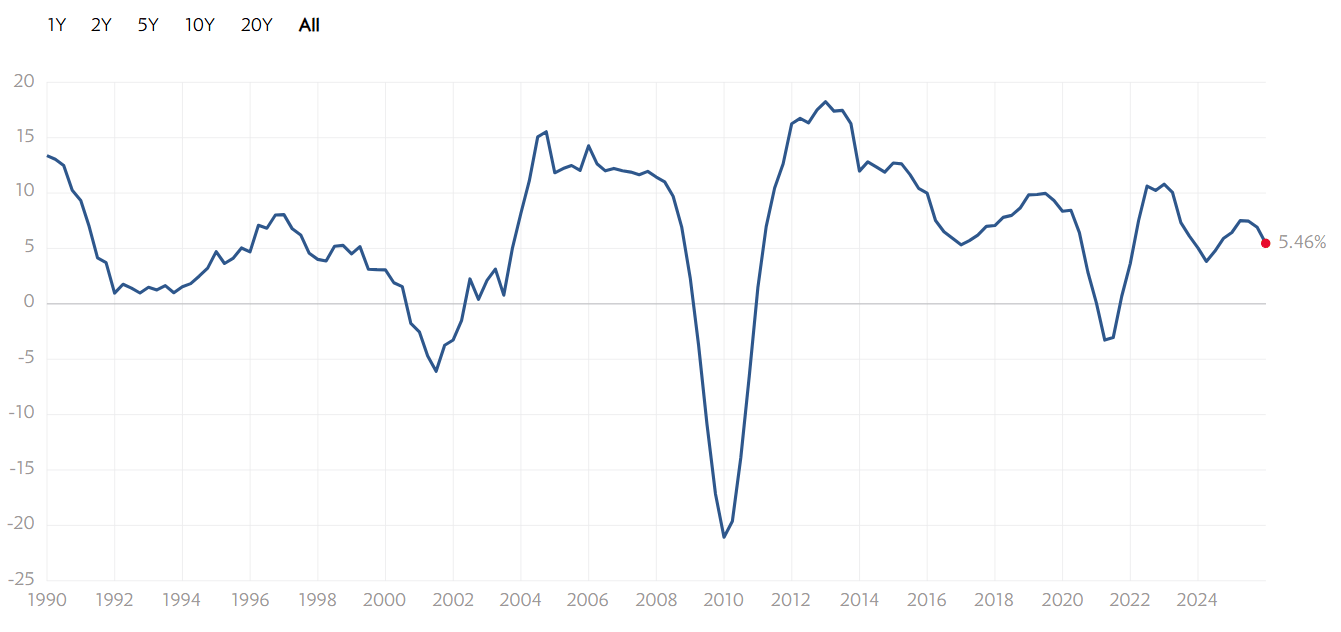
Figure 6: S&P 500 Dividend Growth. Source: multpl.com
Despite fluctuations in the rate of growth, the broader historical trend remains positive. For long-term income investors, this highlights the importance of focusing not only on current dividend yields but also on the ability of businesses to consistently increase shareholder distributions over time.
Inflation’s Impact on Dividends
Inflationary pressures intensified significantly during the first half of 2026, creating additional challenges for the purchasing power of dividend income. After a relatively stable period near 2.4% at the beginning of the year, inflation accelerated sharply through the spring.
The inflation rate climbed to 3.3% in March, increased further to 3.8% in April, and reached 4.2% in May 2026. This marked a substantial acceleration compared with the more moderate inflation levels observed throughout much of 2025.
More recent data, however, suggests some easing of these pressures. Inflation declined to 3.5% in June and reached 3.4% in August 2026, indicating a moderation from the May peak, although price growth remains elevated compared with the beginning of the year.
For dividend investors, persistent inflation continues to challenge real income growth. Even as companies increase nominal dividend payments, higher consumer prices can offset part of those gains, reinforcing the importance of businesses capable of growing distributions faster than inflation over time.
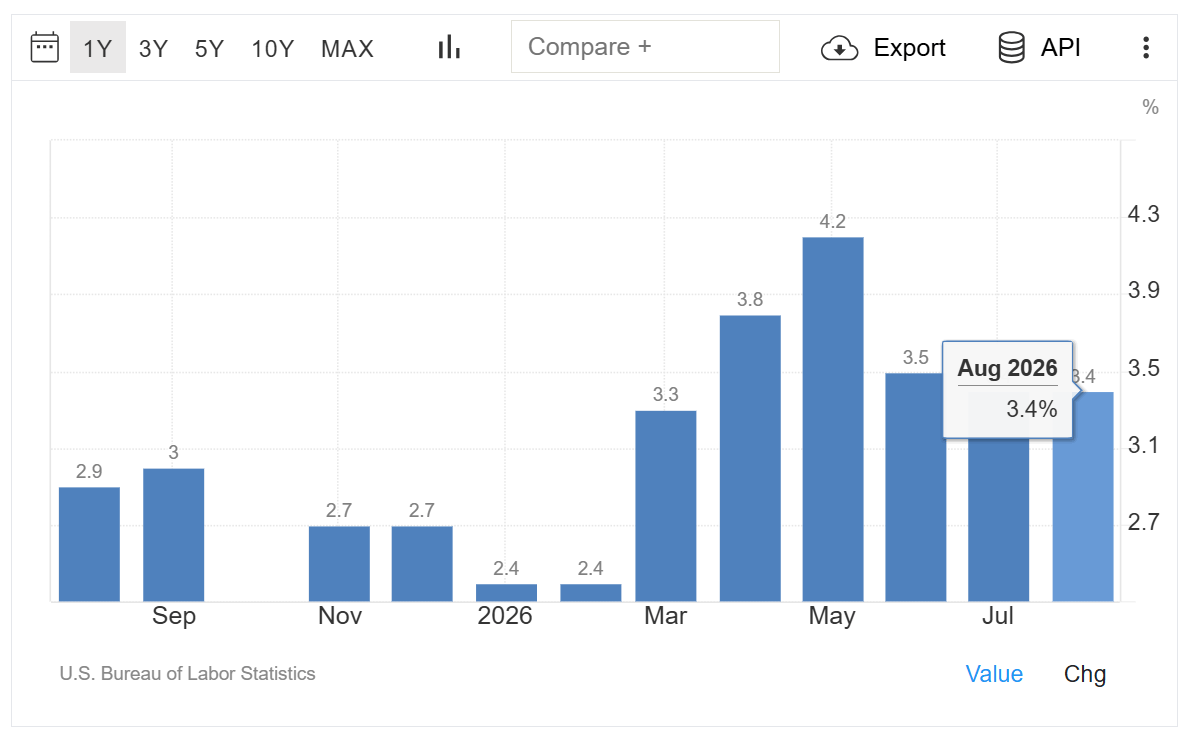
Figure 4: Inflation in the United States. Source: tradingeconomics.com
For your convenience, we have prepared a PDF version of the Dividend Macro Overview. You can download and review it at any time.
Like, share, and repost to spread the dividend mindset!
🎁 Bonus!
Inside, you’ll find 5 outstanding dividend stock ideas, fresh market trends, macro insights, and real-world plans to grow your income — all crafted by the MaxDividends team.
Happy dividends for all the holders!
— MaxDividends Team & Max
The top five table is the part I'd sit with. $49.77B out of roughly $97.74B YTD means five names carry about half of the Eagles' cash, and Microsoft alone is close to 28%. So the smooth 15-year payout line is partly a Microsoft line. I'd be curious what that chart looks like with MSFT stripped out, or equal-weighted. That says more about the other 95 or so.