


The MaxDividends Macro Report is your quarterly deep dive into global dividend trends — packed with data, insights, and analysis from the most dividend-focused team and community in the world.
💬 Like, share, and repost to spread the dividend mindset!
Hey Dividend Investors!
Our latest MaxDividends Macro Report — Q2 2026 is here, and it’s loaded with sharp, data-driven insights to keep your income strategy moving upward.
Each week, we track thousands of dividend-paying companies across global markets — studying trends, running the numbers, and cutting through the noise so you don’t have to. Every chart, metric, and signal you see here comes from hours of careful analysis by the MaxDividends team.
And the mission behind all that work stays the same: helping you build a dividend income stream that’s reliable today and growing for years ahead.
We’re the most dividend-focused community on Earth — and you’re right in the heart of it.
The MaxDividends Macro Report
Inside: 5 Outstanding Dividend Stock Ideas
Dividend Eagles: 3 Top-Performing Dividend Stocks of the Quarter
Updated Dividend Eagles Top Stocks List
The Most Notable Dividend Increases
Dividend Macro Highlights:
Global Dividend Trends
US Dividend Trends
The new MaxDividends PDF Macro Report is a must-see for every dividend investor.
🎁 Bonus!
Inside, you’ll find 5 outstanding dividend stock ideas, fresh market trends, macro insights, and real-world plans to grow your income — all crafted by the MaxDividends team.
We’re sharing it today with the entire community so everyone can see just how powerful these reports are — packed with value, guidance, and data worth far more than a couple cups of coffee. Trends, top lists, strategies, support, insights — and of course, the app that ties it all together.
Dividend Eagles Deliver ~$35.04B in Dividends YTD
3 Top-Performing Dividend Eagles of Q1 2026
The "Dividend Eagles List" comprises approximately 100 of the most reliable dividend-paying companies in the U.S. market, each boasting over 15 consecutive years of increasing dividends.
These companies have been meticulously selected based on stringent criteria established by the MaxDividends team.
🥉 +32.64% AMAT — Applied Materials Inc
Powering the Backbone of the Digital Age
Applied Materials is one of the world’s leading suppliers of semiconductor manufacturing equipment — the highly specialized machines used to produce chips that power everything from smartphones and data centers to AI systems and electric vehicles. Without companies like AMAT, the modern digital economy simply wouldn’t function.
Founded in 1967 and headquartered in California, Applied Materials operates at the core of the semiconductor supply chain. Its technologies are deeply embedded in fabrication processes, making switching costs extremely high for customers. As chip complexity increases, so does reliance on AMAT’s precision tools — reinforcing long-term demand and pricing power.
This positioning translates into strong cash flow generation across cycles, even in a volatile semiconductor market. Combined with disciplined capital allocation and a steadily growing dividend, Applied Materials offers exposure to one of the most critical industries of the future — with income steadily compounding along the way.
🥈 +34.85% LMAT — LeMaitre Vascular Inc
Precision Tools for Life-Saving Procedures
LeMaitre Vascular develops and manufactures medical devices used in the treatment of vascular disease — including products for bypass surgery, vessel repair, and blood flow restoration. These are specialized tools used by surgeons in critical, often life-saving procedures.
Founded in 1983 and based in Massachusetts, the company focuses on a niche segment of the medical device market with a highly targeted product portfolio. Its strategy emphasizes direct sales relationships with hospitals and surgeons, which strengthens customer loyalty and supports consistent demand.
This focused, high-margin business model generates reliable free cash flow with relatively low capital intensity. LeMaitre has built a reputation for steady dividend growth, supported by recurring procedure-driven demand — making it a quiet compounder in the healthcare space.
🥇 +35.87% GRC — The Gorman-Rupp Company
Pumps That Keep the Real World Moving
Gorman-Rupp manufactures pumps and pumping systems used in water, wastewater, industrial processing, construction, and municipal infrastructure. When water needs to move — in cities, plants, or industrial sites — reliability is everything.
Founded in 1933 and headquartered in Ohio, the company focuses on engineered products built for durability and mission-critical environments. Municipal and industrial clients value long service life and proven performance — which supports recurring demand and long customer relationships.
That practical, infrastructure-anchored business model produces steady operating cash flow and supports a long track record of dividend increases. It’s not flashy — but it’s exactly the kind of essential industrial backbone that keeps income compounding quietly in the background.
Dividend One-Pager of the Quarter
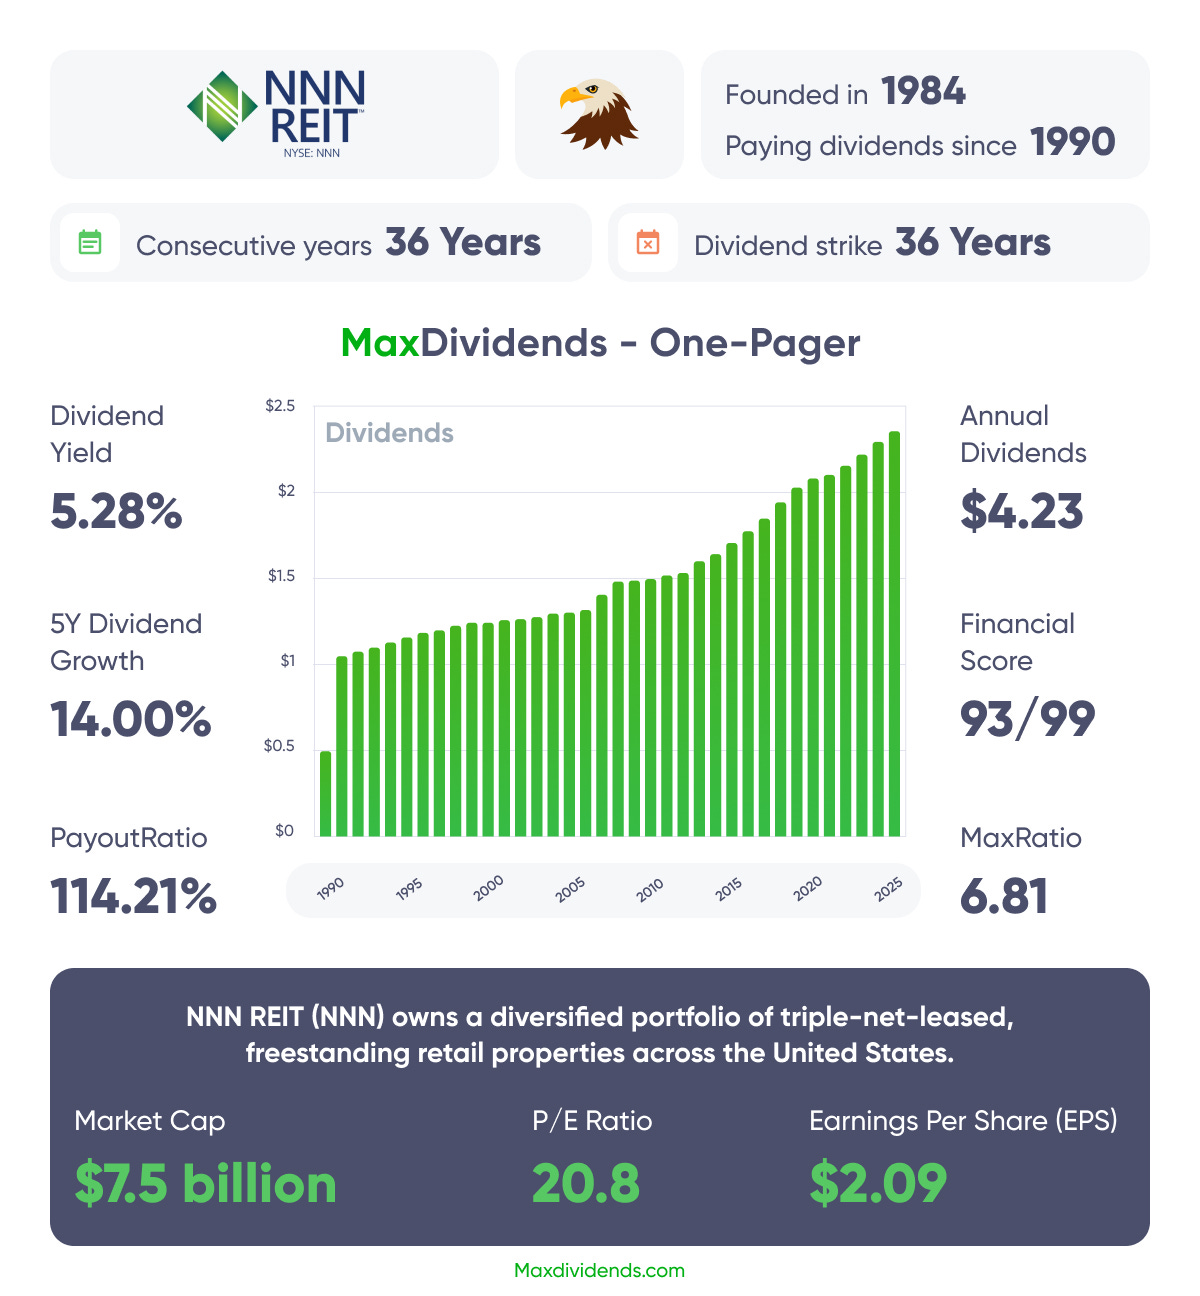
A Proven Dividend Eagle 🦅
15+ consecutive years of dividend increases
One of the defining features of NNN REIT appeal is its remarkably consistent dividend record. The company has paid uninterrupted quarterly dividends since going public in 1984 — a track record that spans four decades. Even more impressive, NNN has increased its annual dividend for 36 consecutive years (as of 2025), placing it among a very small group of REITs with such longevity.
In 2025, the company raised its quarterly dividend to $0.60 per share, continuing its steady pattern of annual increases. The growth isn’t flashy or aggressive — and that’s exactly the point. NNN focuses on sustainable increases backed by predictable rental income and long-term net leases.
If you want to dive deeper, the full list of all Dividend Eagles — with up-to-date analytics, financial scores, valuations, streaks, payout metrics, and every data point you need — is available inside the MaxDividends App for all partners right here:
👉 the full list of all Dividend Eagles
This is where you can explore every Eagle in detail, compare quality, screen for opportunities, and build a portfolio with true long-term horsepower.
And now, let’s get into the good part — a hand-picked set of dividend ideas worth your attention this month, selected for reliability, growth, and real income-producing strength. Let’s dive in.
Top 10 Dividend Growth Leaders

The Most Notable Dividend Increases of the Quarter
Colgate-Palmolive (CL) — Dividend Increase: +1.9%
60+ consecutive years of rising dividends
Colgate-Palmolive is a global consumer staples company focused on everyday essentials — oral care, personal hygiene, and household products. Its brands are present in homes worldwide, with products used daily regardless of economic conditions. This is not discretionary spending — it’s routine consumption.
The company operates a highly resilient model built on brand strength, global distribution, and repeat purchase behavior. With leading market share in categories like toothpaste, Colgate benefits from pricing power and consistent demand across both developed and emerging markets.
The 1.9% dividend increase extends one of the longest dividend growth streaks in the market. While growth may be modest, it reflects stability — supported by reliable cash flow and a business model designed to perform through any cycle.
Linde (LIN) — Dividend Increase: +7%
30+ consecutive years of rising dividends
Linde is the world’s largest industrial gas company, supplying oxygen, nitrogen, hydrogen, and specialty gases used across manufacturing, healthcare, energy, and electronics. These gases are critical inputs — not optional — in a wide range of industrial processes.
Its business model is built on long-term contracts, on-site production, and high switching costs. Customers integrate Linde’s infrastructure directly into their operations, creating stable, recurring revenue streams and strong visibility into future cash flows.
The 7% dividend increase highlights the strength of this model. With predictable earnings and disciplined capital allocation, Linde continues to deliver steady dividend growth backed by durable industrial demand.
Coca-Cola (KO) — Dividend Increase: +3.9%
60+ consecutive years of rising dividends
Coca-Cola is one of the most recognized beverage companies in the world, with a portfolio spanning soft drinks, water, juices, and ready-to-drink beverages. Its products are consumed billions of times per day across nearly every country.
The company operates an asset-light model supported by a global bottling network, strong brand equity, and unmatched distribution scale. Demand is driven by habit and brand loyalty — not economic cycles — which creates consistent revenue and margin stability.
The 3.9% dividend increase continues Coca-Cola’s decades-long track record of returning capital to shareholders. It reflects dependable cash generation and a business designed to steadily compound income over time.
PepsiCo (PEP) — Dividend Increase: +4%
50+ consecutive years of rising dividends
PepsiCo is a global food and beverage leader, combining iconic drink brands with a dominant snack portfolio. Its products — from soft drinks to chips and packaged foods — are staples in households and retail channels worldwide.
Unlike pure beverage companies, PepsiCo benefits from diversification across categories, which stabilizes revenue and reduces reliance on any single segment. Its scale, distribution strength, and pricing power support consistent performance across economic environments.
The 4% dividend increase reinforces PepsiCo’s long-standing commitment to shareholder returns. Backed by strong free cash flow and a balanced business model, the company continues to deliver reliable income growth year after year.
Chevron (CVX) — Dividend Increase: +4.1%
35+ consecutive years of rising dividends
Chevron is one of the world’s leading integrated energy companies, involved in oil and gas exploration, production, refining, and distribution. Energy demand underpins the global economy — from transportation to manufacturing and power generation.
While commodity prices can be volatile, Chevron’s scale, asset quality, and disciplined capital spending provide resilience across cycles. The company focuses on maintaining a strong balance sheet and generating free cash flow even in lower price environments.
The 4.1% dividend increase signals continued confidence in its long-term cash generation. Chevron has built a reputation for protecting and growing its dividend through cycles — making it a cornerstone income play in the energy sector.
The Most Solid Recent Dividend Hikes
Booz Allen Hamilton Holding (BAH) +10.34%
Bank of Botetourt (BORT) +16.27%
Cincinnati Financial Corporation (CINF) +12.31%
East West Bancorp (EWBC) +15.33%
First Business Financial Services (FBIZ) +14.47%
Graham Holdings Company (GHC) +14.49%
The Goldman Sachs Group (GS) +13.89%
Tompkins Financial Corporation (TMP) +13.56%
Dividend Macro Highlights: Global Dividend Trends
The macro report is updated quarterly
Global: Latest Dividend Data
The global cumulative dividend payout for Q1 2026 indicates that elevated distribution levels have been sustained into the new year. Total dividends reached approximately $386 billion for the quarter, reflecting continued strength in global corporate cash returns.
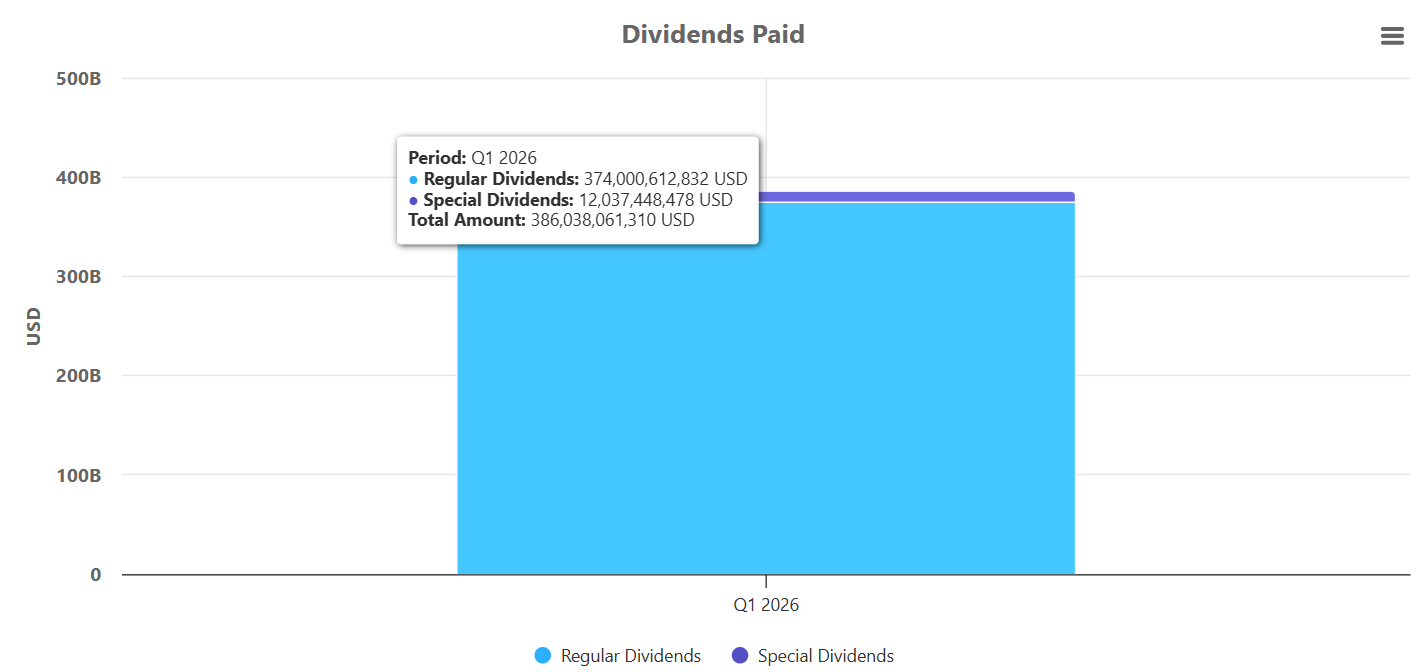
This level of payouts suggests that dividend activity remains firmly supported by recurring operating cash flows rather than one-time special distributions. The consistency of quarterly payments at this scale points to resilient corporate earnings and a stable foundation for ongoing shareholder returns as 2026 begins.
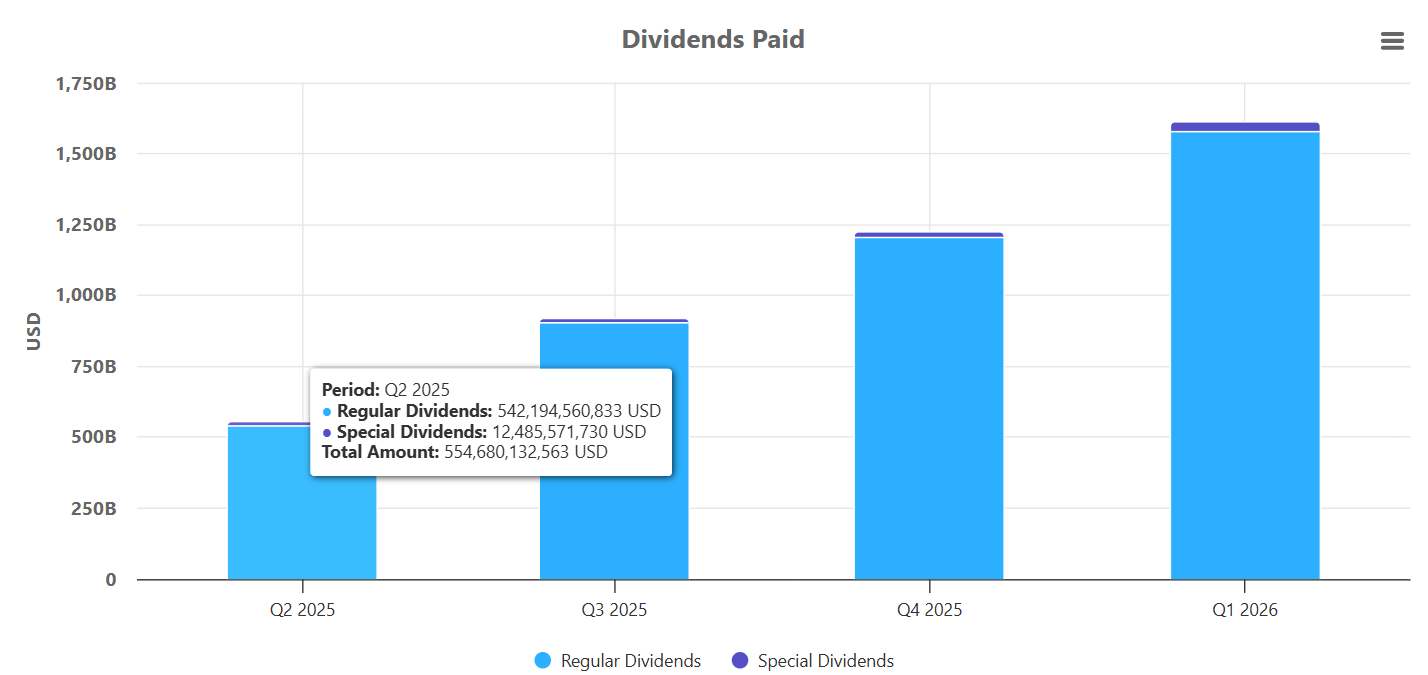
Global Total Quarterly Dividend Payments (US$ Billions)
Global dividend payments over the last four quarters (Q2 2025 through Q1 2026) show a clear upward progression in total distributions. Payouts increased from approximately $555 billion in Q2 2025 to nearly $1.6 trillion on a cumulative basis by Q1 2026, reflecting sustained strength in global shareholder returns.
Quarterly flows accelerated through the second half of 2025, with particularly strong contributions from regular dividends. While Q2 still included a noticeable portion of special distributions, their impact diminished in subsequent quarters, leading to a cleaner, more stable payout structure.
By Q4 2025 and into Q1 2026, dividend composition became overwhelmingly driven by regular payments, with special dividends contributing only marginally. This transition signals a shift away from one-time balance-sheet actions toward income supported by recurring operating performance.
Overall, the TTM trend highlights both growth and improving quality of global dividend flows. Rising payout levels combined with the dominance of regular dividends reinforce the durability of corporate cash generation as companies move further into 2026 (Figure 1).
Global Dividend Breakdown — Q1 2026
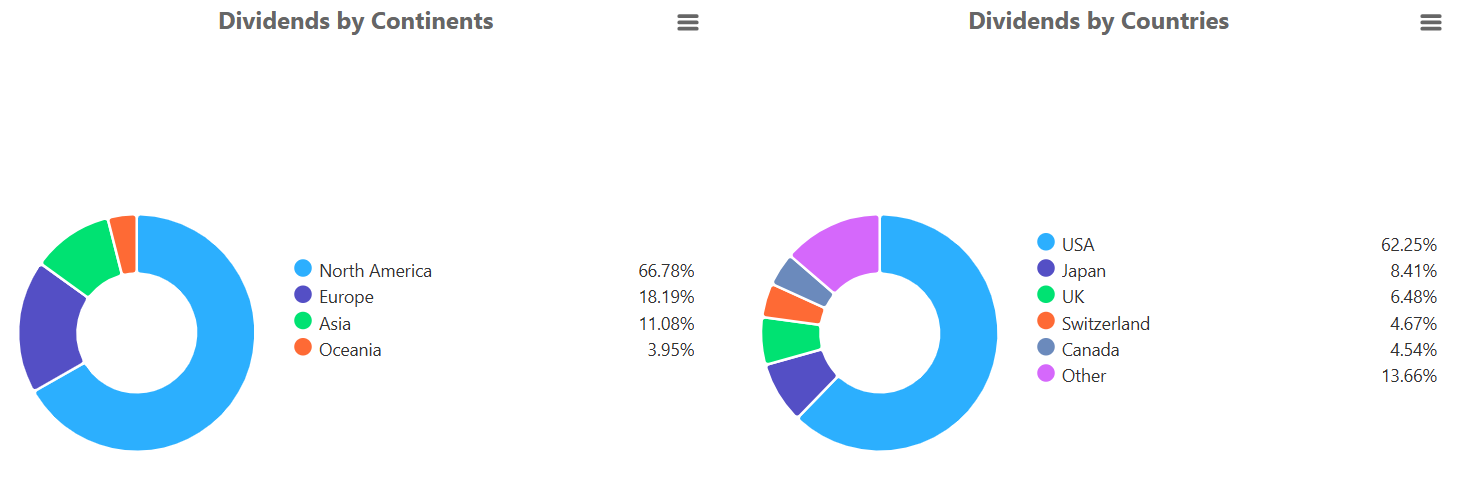
These charts show how global dividend payments have been distributed across sectors, industries, continents, and countries based on year-to-date data for the first quarter of 2026.
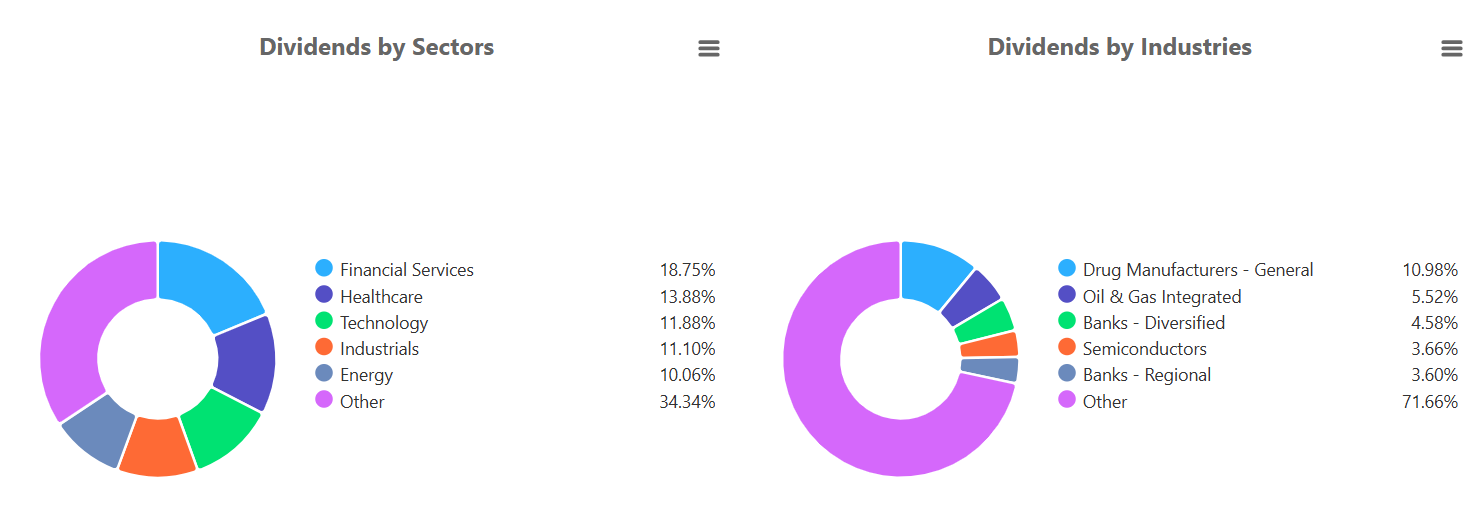
Financial Services currently lead all sectors, accounting for 18.75% of total global dividend payouts. Healthcare follows at 13.88%, while Technology (11.88%) and Industrials (11.10%) form a strong middle tier of contributors. Energy represents 10.06%, slightly lower than in prior periods, while the 34.34% “Other” category continues to highlight the broad diversification of dividend-paying businesses across the global economy.
At the industry level, Drug Manufacturers represent the largest identifiable group at 10.98%. Oil & Gas Integrated companies contribute 5.52%, while Diversified Banks account for 4.58%. Semiconductors (3.66%) and Regional Banks (3.60%) remain notable contributors. The sizable 71.66% “Other” segment once again underscores the wide dispersion of dividend payments across industries.
Geographically, North America remains dominant, accounting for 66.78% of total payouts. Europe contributes 18.19%, while Asia represents 11.08%. Oceania, at 3.95%, remains a smaller but visible contributor in the global mix.
By country, the United States leads with 62.25% of total dividend payments in Q1 2026 year-to-date. Japan follows at 8.41%, with the UK at 6.48% and Switzerland at 4.67%. Canada contributes 4.54%, while the remaining 13.66% is distributed across other countries.
Overall, the first-quarter data for 2026 reflects a more balanced sector composition compared to prior periods, with financials and healthcare taking the lead, while geographic concentration in North America remains significant. At the same time, the high share of “Other” across sectors and industries continues to emphasize the broad and diversified nature of global dividend generation.
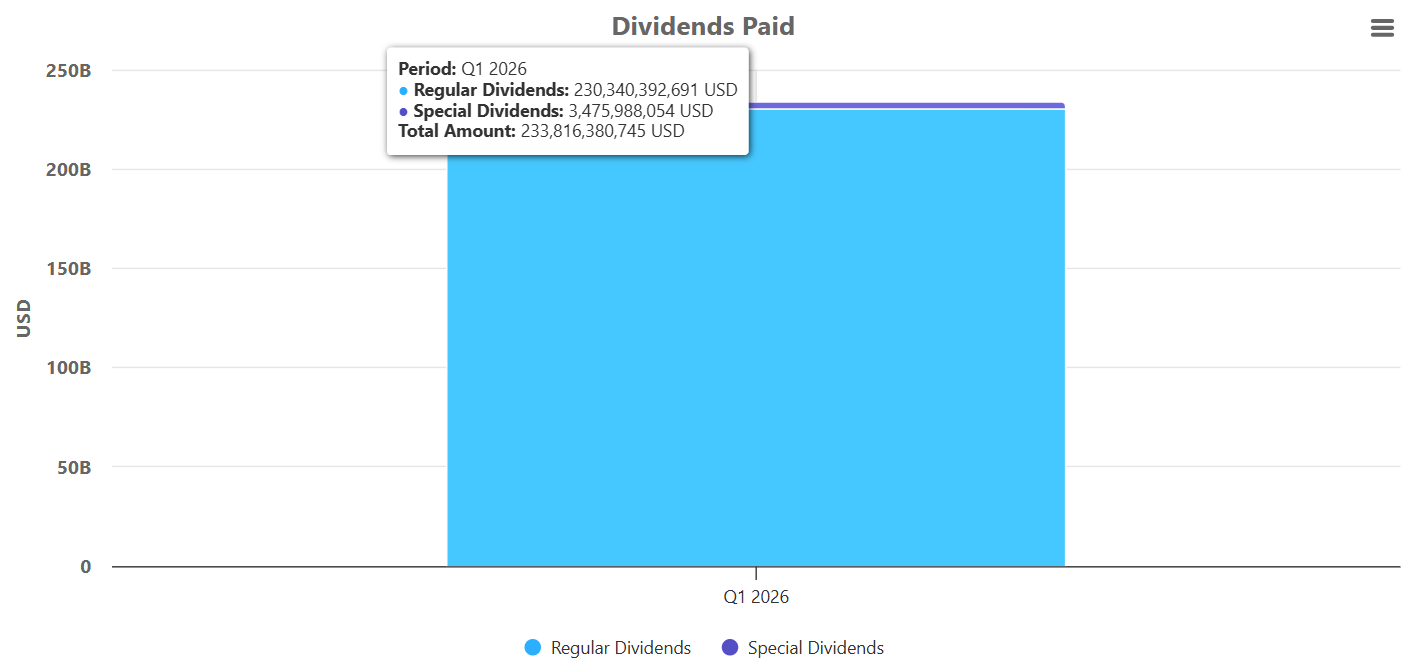
U.S. Dividend Landscape
The chart shows total dividend payments by U.S. companies for the first quarter of 2026, including a breakdown between regular and special distributions.
Dividend activity remains stable as companies enter the new year. In Q1 2026, total payouts reached approximately $233.8 billion, with the overwhelming majority — about $230.3 billion — coming from regular dividends. Special dividends contributed a relatively small portion of roughly $3.5 billion.
This composition closely mirrors the pattern observed in late 2025, where special payouts declined and regular dividends became the dominant source of shareholder income. The limited role of special distributions indicates that dividend flows are primarily supported by recurring operating cash flows rather than one-time balance-sheet actions.
Overall, the first-quarter data confirms a stable and sustainable dividend environment in the U.S., with consistent payout levels and a strong reliance on regular dividends as the core driver of shareholder returns in early 2026.
U.S. Dividend Breakdown — Q1 2026
These charts show how dividend payments in the U.S. market are distributed across sectors and industries based on the latest year-to-date data for the first quarter of 2026.
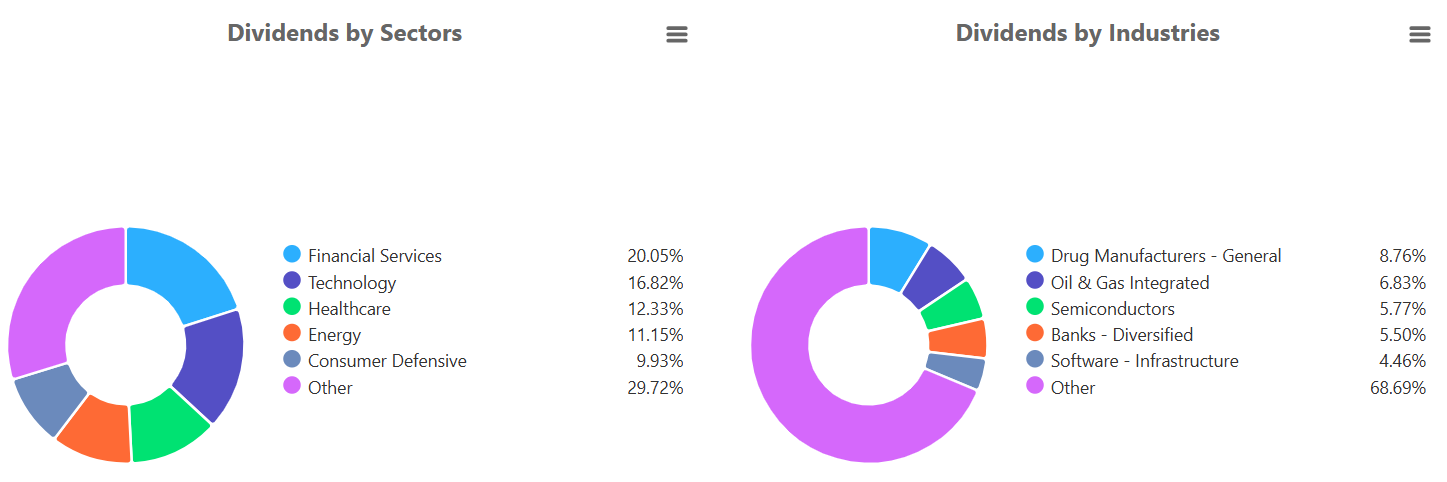
Financial Services lead all sectors, accounting for 20.05% of total U.S. dividend payouts. Technology follows at 16.82%, while Healthcare (12.33%) and Energy (11.15%) form a strong second tier of contributors. Consumer Defensive represents 9.93%, continuing to provide stability through essential demand, while the 29.72% “Other” category reflects broad sector diversification across the market.
At the industry level, Drug Manufacturers remain the largest identifiable group at 8.76%. Oil & Gas Integrated companies contribute 6.83%, followed by Semiconductors at 5.77% and Diversified Banks at 5.50%. Software Infrastructure adds 4.46%, highlighting the growing role of digital backbone businesses in income generation. The 68.69% “Other” segment once again underscores the wide dispersion of dividend payments across industries.
Overall, the Q1 2026 data shows a balanced dividend structure in the U.S., with financials and technology leading, supported by healthcare and energy, while maintaining broad diversification across industries.
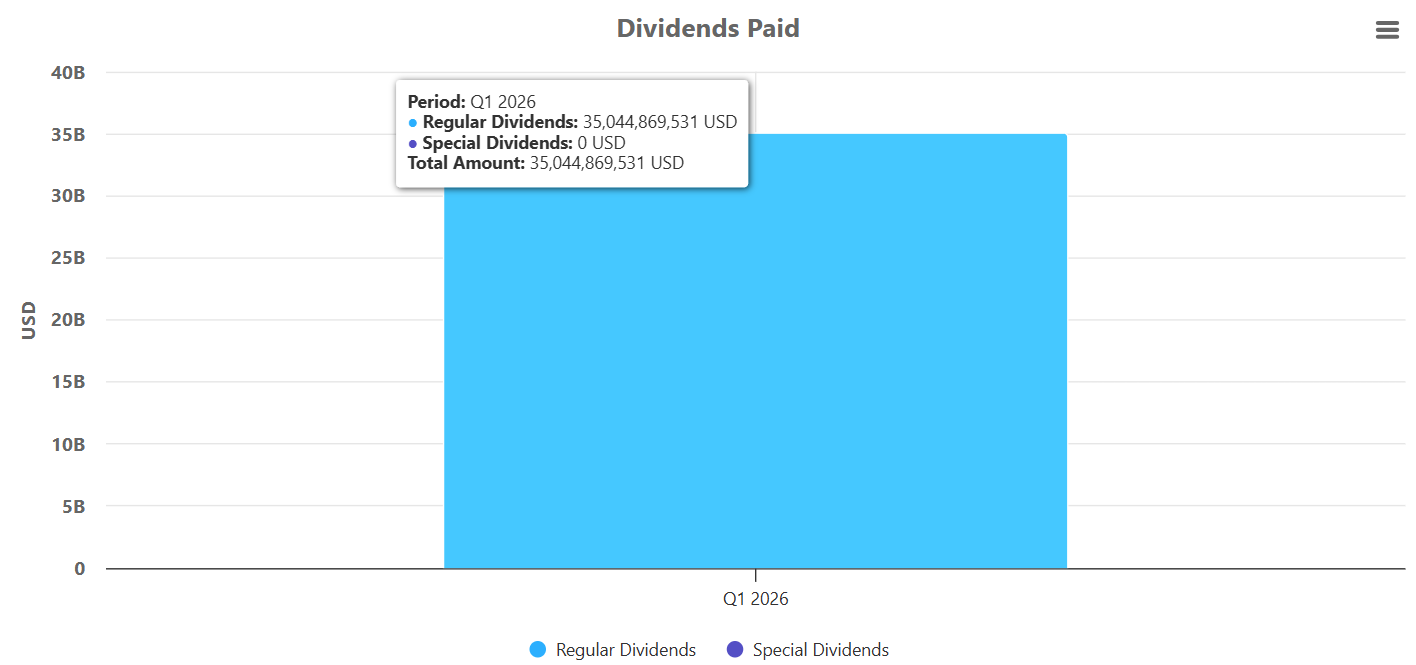
Cumulative dividends paid by US Dividend Eagles in Q1 2026
Dividend Eagles — companies with 15+ consecutive years of dividend growth — continue to deliver consistent cash distributions in the first quarter of 2026.
So far in Q1 2026, cumulative dividends paid by Dividend Eagles total approximately $35.04 billion, entirely composed of regular dividends. No special dividends have been reported during this period.
As the quarter is still in progress, these figures remain preliminary and will adjust as additional payments are recorded. However, the current data once again highlights the structural strength of this group: distributions are driven purely by recurring operating cash flows rather than one-time events.
The continued dominance of regular dividends reinforces the predictability and durability of income generated by long-term dividend growth companies.
Proof That Dividend Eagles Deliver, Year After Year
Over the past decade, U.S. Dividend Eagles — companies with 15+ consecutive years of dividend increases — have shown a steady and sustained expansion in total cash returned to shareholders.
Annual dividend payouts grew from approximately $68 billion in 2015 to $134.4 billion in 2025, representing nearly a 100% increase over the period. This growth reflects not only rising earnings but also a consistent commitment by these companies to return cash through regular dividend increases across multiple economic cycles.
The decade-long trend demonstrates that Dividend Eagles have been able to maintain and expand their payout capacity through periods of economic recovery, inflation, and shifting market conditions — providing a long-term foundation of reliable and growing shareholder income.
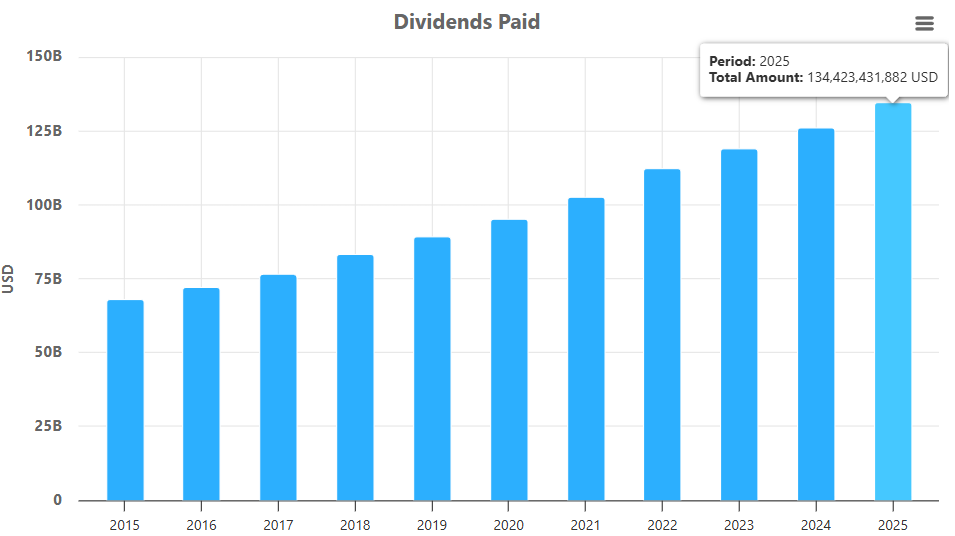
📊 This chart makes the MaxDividends concept crystal clear: when you own businesses that never stop paying and keep raising the bar every single year, your income stream snowballs in front of your eyes. These are not flashy promises — they are the most reliable wealth-building machines in the market.
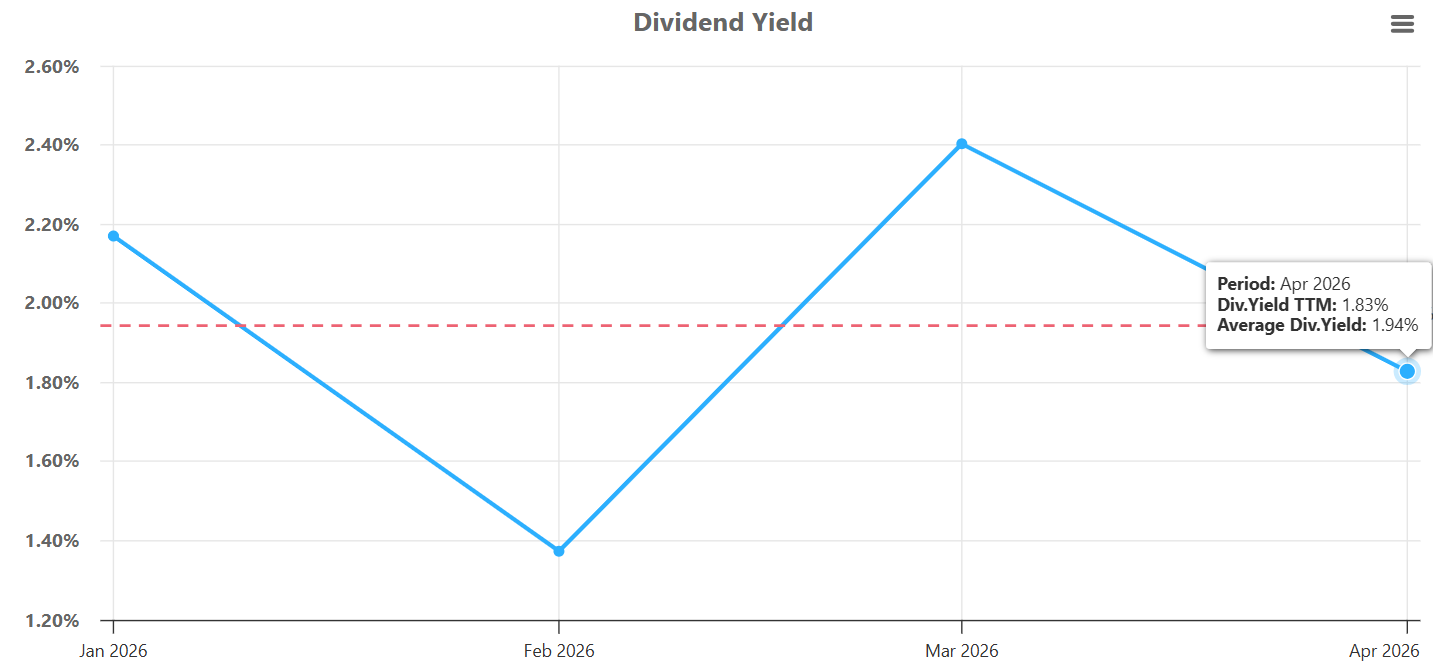
Average Dividend Yield of Dividend Eagles, Q1 2026
Over the past several months, the average dividend yield of Dividend Eagles has moved through a noticeable cycle, reflecting shifts in valuation and market pricing.
Yields started near 2.17% in January, then declined sharply to around 1.38% in February, marking the lowest point in the period. A strong rebound followed in March, with yields rising to approximately 2.40%, before moderating again to about 1.83% in April.
As of the latest data, the dividend yield stands below the long-term average of 1.94%, indicating a tighter income environment compared to historical norms.
This compression in yield suggests that recent price appreciation has outpaced dividend growth. While underlying payouts remain stable, current valuations imply that Dividend Eagles are trading at a premium relative to their long-term income profile.
🥇 Top 5 Dividend Eagles by Total Payouts (Q1 2026)
These are the heavyweights — the Dividend Eagles returning the most cash to shareholders right now:
Microsoft (MSFT) — 💵 $6.79B
Johnson & Johnson (JNJ) — 💵 $3.16B
Procter & Gamble (PG) — 💵 $2.59B
Home Depot (HD) — 💵 $2.32B
Coca-Cola (KO) — 💵 $2.29B
📊 Together, these five companies have already distributed approximately $17.2 billion in dividends in 2026 year-to-date — a clear illustration of the scale, consistency, and cash-generating power behind the Dividend Eagles group.
And that’s exactly what the Dividend Eagles List is all about. 🦅 It’s our curated lineup of 100+ U.S. companies that have raised dividends for 15+ consecutive years — the strongest, most consistent payers in the market. These aren’t just stocks; they’re proven wealth-building machines built on financial stability, resilience, and decades of shareholder commitment.
👉 The full, always-updated Dividend Eagles List is available inside the MaxDividends App — exclusive to our community.
Created by the MaxDividends Team. Available only on MaxDividends. Exclusive.
U.S. Dividend Landscape - (S&P 500)
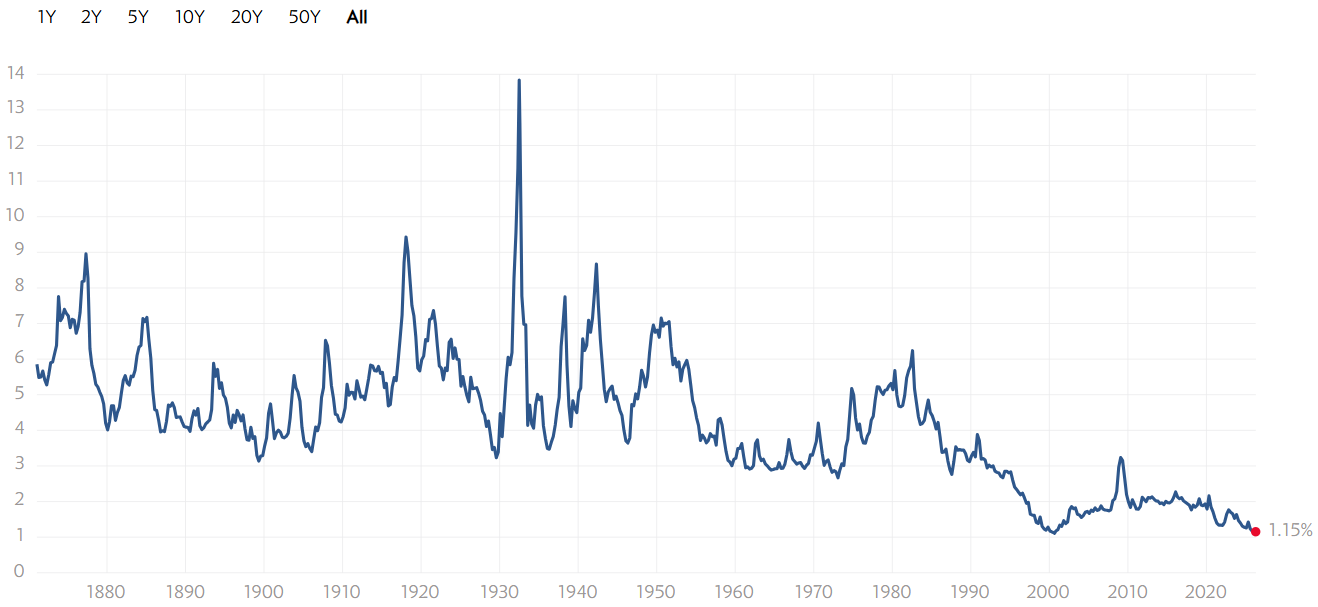
S&P 500 Dividend Yield — Historical Perspective
The S&P 500 dividend yield remains deeply compressed, currently sitting at approximately 1.15% — near the lowest levels observed in modern market history. Elevated equity valuations continue to suppress yield levels, as stock prices have significantly outpaced dividend growth.
When viewed against more than a century of historical data, today’s yield stands far below the long-term norm of 3–5%. Periods of higher yields have typically coincided with market stress or lower valuations, while current levels reflect a premium pricing environment.
This persistent yield compression suggests that investors are paying a higher price for future earnings and income streams, reinforcing the view that today’s market is driven more by capital appreciation than by dividend yield (Figure 3).
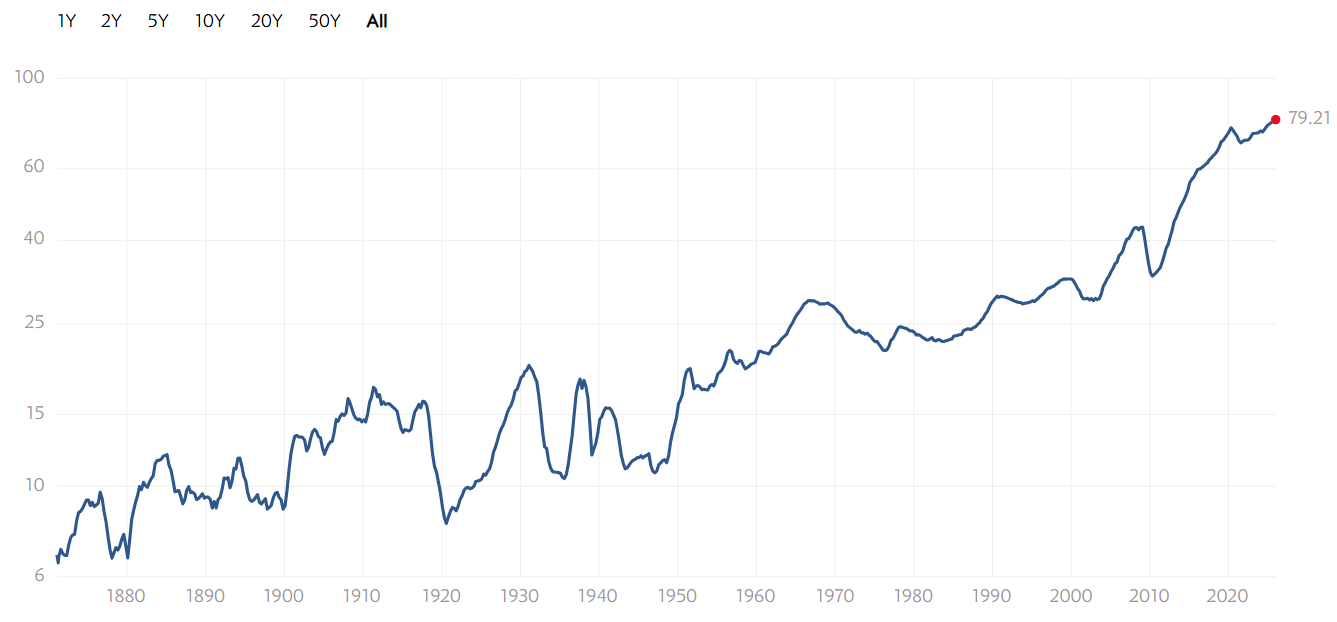
S&P 500 Historical Dividend Trends
Inflation-adjusted dividends for the S&P 500 continue to follow a clear long-term upward trajectory. Despite multiple economic cycles, crises, and periods of market volatility, the underlying growth trend in real dividends has remained intact for well over a century.
The previous inflation-adjusted peak has now been surpassed, with dividends reaching approximately 79.21, marking a new all-time high. This continued expansion highlights the strength and resilience of corporate cash flows within the index.
Overall, the long-term trend reinforces a key principle of income investing: while markets fluctuate, the ability of high-quality companies to grow and sustain dividend payments remains remarkably durable over time.
S&P 500 Dividend Growth
The S&P 500 dividend growth trend continues to demonstrate long-term resilience. Over multiple decades, negative dividend growth has occurred only during periods of severe economic stress, highlighting how rarely large U.S. companies reduce payouts on a broad basis.
The latest reading shows dividend growth at approximately 5.46%, indicating a moderate but steady pace of expansion. While this level is below the stronger growth rates seen during post-recovery periods, it remains consistent with a stable earnings environment and ongoing cash flow generation across the index.
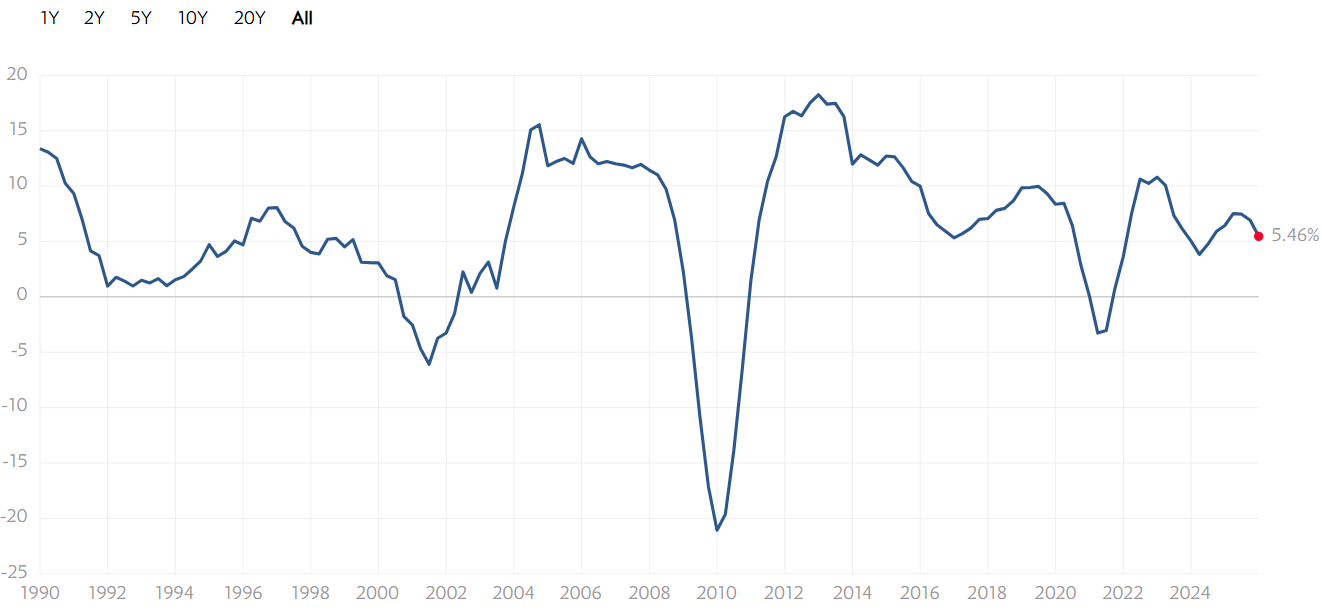
Despite periodic volatility and economic cycles, the long-term pattern of dividend growth remains positive. This reinforces the ability of S&P 500 companies to sustain and gradually increase shareholder payouts over time, even through challenging market conditions.
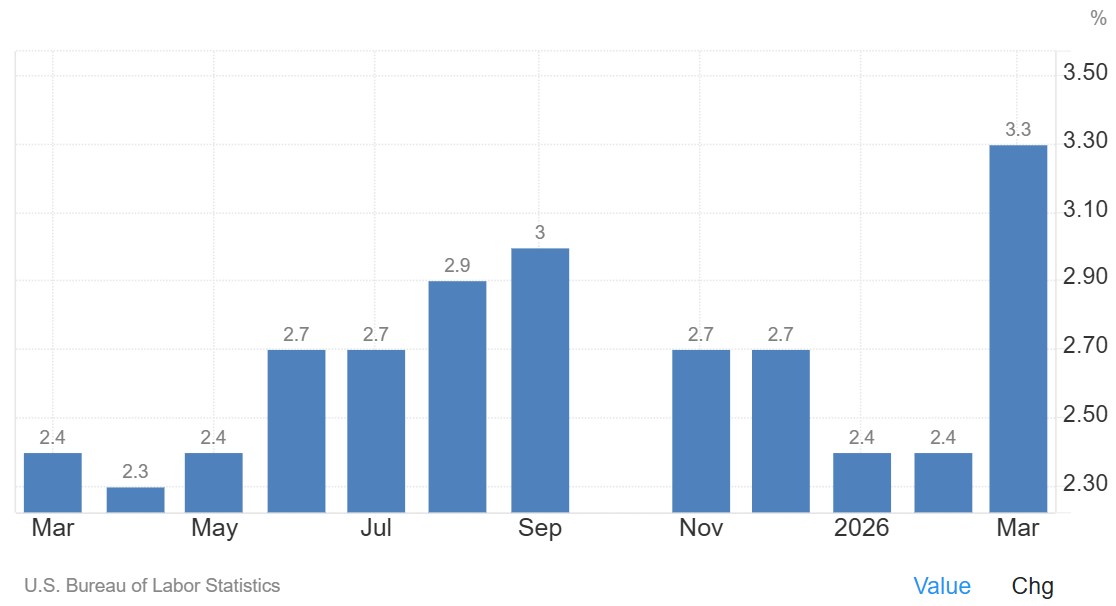
Inflation’s Impact on Dividends
Inflation has shown a renewed upward move entering 2026, once again influencing the real (inflation-adjusted) value of dividend income. While price growth had previously stabilized within the mid-2% range, recent data indicates a shift toward higher inflation levels.
After holding near 2.3–2.4% in the spring of 2025, inflation gradually accelerated through the summer, reaching 2.9% in August and peaking at around 3.0% in September. It then moderated toward year-end, returning to approximately 2.7% in November and December, before easing again to around 2.4% at the start of 2026.
However, the latest reading shows a sharp increase to approximately 3.3%, marking a clear move above the recent range and signaling renewed inflationary pressure.
This rebound in inflation reduces the real value of dividend income, as a larger portion of nominal dividend growth is offset by rising prices. While corporate payouts remain stable, the current environment suggests that real income growth may face increased pressure if inflation remains elevated.
For your convenience, we have prepared a PDF version of the Dividend Macro Overview. You can download and review it at any time.
💬 Like, share, and repost to spread the dividend mindset!
Happy dividends for all the holders!
- Max & MaxDividends Team
MaxDividends Mission
Helping people build growing passive income, retire early, and live off dividends.
Someone’s sitting in the shade today because someone planted a tree a long time ago. ― Warren Buffett.