
🎓MaxDividends Academy Case Study: T. Rowe Price Group (TROW)
A step-by-step company analysis that teaches you how to apply the MaxDividends strategy in real life.

MaxDividends Mission: Helping people build growing passive income, retire early, and live off dividends.
This series is part of the MaxDividends Academy — where we teach our proven secret Five-Pillar Formula in practice. Each lesson breaks down a real company, showing how to spot lasting dividend payers and avoid traps, step by step.
🔓 Request Free Early Access to the MaxDividends App
Learn Dividend Investing One Stock at a Time
🎓 MaxDividends Academy Case Study: T. Rowe Price Group (TROW)
Hey — Max here 💪
Before we dive in, a few important words.
What you’re about to read comes from our Premium Academy — the highest tier of MaxDividends content.
This is where dividend investing is broken down step by step: how to separate durable income businesses from cyclical traps, how dividend reliability is really built, and how to construct an income stream that survives bear markets, volatility, and investor emotions.
This isn’t theory. It’s classic dividend logic — tested through market booms, crashes, and long drawdowns — distilled into clear decision rules you can actually use.
Today, that playbook is open to you.
In upcoming Academy cases, we’ll continue to analyze dividend companies that look attractive on the surface — but require deeper inspection to understand when they work, why they work, and when they don’t.
The edge is simple: seeing structure instead of stories, understanding cash-flow mechanics, and positioning before the crowd mistakes stability for safety.
Now, let’s talk about a name many income investors think they understand — but often misclassify.
T. Rowe Price Group is not a consumer staple. It’s not a utility. And it’s not a bond proxy. It’s a pure-play asset manager — a business whose cash flows are tied directly to markets, investor sentiment, and assets under management.
TROW can look incredibly attractive:
strong balance sheet
long dividend growth history
generous payouts
But it can also behave very differently from classic “sleep-well-at-night” dividend stocks when markets turn.
That’s exactly why it belongs in the Academy. The real question isn’t whether T. Rowe Price is a quality company.
The real question is:
Does TROW fit a dividend strategy that prioritizes reliability — or is it a cycle-dependent income play that requires precise timing?
In this Academy Case, TROW goes through the MaxDividends Five-Pillar Formula — the same checklist we use to test whether dividends are structurally protected or simply riding favorable market conditions.
👉 Let’s break it down — step by step.
How This Company Makes Money?
Do I clearly understand how T. Rowe Price earns its money — and does the business actually make sense?
T. Rowe Price makes money in a very specific way: by managing other people’s capital and charging fees based on the value of assets under management (AUM).
This is not a lending business. Not a product business. And not a balance-sheet-driven model. TROW is a fee-based asset manager, meaning revenue rises and falls with markets, investor flows, and sentiment.
The core engines:
1️⃣ Asset Management Fees (The True Revenue Driver)
The vast majority of revenue comes from management fees charged on mutual funds, retirement accounts, and institutional mandates.
Key mechanics:
fees are calculated as a % of AUM
higher markets = higher AUM = higher revenue
market drawdowns or outflows hit revenue immediately
This creates high operating leverage — great in bull markets, uncomfortable in bear markets.
2️⃣ Active Investment Platform
TROW focuses heavily on actively managed strategies:
equity funds
target-date retirement funds
balanced and multi-asset portfolios
Active management allows:
higher fee rates than passive ETFs
stronger margins when performance is competitive
But it also introduces performance risk — poor relative returns can trigger client outflows.
3️⃣ Retirement & Long-Term Client Base
A meaningful portion of assets comes from:
retirement plans
long-duration savings vehicles
This creates a degree of stickiness — clients don’t move money daily.
However, it does not eliminate cyclicality. Market declines still reduce AUM even if clients stay put.
4️⃣ Capital-Light, Cash-Generative Structure
TROW requires very little physical capital:
no factories
no inventory
no credit risk
Operating margins are structurally high, and free cash flow conversion is strong when markets cooperate.
This is why the company can:
pay attractive dividends
fund special dividends
run with low leverage
But the cash flow is market-sensitive, not consumption-driven.
Why this matters for dividend investors?
T. Rowe Price sits at the intersection of:
market cycles (AUM volatility)
investor behavior (flows in/out)
operating leverage (earnings swing faster than revenue)
This is not a recession-proof income machine like a consumer staple.
It’s a cycle-dependent dividend payer — capable of generous payouts in strong markets, but structurally exposed when equity markets weaken.
👉 Yes — the business model is understandable and clean.
👉 But dividend reliability here depends far more on market conditions than on everyday demand.
That distinction matters — a lot — in the MaxDividends framework.
Is This a Good Stock to Buy Long Term?
Has the company shown the kind of consistency and resilience a long‑term dividend strategy needs?
The MaxDividends approach is built around reliable businesses that raise their dividends year after year. The longer you hold them, the more cash they quietly plug into your portfolio — without you doing anything.
The MaxDividends Strategy Checklist – Simple Steps to Pick the Right Stocks
Step 1: Dividend History
Our filter: Companies with 15+ years of consistent dividend growth.
The 15-year dividend chart in the MaxDividends App shows a clear, uninterrupted upward trajectory. Annual dividends rise from roughly $1.20 per share in the early 2010s to $5.00+ per share by 2025.
There are no cuts and no freezes across the entire period — including:
post-financial-crisis normalization
the COVID market shock
the 2022–2023 bear market
That alone places TROW in a relatively small group of asset managers with true dividend discipline. A few key points for income investors:
dividends increased every single year, even when markets were volatile
growth has been lumpy but strong — faster increases in bull markets, slower in drawdowns
the payout trajectory reflects market-linked earnings, not steady consumer demand
the current dividend level is materially higher than a decade ago, but future growth will remain cycle-dependent
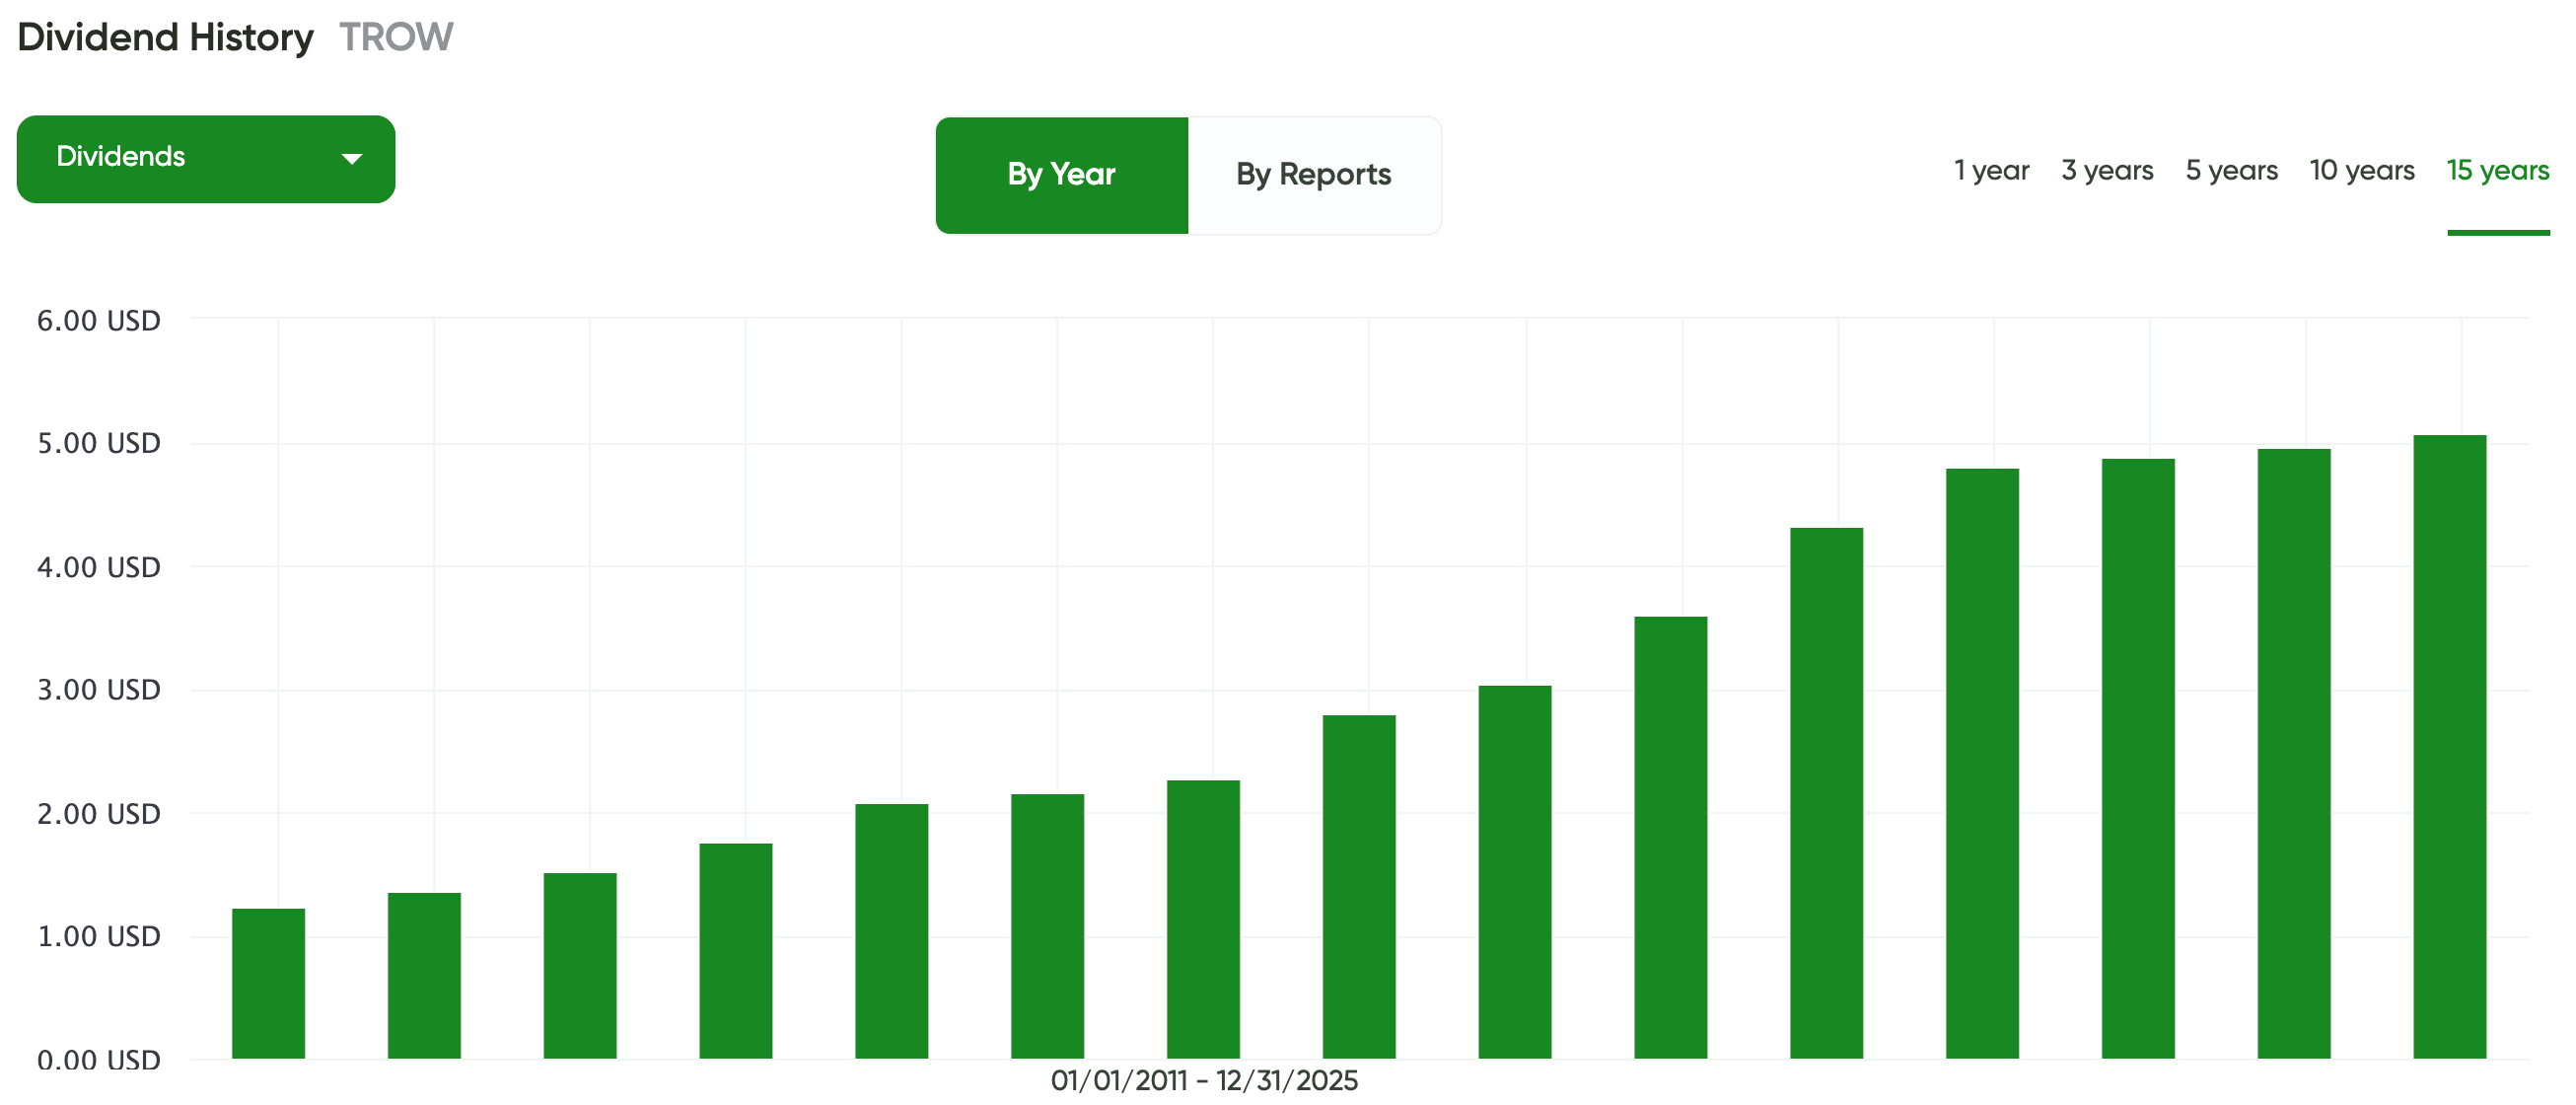
✅ Step 1 passed — T. Rowe Price demonstrates a strong dividend culture and long-term commitment to shareholders, even through market stress.
Step 2: The Five-Pillar Secret Formula
1️⃣ Sales Growth – The Foundation of a Strong Business
Over the past 10 years, T. Rowe Price’s revenue has been clearly cyclical, moving in line with financial markets rather than following a smooth upward trend.
According to the MaxDividends App chart, revenue grew steadily from roughly $4B+ in the mid-2010s to a peak near $7.5–8B during the 2021 bull market, when equity valuations, AUM, and investor inflows were all expanding at once.
Then came the reset. As markets declined in 2022–2023, TROW’s revenue pulled back sharply into the $6B range, reflecting:
lower asset values
reduced performance fees
weaker investor sentiment
Importantly, this was not a loss of relevance or demand collapse — it was a mechanical outcome of market-driven fee economics. More recently, revenue has begun to recover again, moving back toward the $7B+ level as markets stabilized and asset values improved.
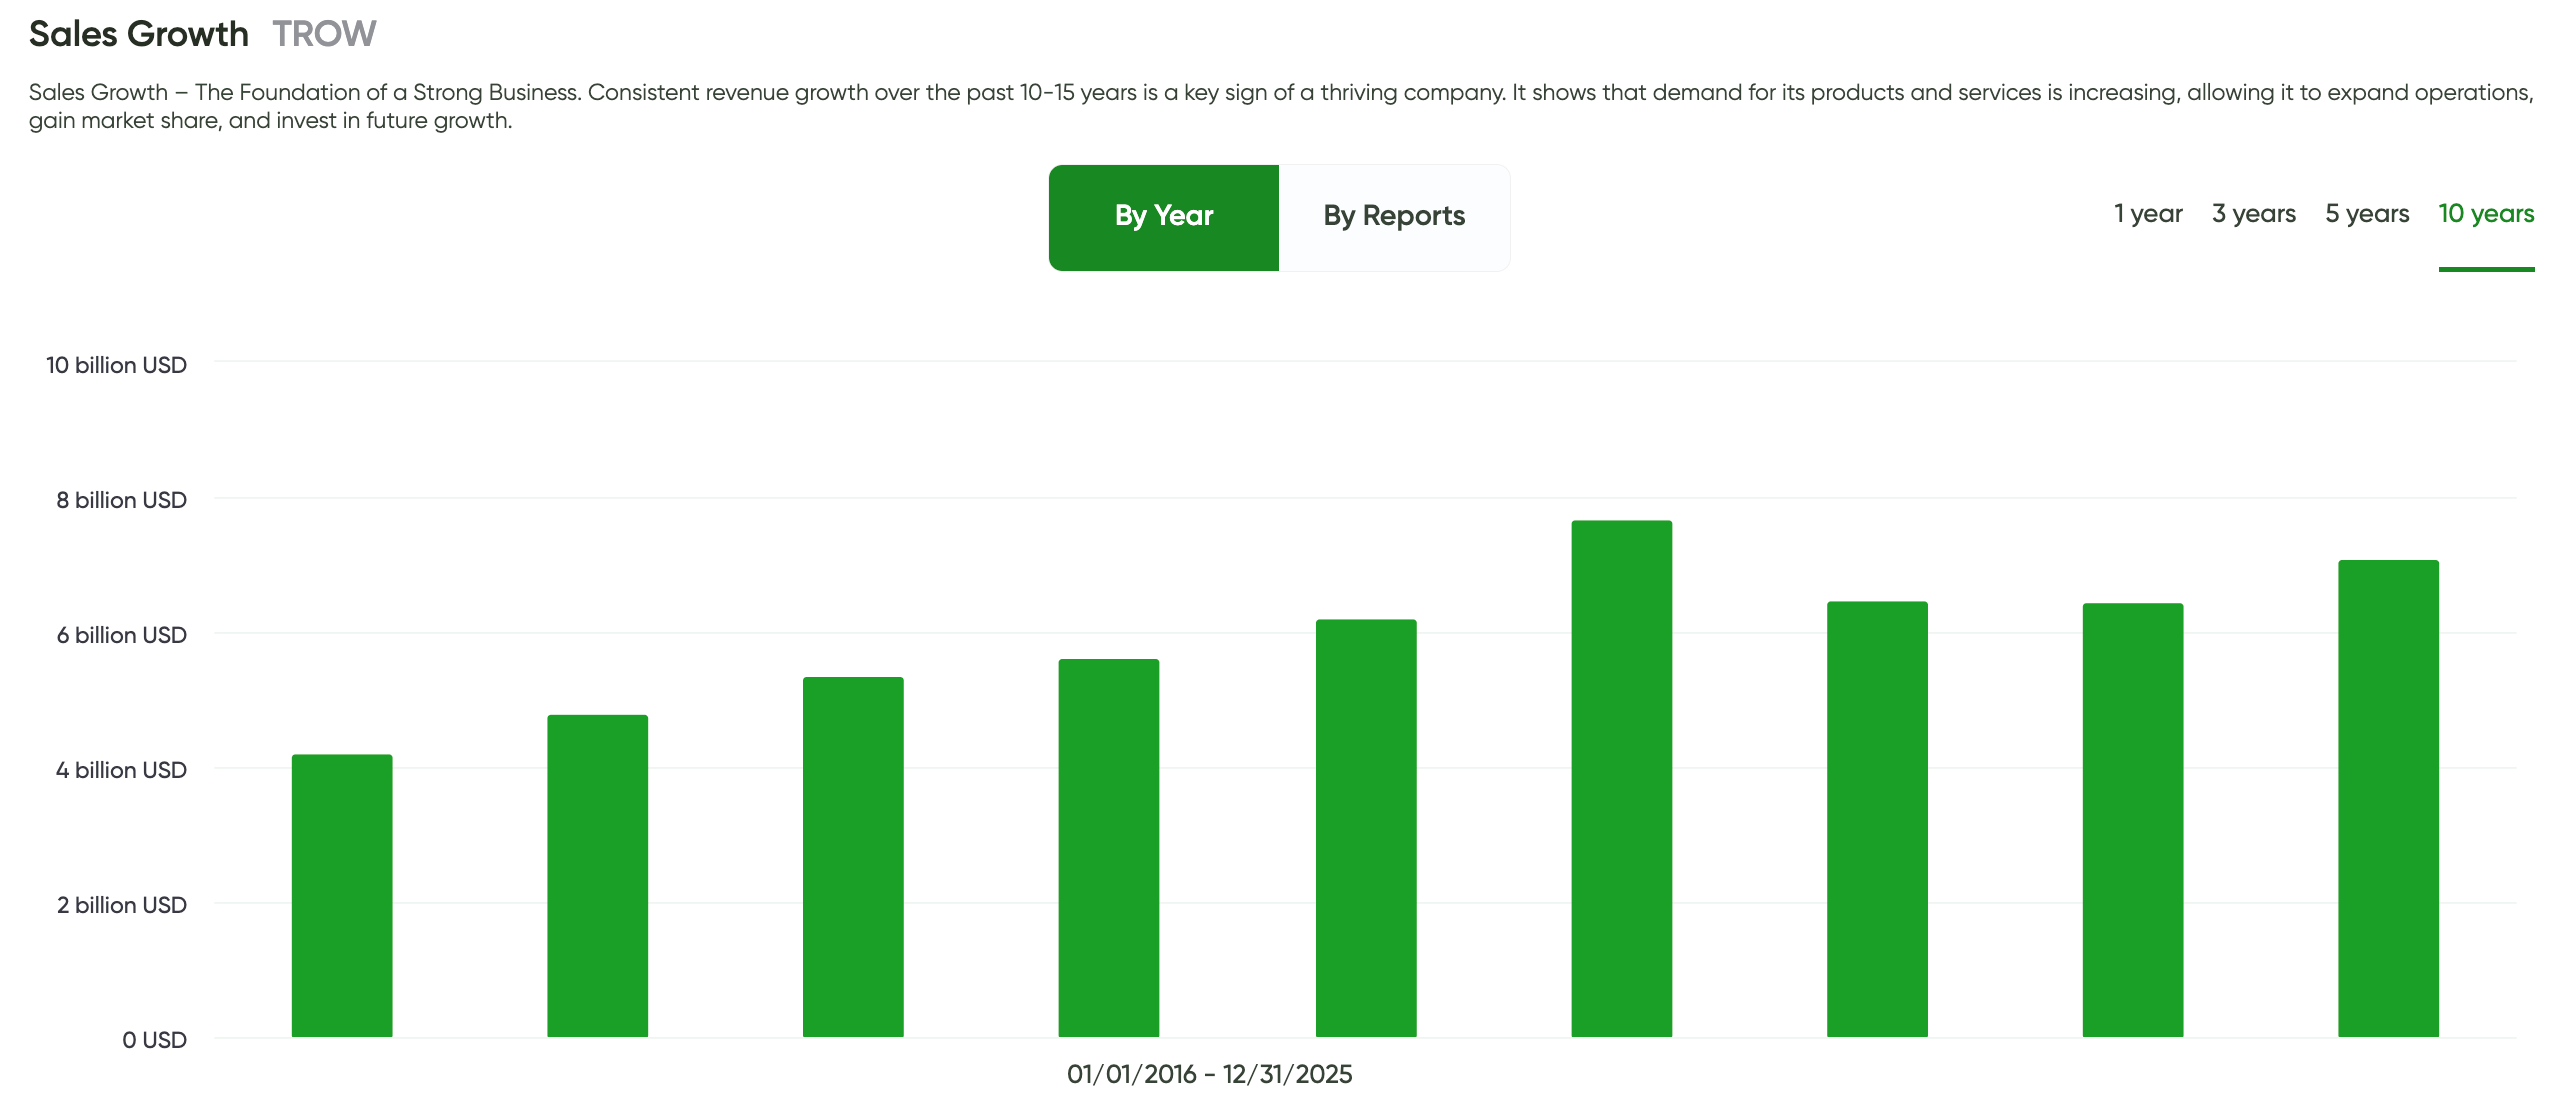
✅ Sales Growth Passed — T. Rowe Price does not offer smooth, insured revenue growth. It offers revenue expansion through market leverage over full cycles.
2️⃣ Profit Growth – The Fuel for Dividend Growth
Profit dynamics at T. Rowe Price clearly reflect its market-linked business model — and that’s exactly what the MaxDividends App chart shows over the last decade.
From 2015 to 2019, profits grew steadily from roughly $2.5B to just over $3B, driven by:
rising equity markets
growing assets under management
strong operating leverage
During the 2020–2021 bull market, profits expanded sharply, peaking above $5B, as AUM reached record highs and operating margins widened significantly. With largely fixed costs, incremental revenue flowed almost directly to the bottom line.
In 2022–2023, profits declined into the $3.5–4B range, reflecting:
lower market valuations
weaker performance fees
reduced investor inflows
Crucially, this was not margin collapse and not operational mismanagement. The business remained profitable, cash-generative, and well above pre-2018 profit levels.
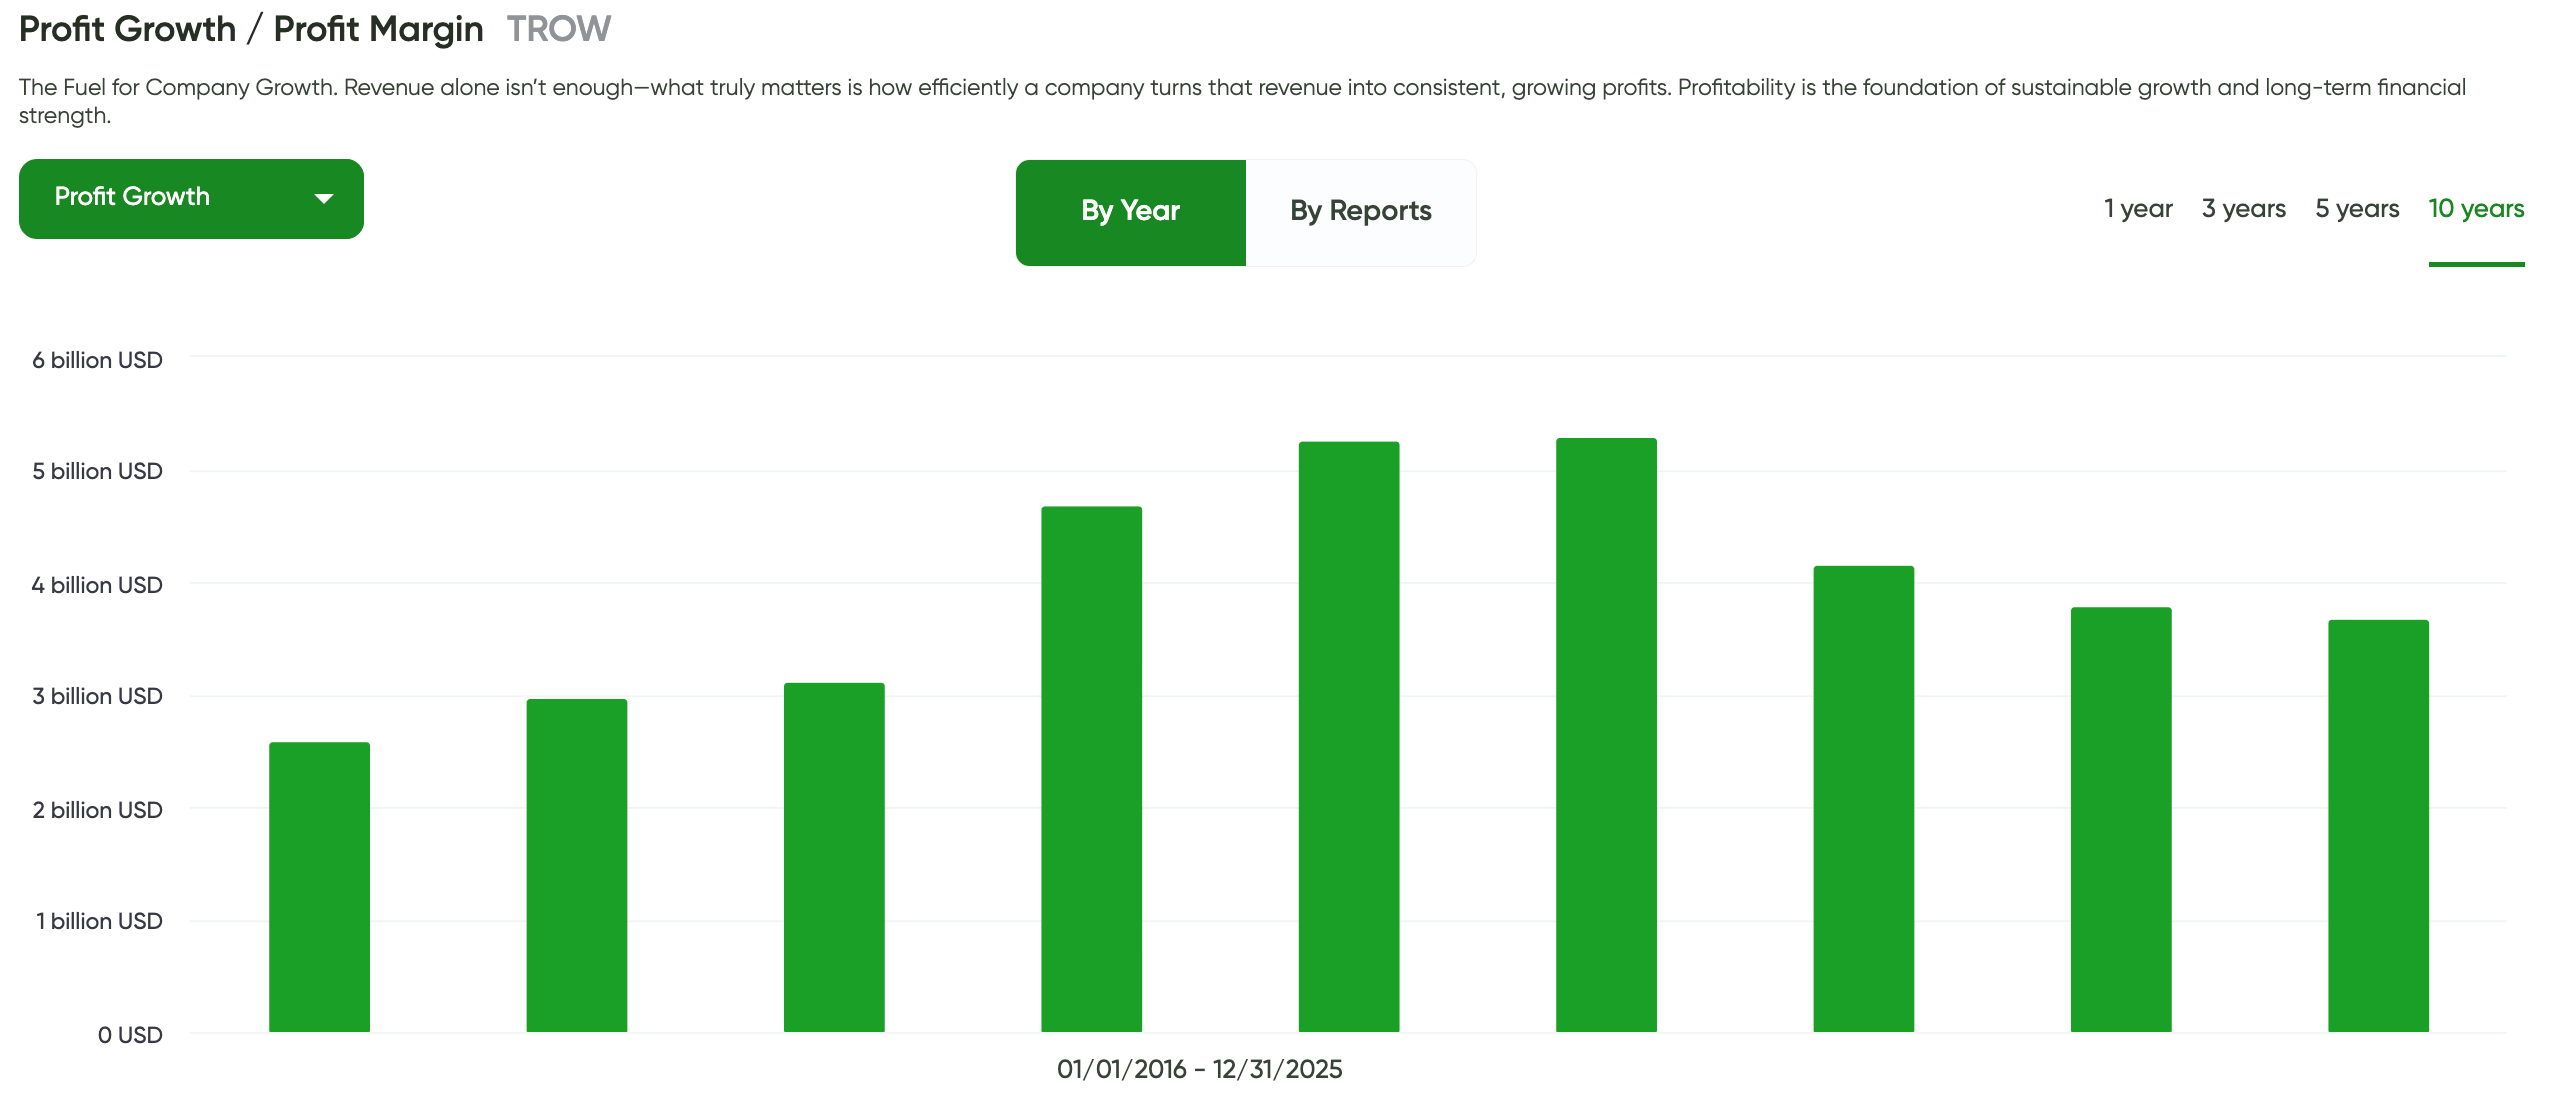
✅ Profit Growth Passed — T. Rowe Price does not deliver smooth earnings growth like consumer staples. What it delivers is powerful upside during strong markets, while remaining solidly profitable during downturns.
3️⃣ Net Income – True Measure of Strength
T. Rowe Price’s net income reflects a classic market-driven cycle, not a deterioration of the business. Over the past decade, earnings expanded steadily from the $1–1.5B range into the low-$2B range as assets under management grew and operating margins remained high.
During the 2020–2021 market boom, net income surged above $3B, driven by record AUM, strong equity markets, and high operating leverage. This represented peak-cycle profitability rather than a new permanent baseline.
The subsequent decline in 2022 brought net income back toward $2B, largely due to market corrections and lower performance fees. Importantly, this was not caused by one-time charges, leverage stress, or operational weakness. Even at the trough, TROW remained solidly profitable.
By 2023–2024, earnings stabilized and began recovering into the $2–2.3B range, confirming that the firm’s underlying earnings power remains intact across market cycles.
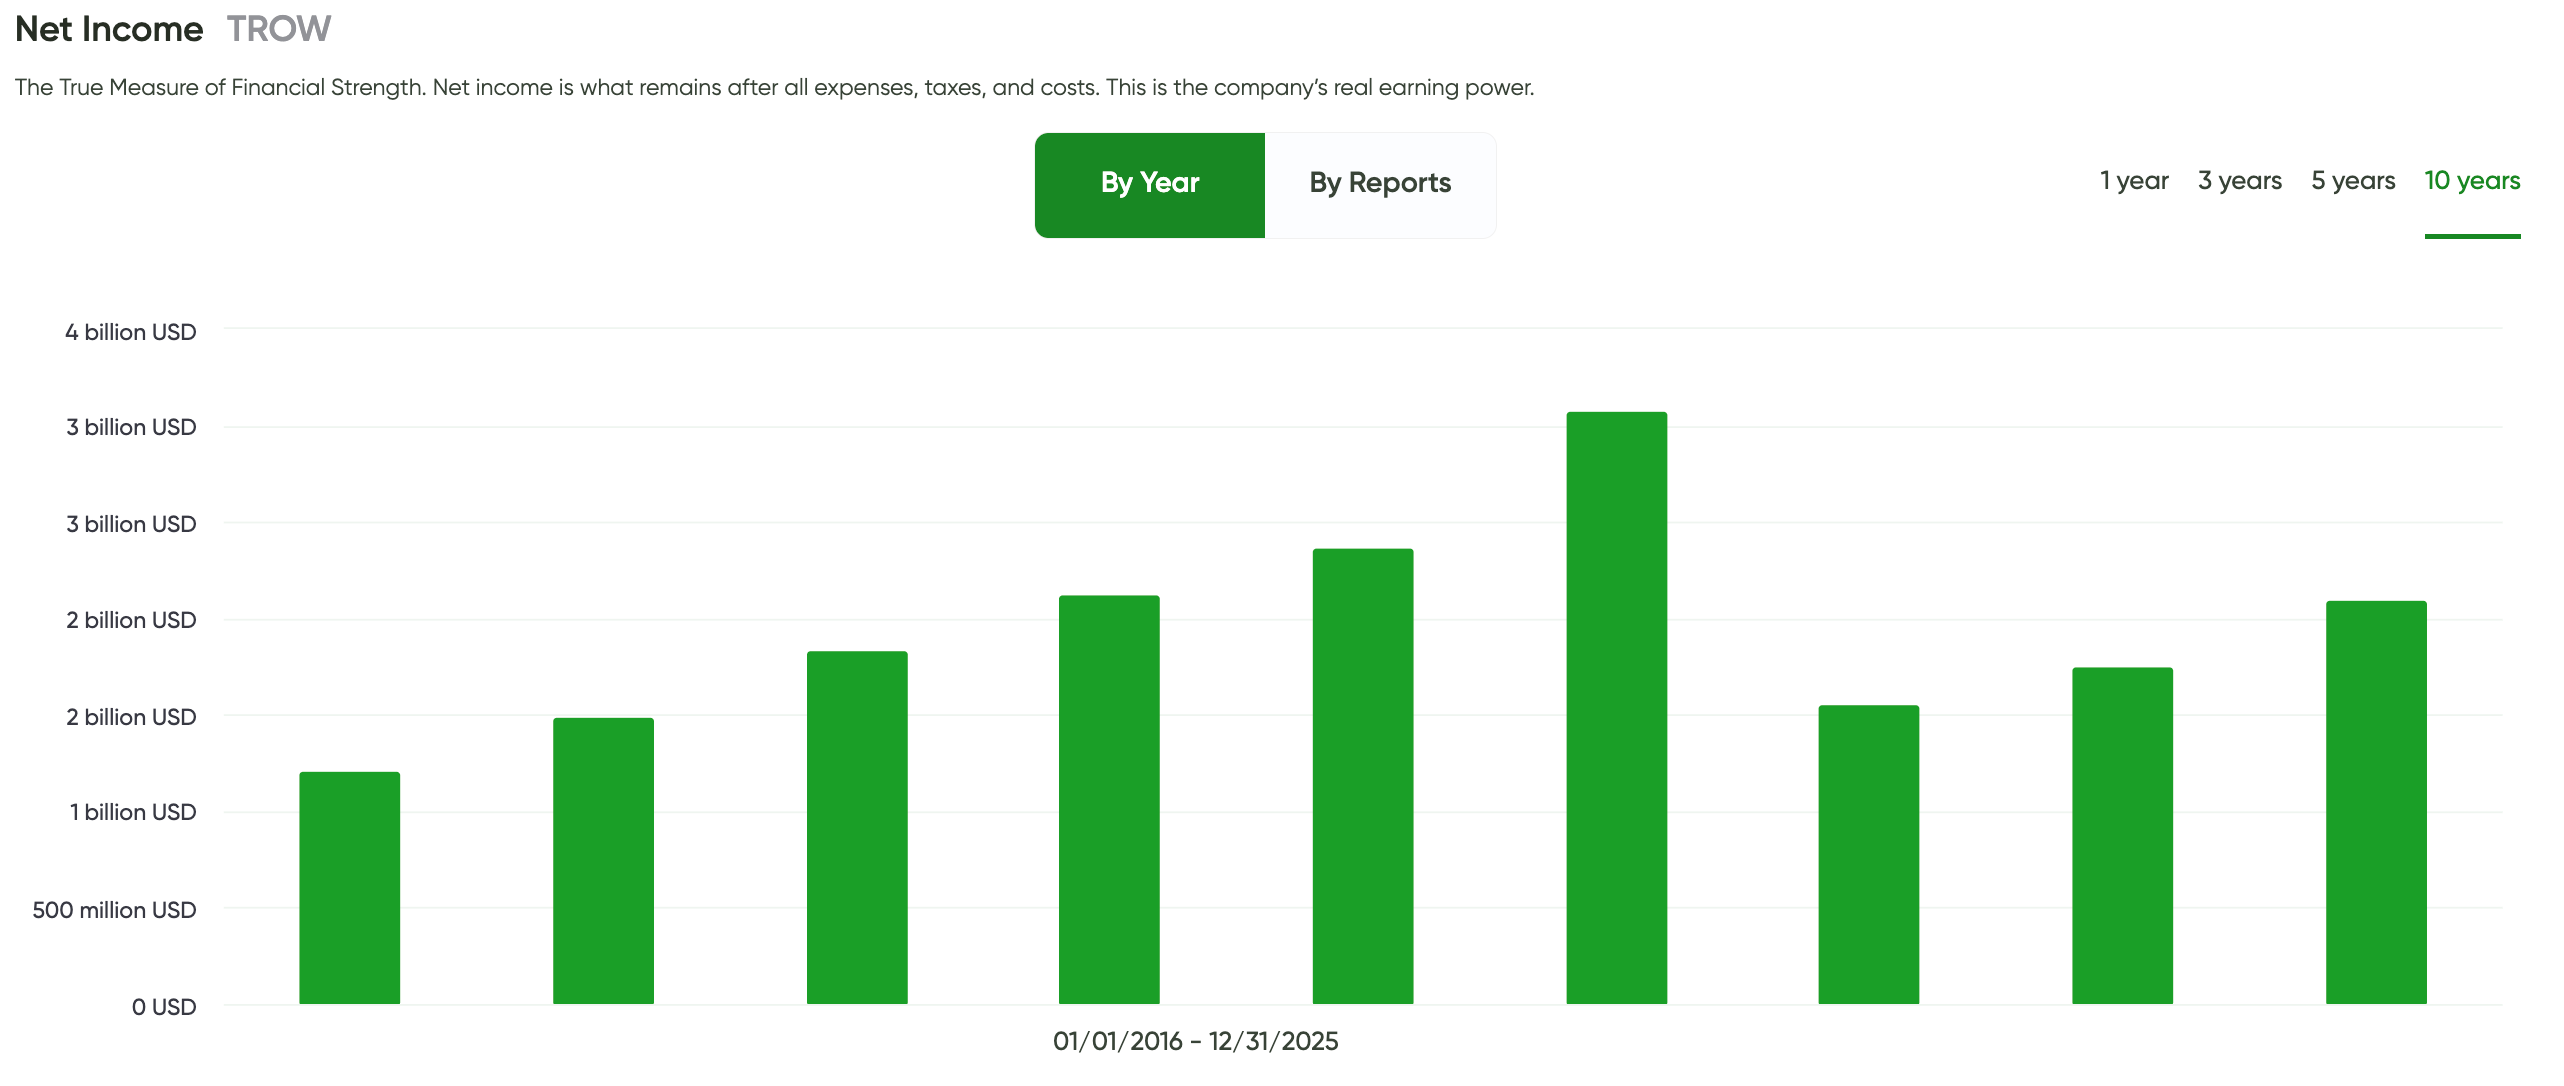
✅ Net Income Passed — earnings are cyclical but structurally strong, consistently profitable, and fully supportive of a sustainable, long-term dividend.
4️⃣ Dividend Payout Safety – Protecting Passive Income
T. Rowe Price’s payout ratio shows a disciplined and conservative dividend policy, even through market cycles. For most of the past decade, the payout ratio stayed in the 30–45% range, signaling that dividends were comfortably covered by earnings and left ample room for reinvestment.
The only notable spike appears around 2021, when the payout ratio temporarily jumped toward 70%. This wasn’t driven by aggressive dividend increases, but by peak-cycle earnings volatility — profits normalized after an exceptional market-driven year while dividends continued their steady upward path.
Since then, the payout ratio has settled back into the 50–55% range, which is very reasonable for an asset manager with no capital intensity, minimal debt, and strong free cash flow generation. Importantly, TROW has never relied on leverage or one-time adjustments to support its dividend.
The pattern is clear: management prioritizes dividend stability first, growth second — and only within what normalized earnings can support.
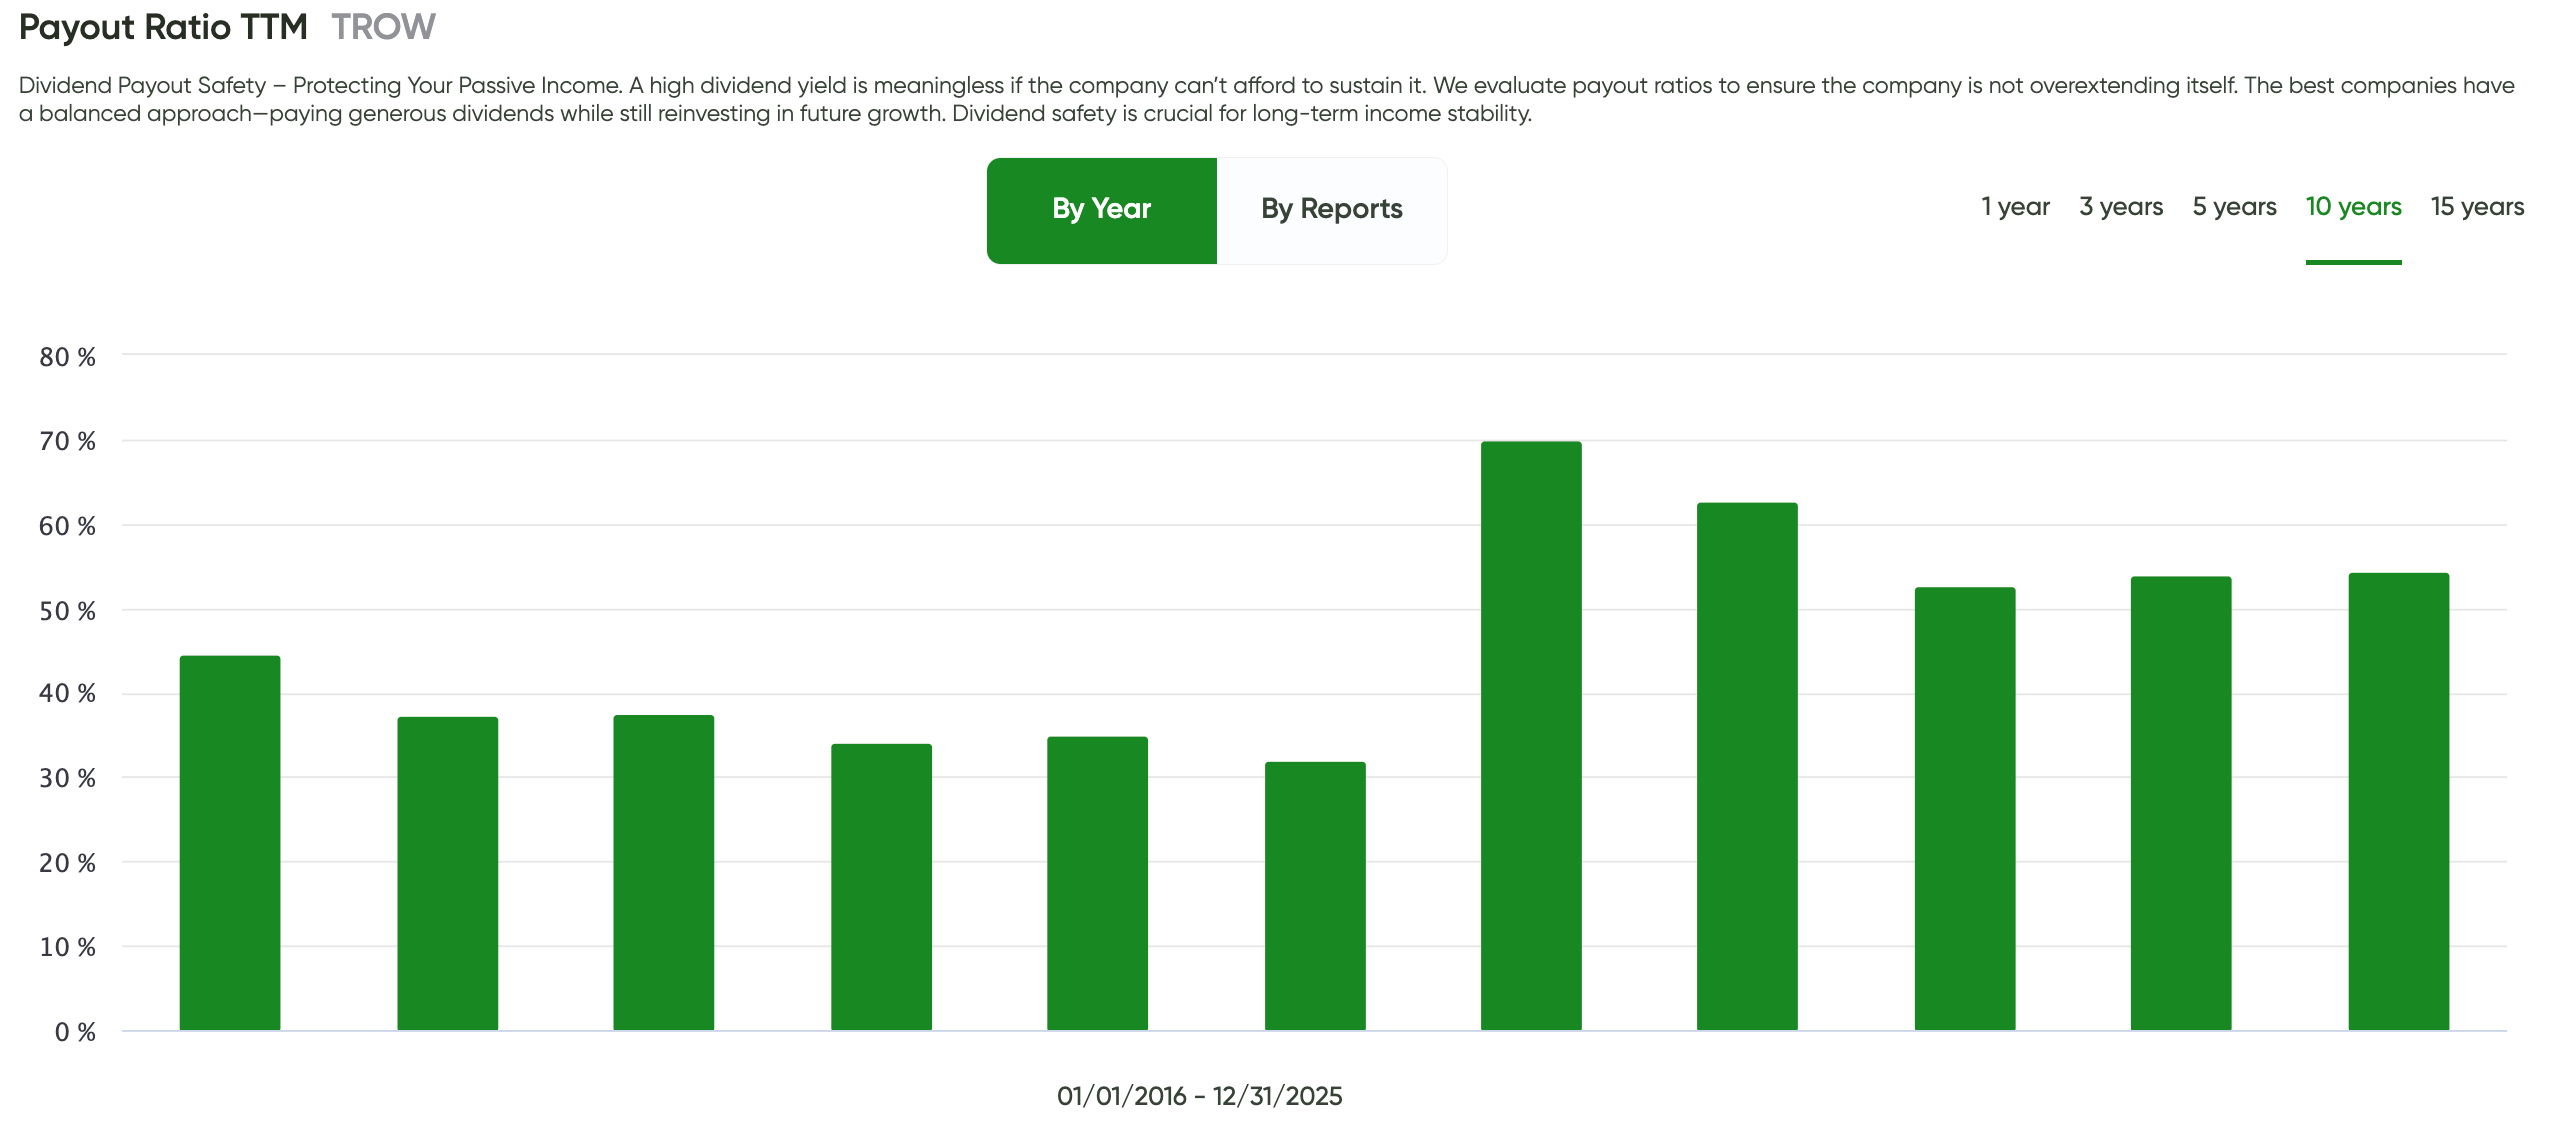
✅ Dividend Payout Safety Passed — payout levels are balanced, sustainable, and well-covered across cycles, leaving a solid buffer for maintaining and growing dividends even during weaker markets.
5️⃣ Debt Burden – Avoiding Financial Traps
T. Rowe Price stands out here for one simple reason: very low reliance on debt. Over the past decade, the debt ratio has remained in a narrow and conservative range, roughly between 0.08 and 0.18, never approaching levels that would signal balance-sheet stress.
The chart shows a gradual increase into the early 2020s, peaking around market-cycle highs, followed by a modest pullback. There are no sharp spikes, no emergency borrowing, and no signs of leverage being used to mask operational weakness or fund dividends.
This is exactly what you want to see from an asset manager. TROW runs a capital-light business, generates strong operating cash flow, and does not need debt to sustain operations, dividends, or shareholder returns. Even during market downturns, the balance sheet remains clean and flexible.
Low leverage also gives management optionality — the ability to absorb earnings volatility, continue dividend payments, and avoid forced cost-cutting or dilution when markets turn unfavorable.
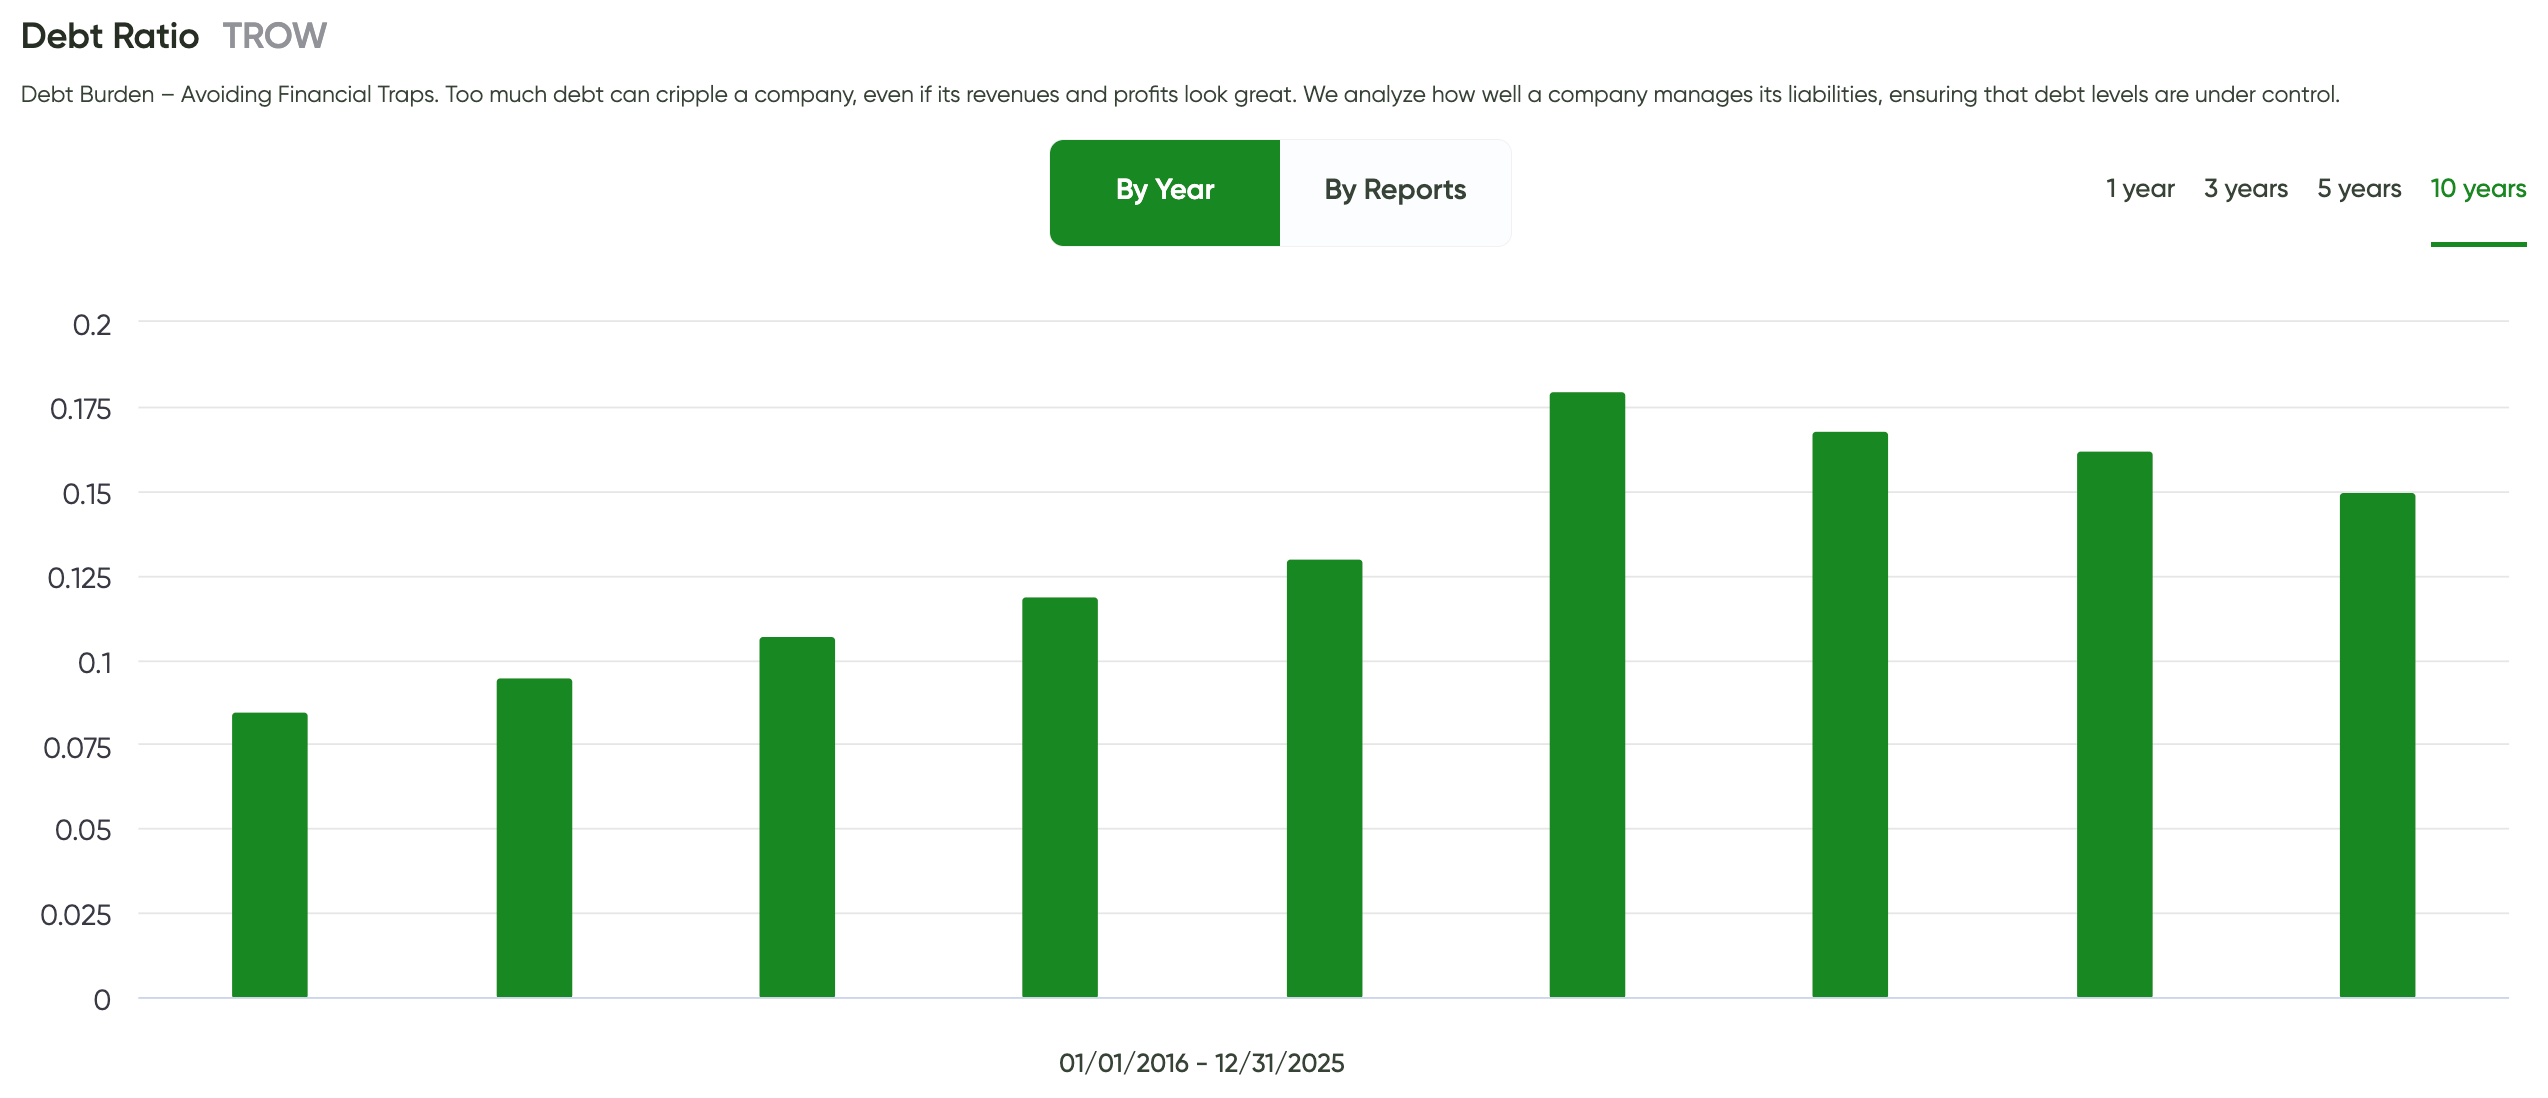
✅ Debt Burden Passed — T. Rowe Price maintains a conservative balance sheet with minimal leverage, no structural risk, and ample flexibility to support dividends across full market cycles.
Bottom Line: The Company Financial Condition?
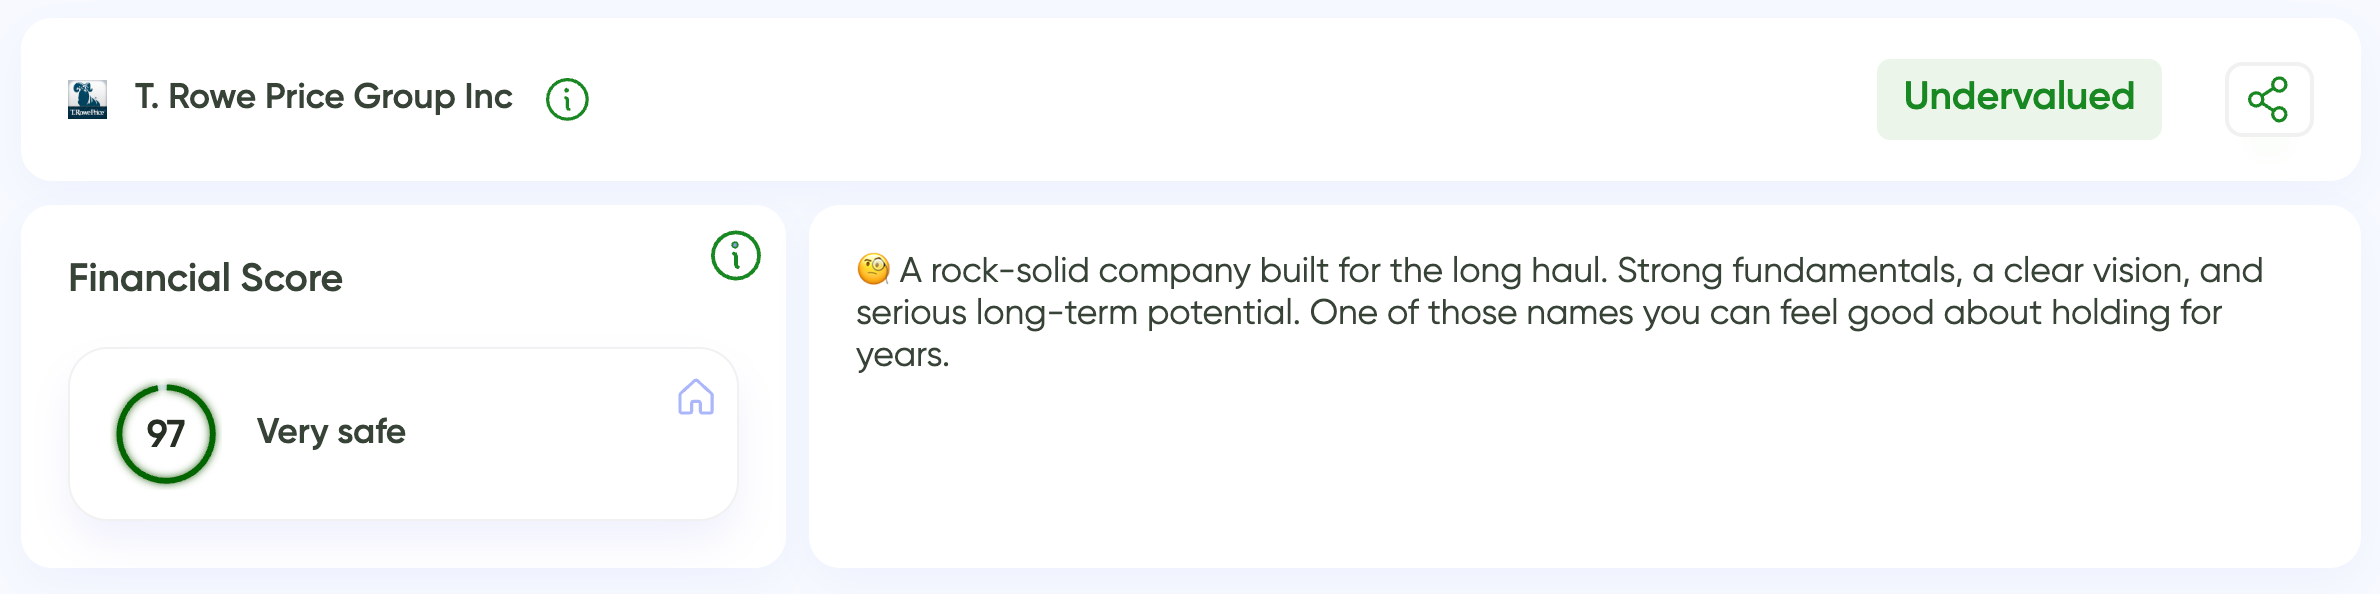
Financial Score 90+ ✅
Think of this as a fast health check for the business. The higher the score, the stronger and safer the company looks across all key financial dimensions. A score in the high-90s signals exceptional balance-sheet strength and long-term durability.
MaxDividends Five-Pillar Secret Formula. Step 2 - ✅
By our Five-Pillar Formula, T. Rowe Price screens as a top-tier dividend business: solid long-term revenue generation tied to asset management fees, strong and consistently high profitability, healthy net income across cycles, a well-covered and conservative dividend payout, and an exceptionally clean balance sheet with minimal leverage.
The Financial Score inside MaxDividends combines all five pillars into a single number, giving a clear, at-a-glance view of overall financial safety.
✅ Passed: T. Rowe Price Group (TROW) — A financially disciplined, low-debt asset manager built to endure market cycles, making it a strong candidate for a long-term, dividend-focused portfolio.
Does It Fit My Plan?
Finding the Right Role for Every Dividend Stock – MaxRatio
Dividend stocks aren’t one-size-fits-all — and that diversity is precisely what enables you to construct a portfolio tailored to your exact needs. Some companies are engineered for aggressive capital expansion, while others deliver a harmonious blend of appreciation and reliable payouts. A select few are optimized exclusively for generating consistent cash flow today.
That’s where MaxRatio comes in. It cuts through the clutter and reveals what each stock actually delivers. The metric weighs three critical factors: the yield you receive today, how aggressively the dividend is expanding, and the underlying financial health of the business.
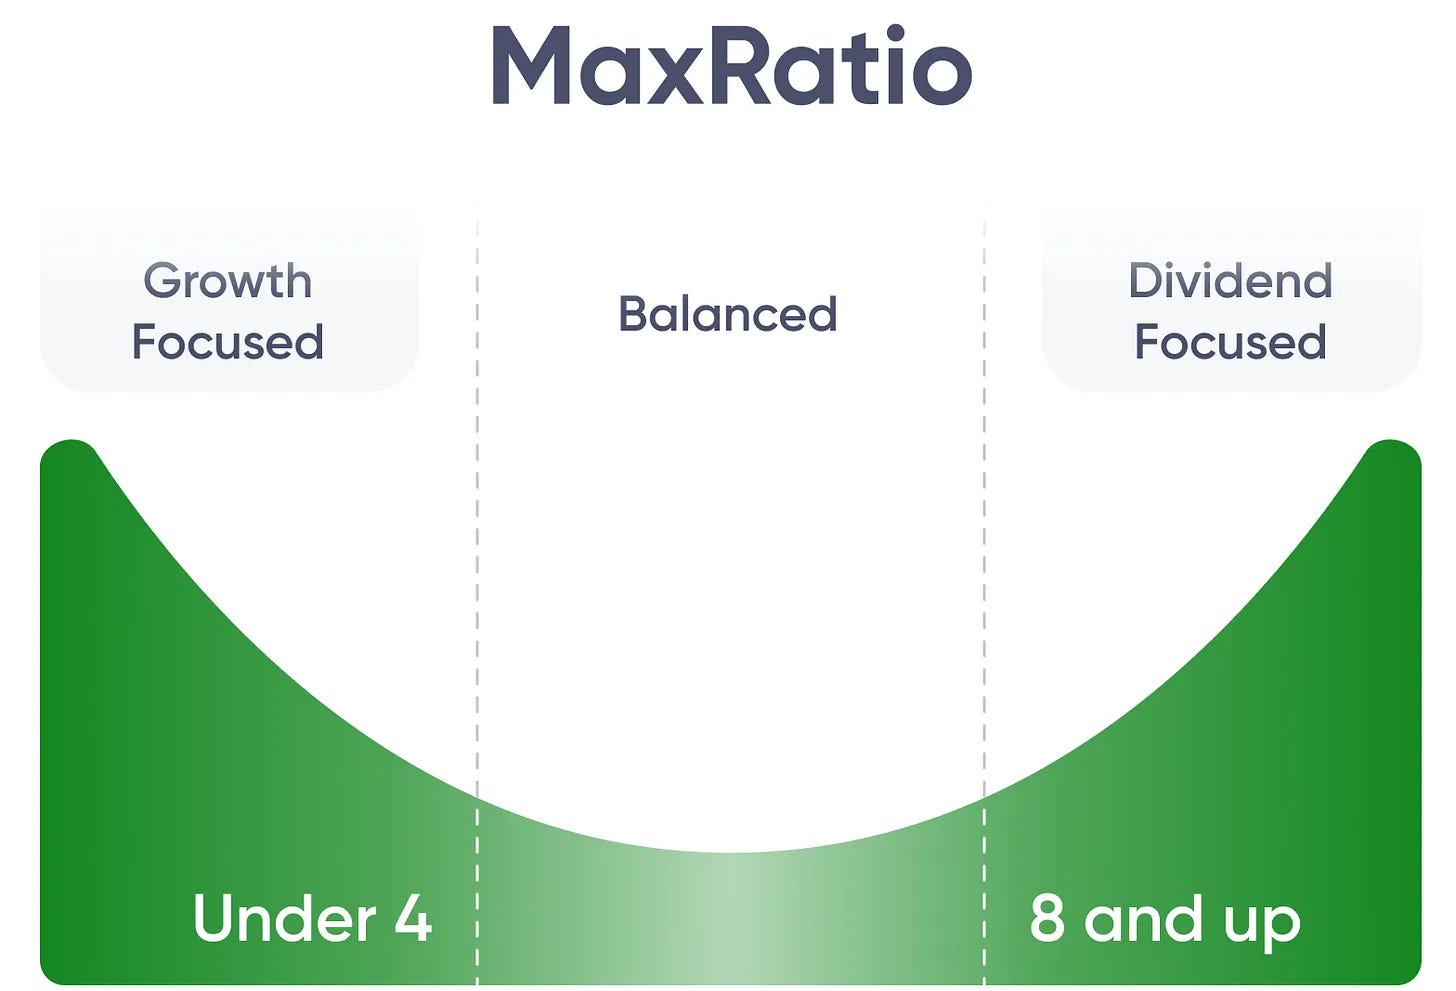
These three dimensions together tell you whether a stock should function as your growth accelerator, a steady value creator that compounds both gains and income, or your primary cash machine.
🚀 Growth Eagles (MaxRatio below 4) — These prioritize appreciation. Current yields may look modest, but they signal a healthy, durable business. You’re building serious long-term wealth while your dividend quietly compounds into tomorrow’s income stream.
⚖️ Balanced Eagles (MaxRatio 4–8) — The middle path. You earn meaningful dividends right now while watching those payments climb steadily, creating compounding on both your capital and your cash receipts.
💵 Income Eagles (MaxRatio 8+) — Pure income generators. These deliver fat yields today while adding steady, predictable growth — the perfect choice if your priority is hassle-free, dependable cash production.
MaxRatio exists for one reason: it lets you place each dividend holding into its proper role and assemble a portfolio that mirrors your personal objectives — whether you’re chasing explosive growth, seeking balanced gains plus regular payments, or maximizing today’s passive income stream.
Let’s Look at T. Rowe Price Group (TROW)
In the MaxDividends App, head to Company Analytics and place the Financial Score next to MaxRatio. That’s where TROW’s role becomes very clear.
Here’s what we see:
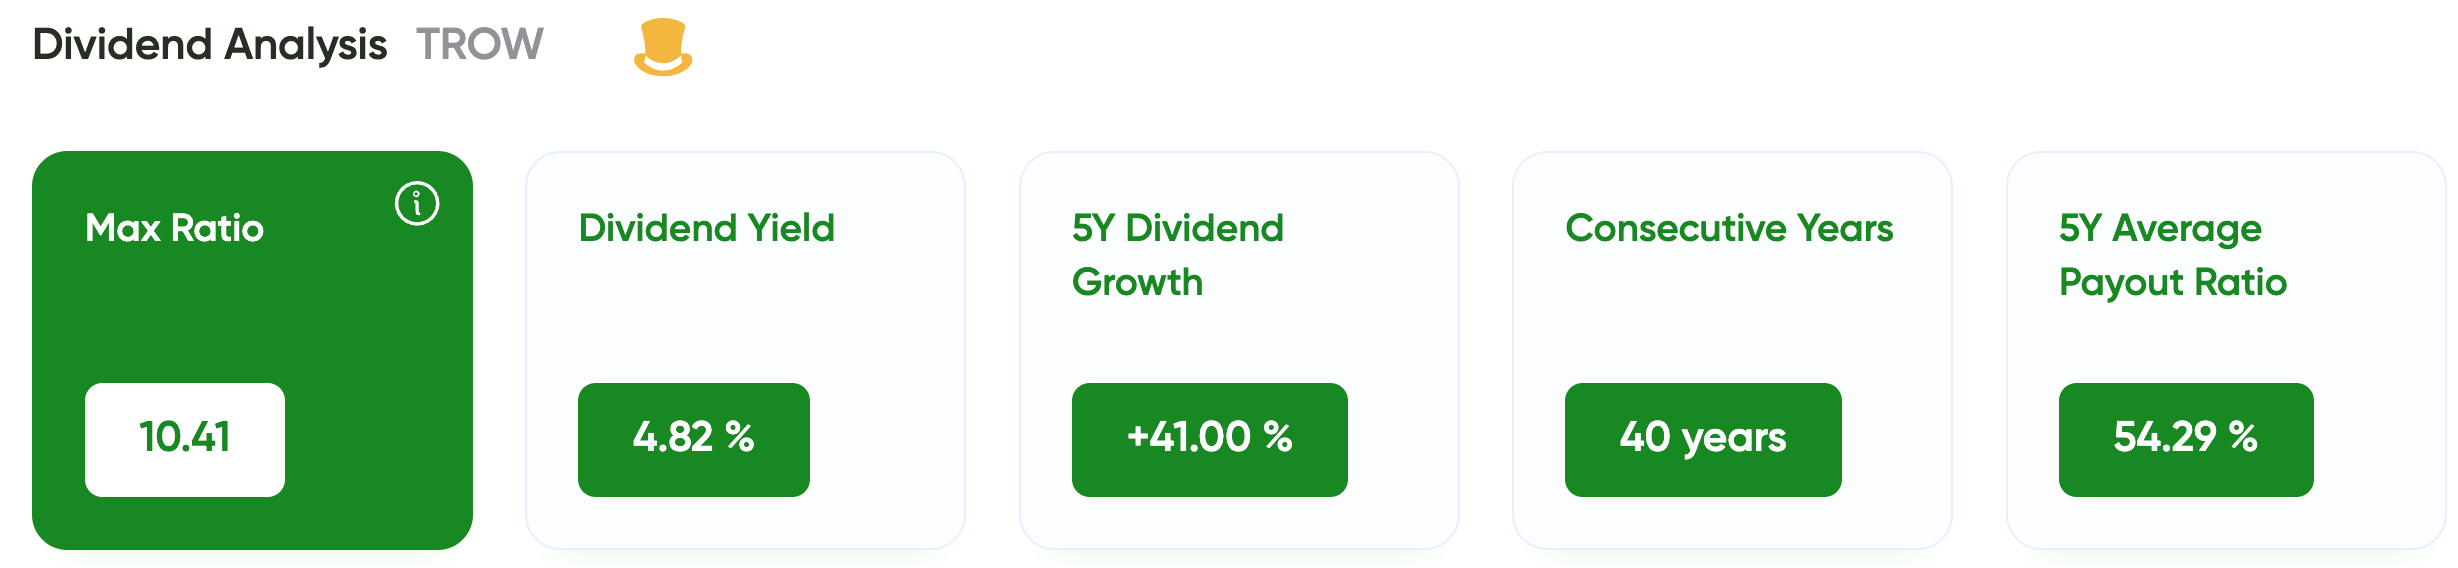
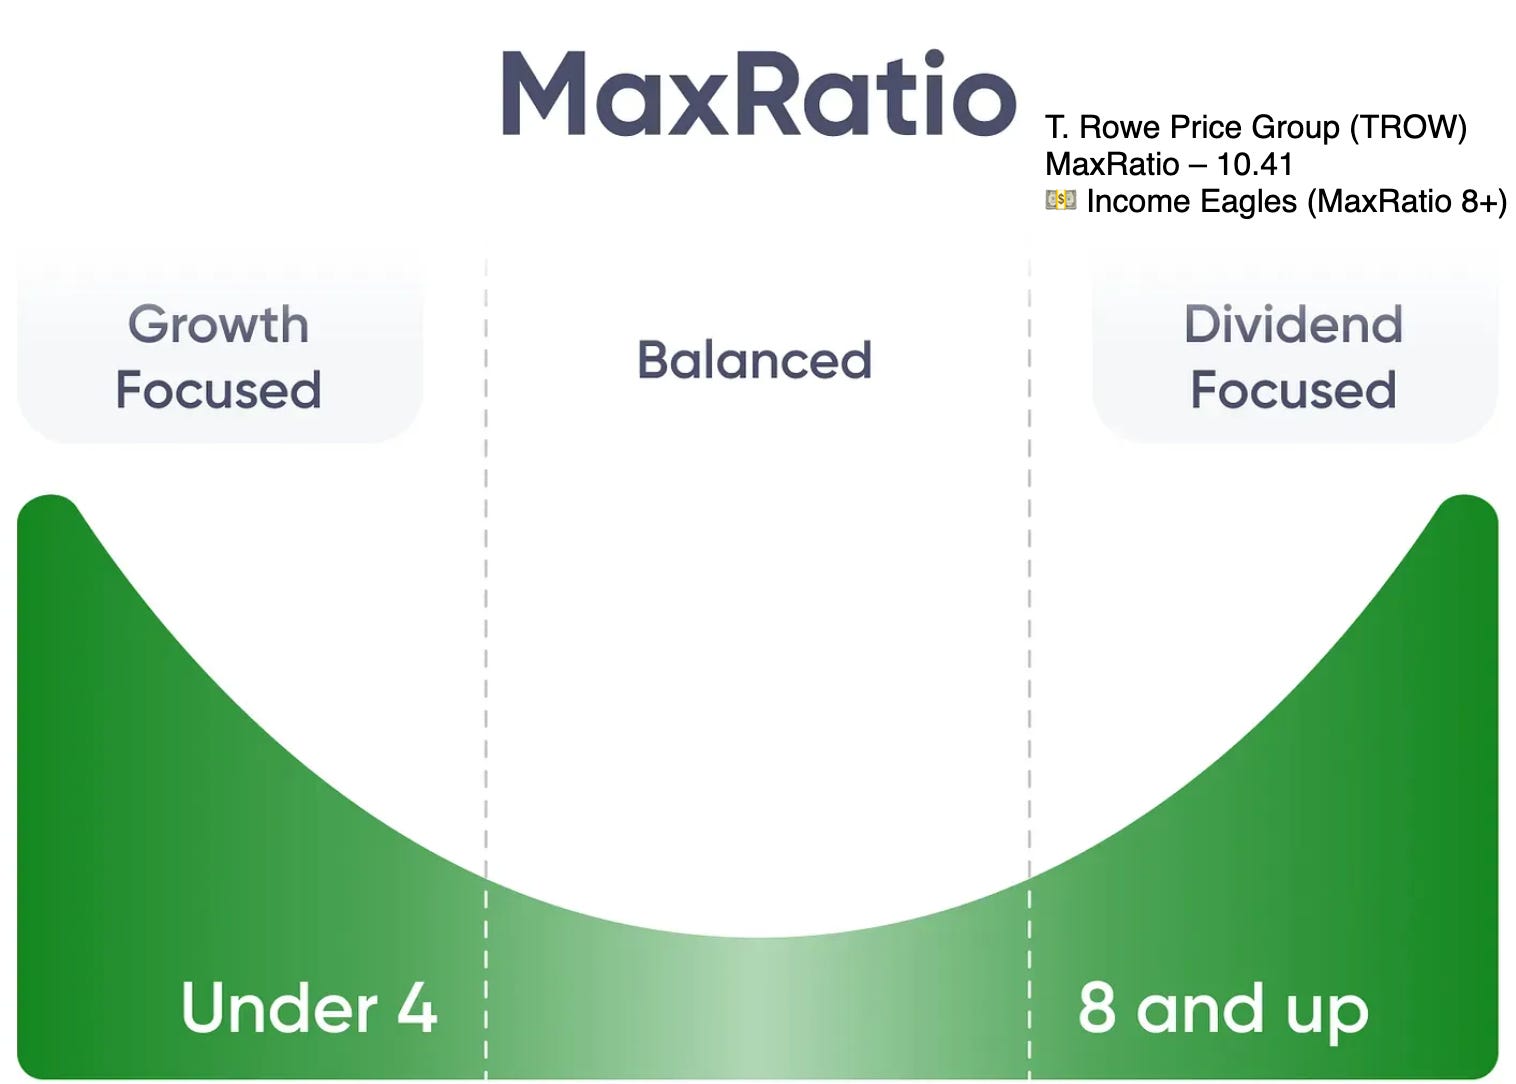
MaxRatio: 10.41
Dividend Yield: 4.82%
5Y Dividend Growth: +41% (cumulative)
Consecutive Dividend Years: 40
5Y Average Payout Ratio: 54.29%
With a MaxRatio above 10, TROW clearly sits in the Income Eagle category.
What that means in practice:
a near-5% yield that delivers immediate, noticeable cash flow;
solid dividend growth history, even through market cycles;
a moderate payout ratio, leaving room to sustain dividends during downturns;
a long dividend record without stretching the balance sheet.
T. Rowe Price works best as a high-quality income engine — a position that prioritizes cash generation today while still offering respectable long-term durability. It’s not a growth story, and it doesn’t need to be.
💵 Is the Stock Undervalued Today?
Cheaper than competitors?
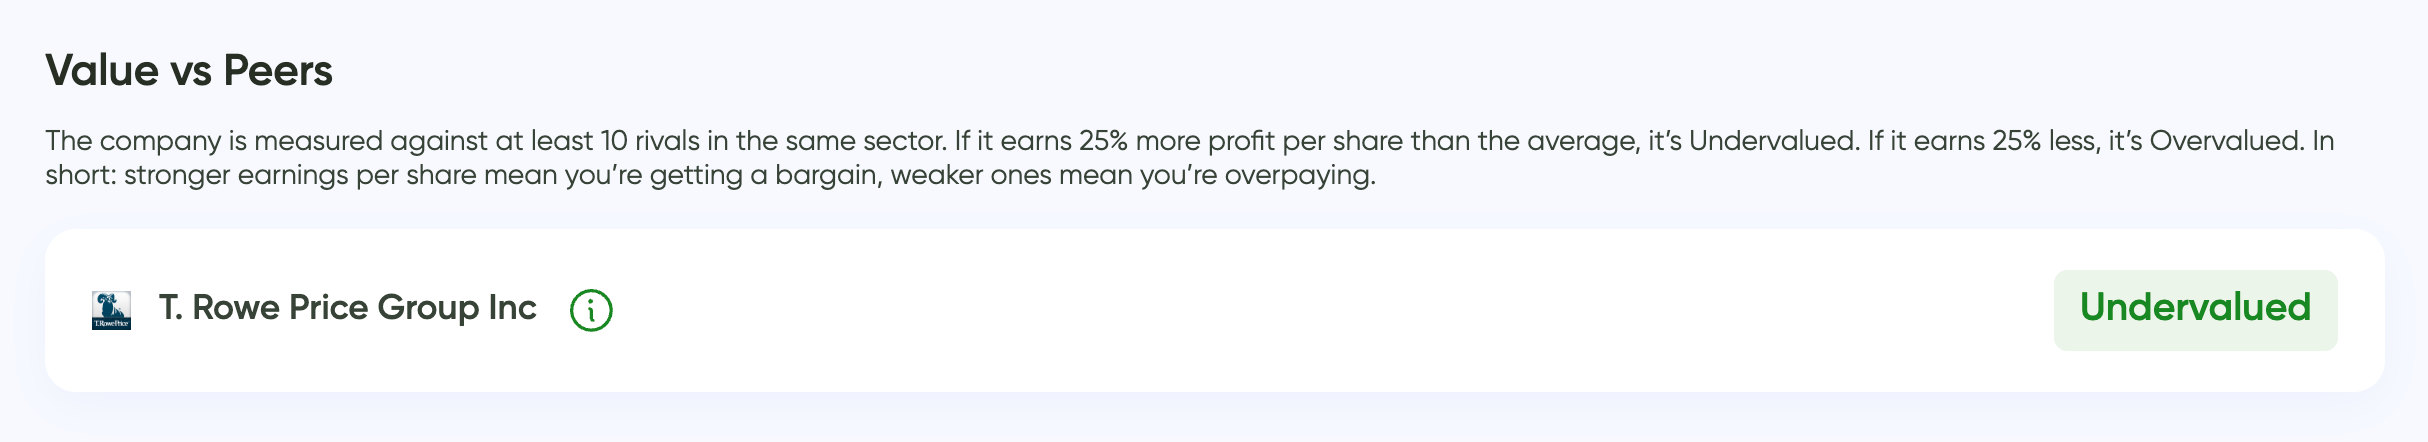
🟢 According to the MaxDividends App, T. Rowe Price Group (TROW) is Undervalued vs. its peers.
In simple terms, the market is pricing TROW below what its earnings power suggests compared to similar companies in the same sector.
Cheaper than its own history?
🟢 Yes — meaningfully cheaper vs. its own 10-year average.
The MaxDividends chart shows that TROW has historically traded at a higher P/E multiple. Today, the stock sits well below its long-term average valuation, which suggests investors are currently paying less per dollar of earnings than usual.
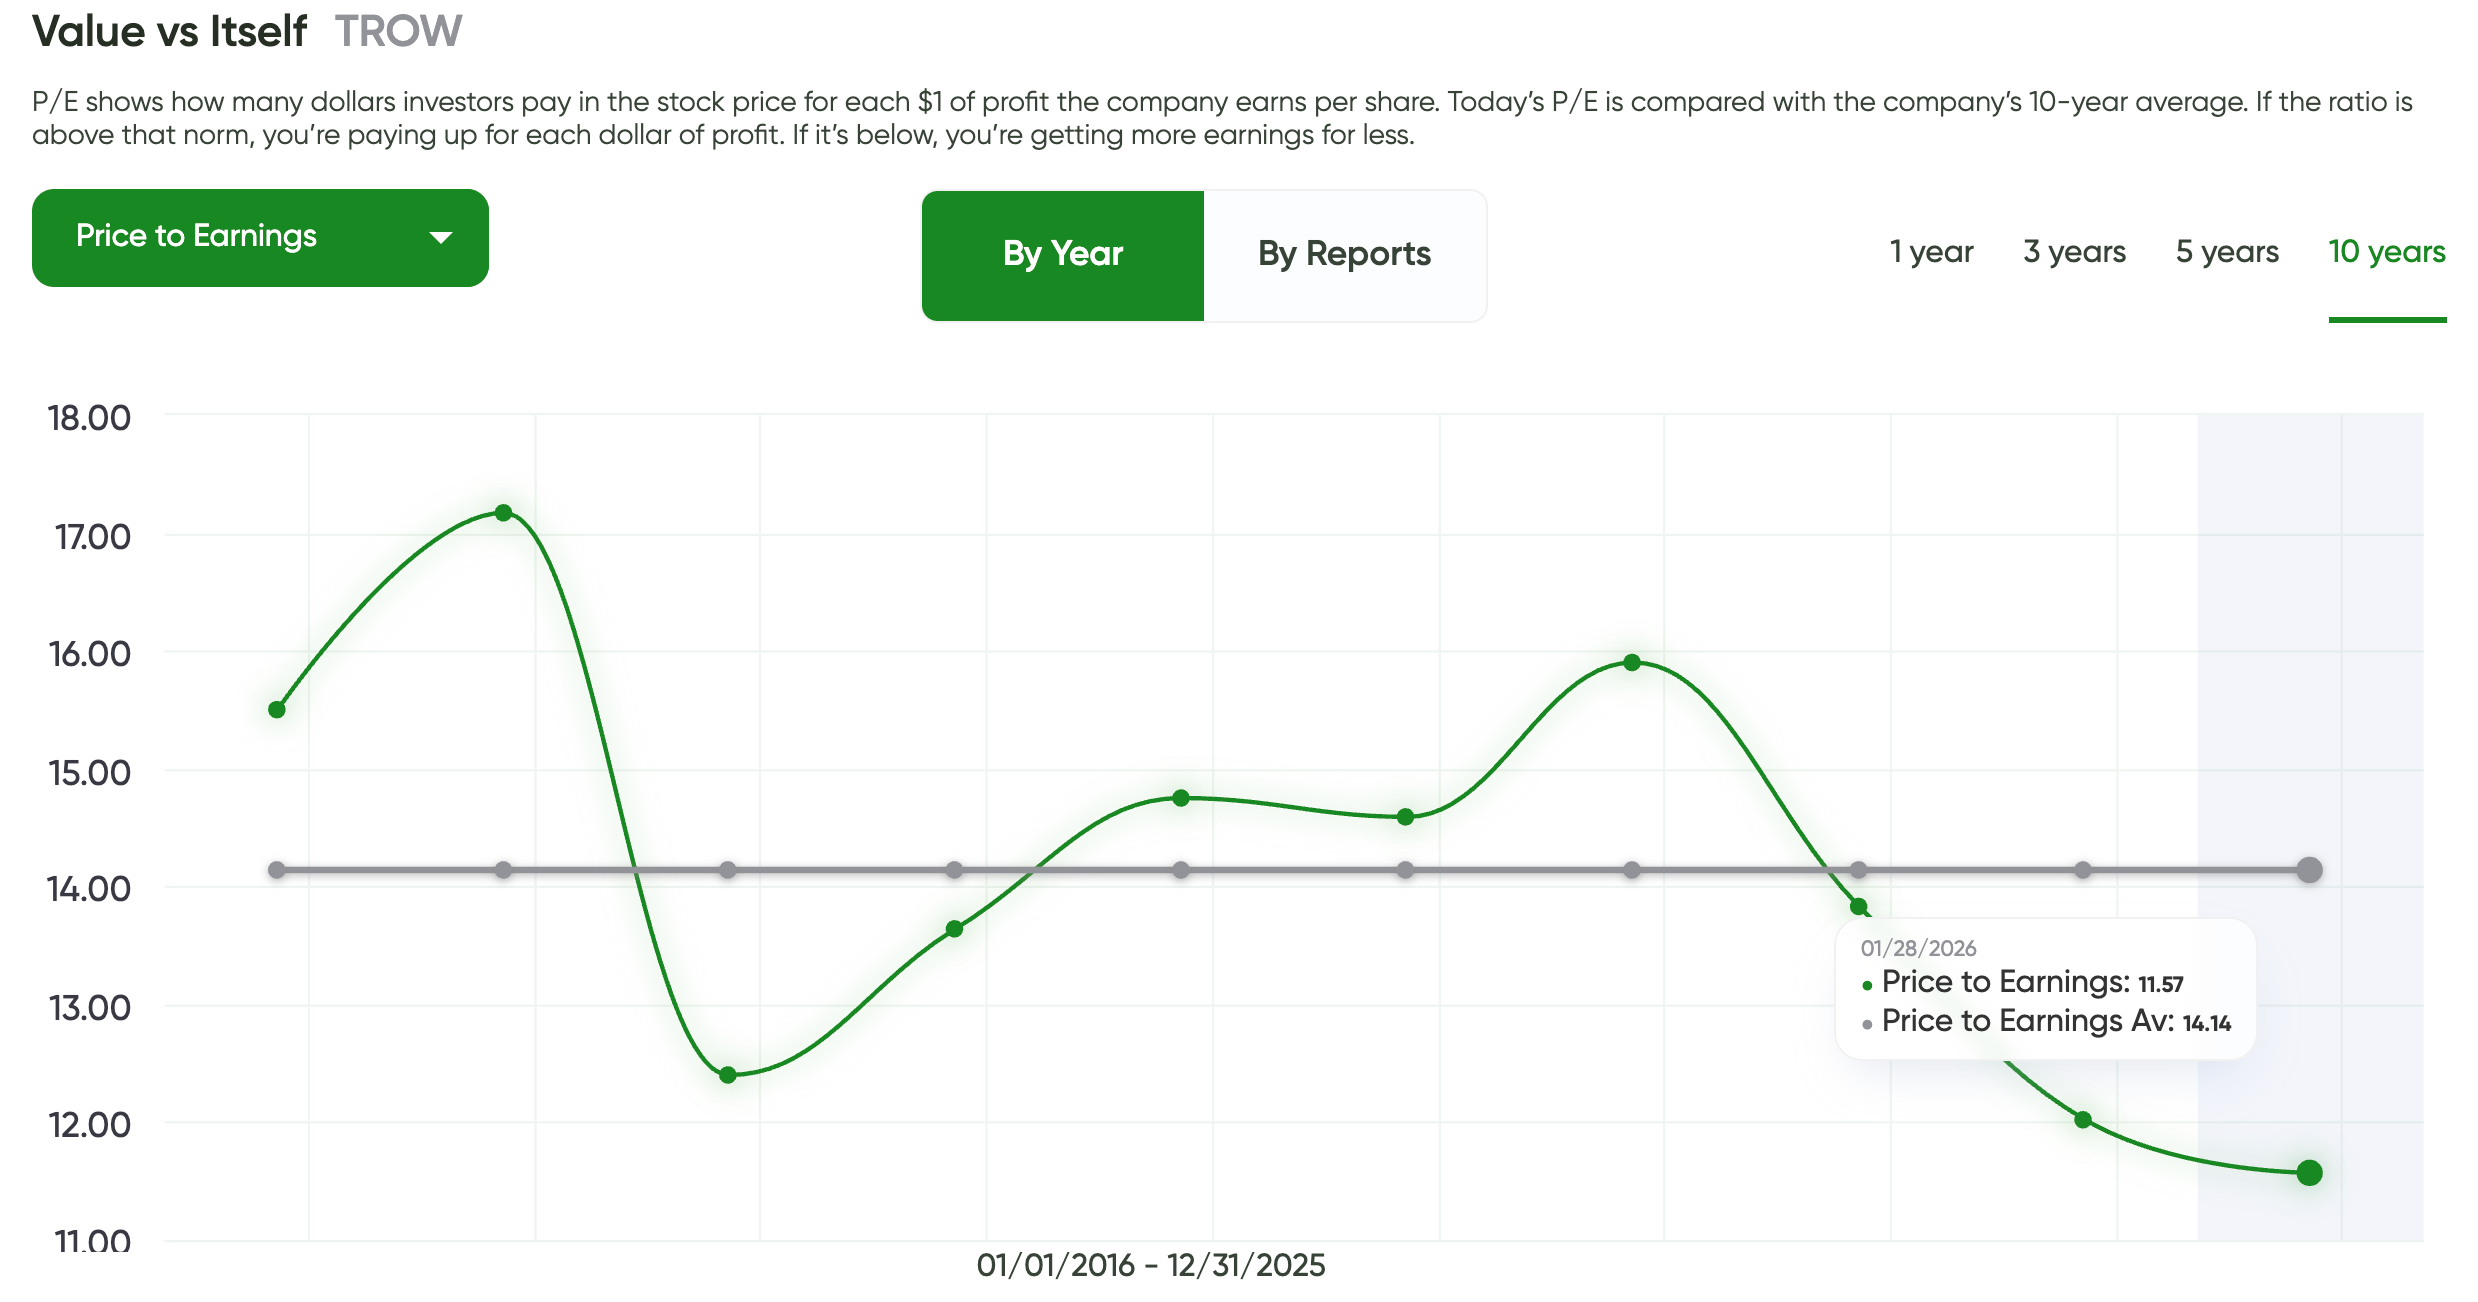
In plain English: this is one of those moments when a high-quality, conservatively run company is priced more like a cyclical business. That gap creates opportunity — assuming the business remains intact.
Better Yield Than Usual?
🟢 Yes — yield is well above its long-term average.
TROW’s current dividend yield is around 4.8%, compared to a long-term average closer to 3.1%. The chart shows that yields at this level have historically appeared during periods of market stress or pessimism — not during normal conditions.
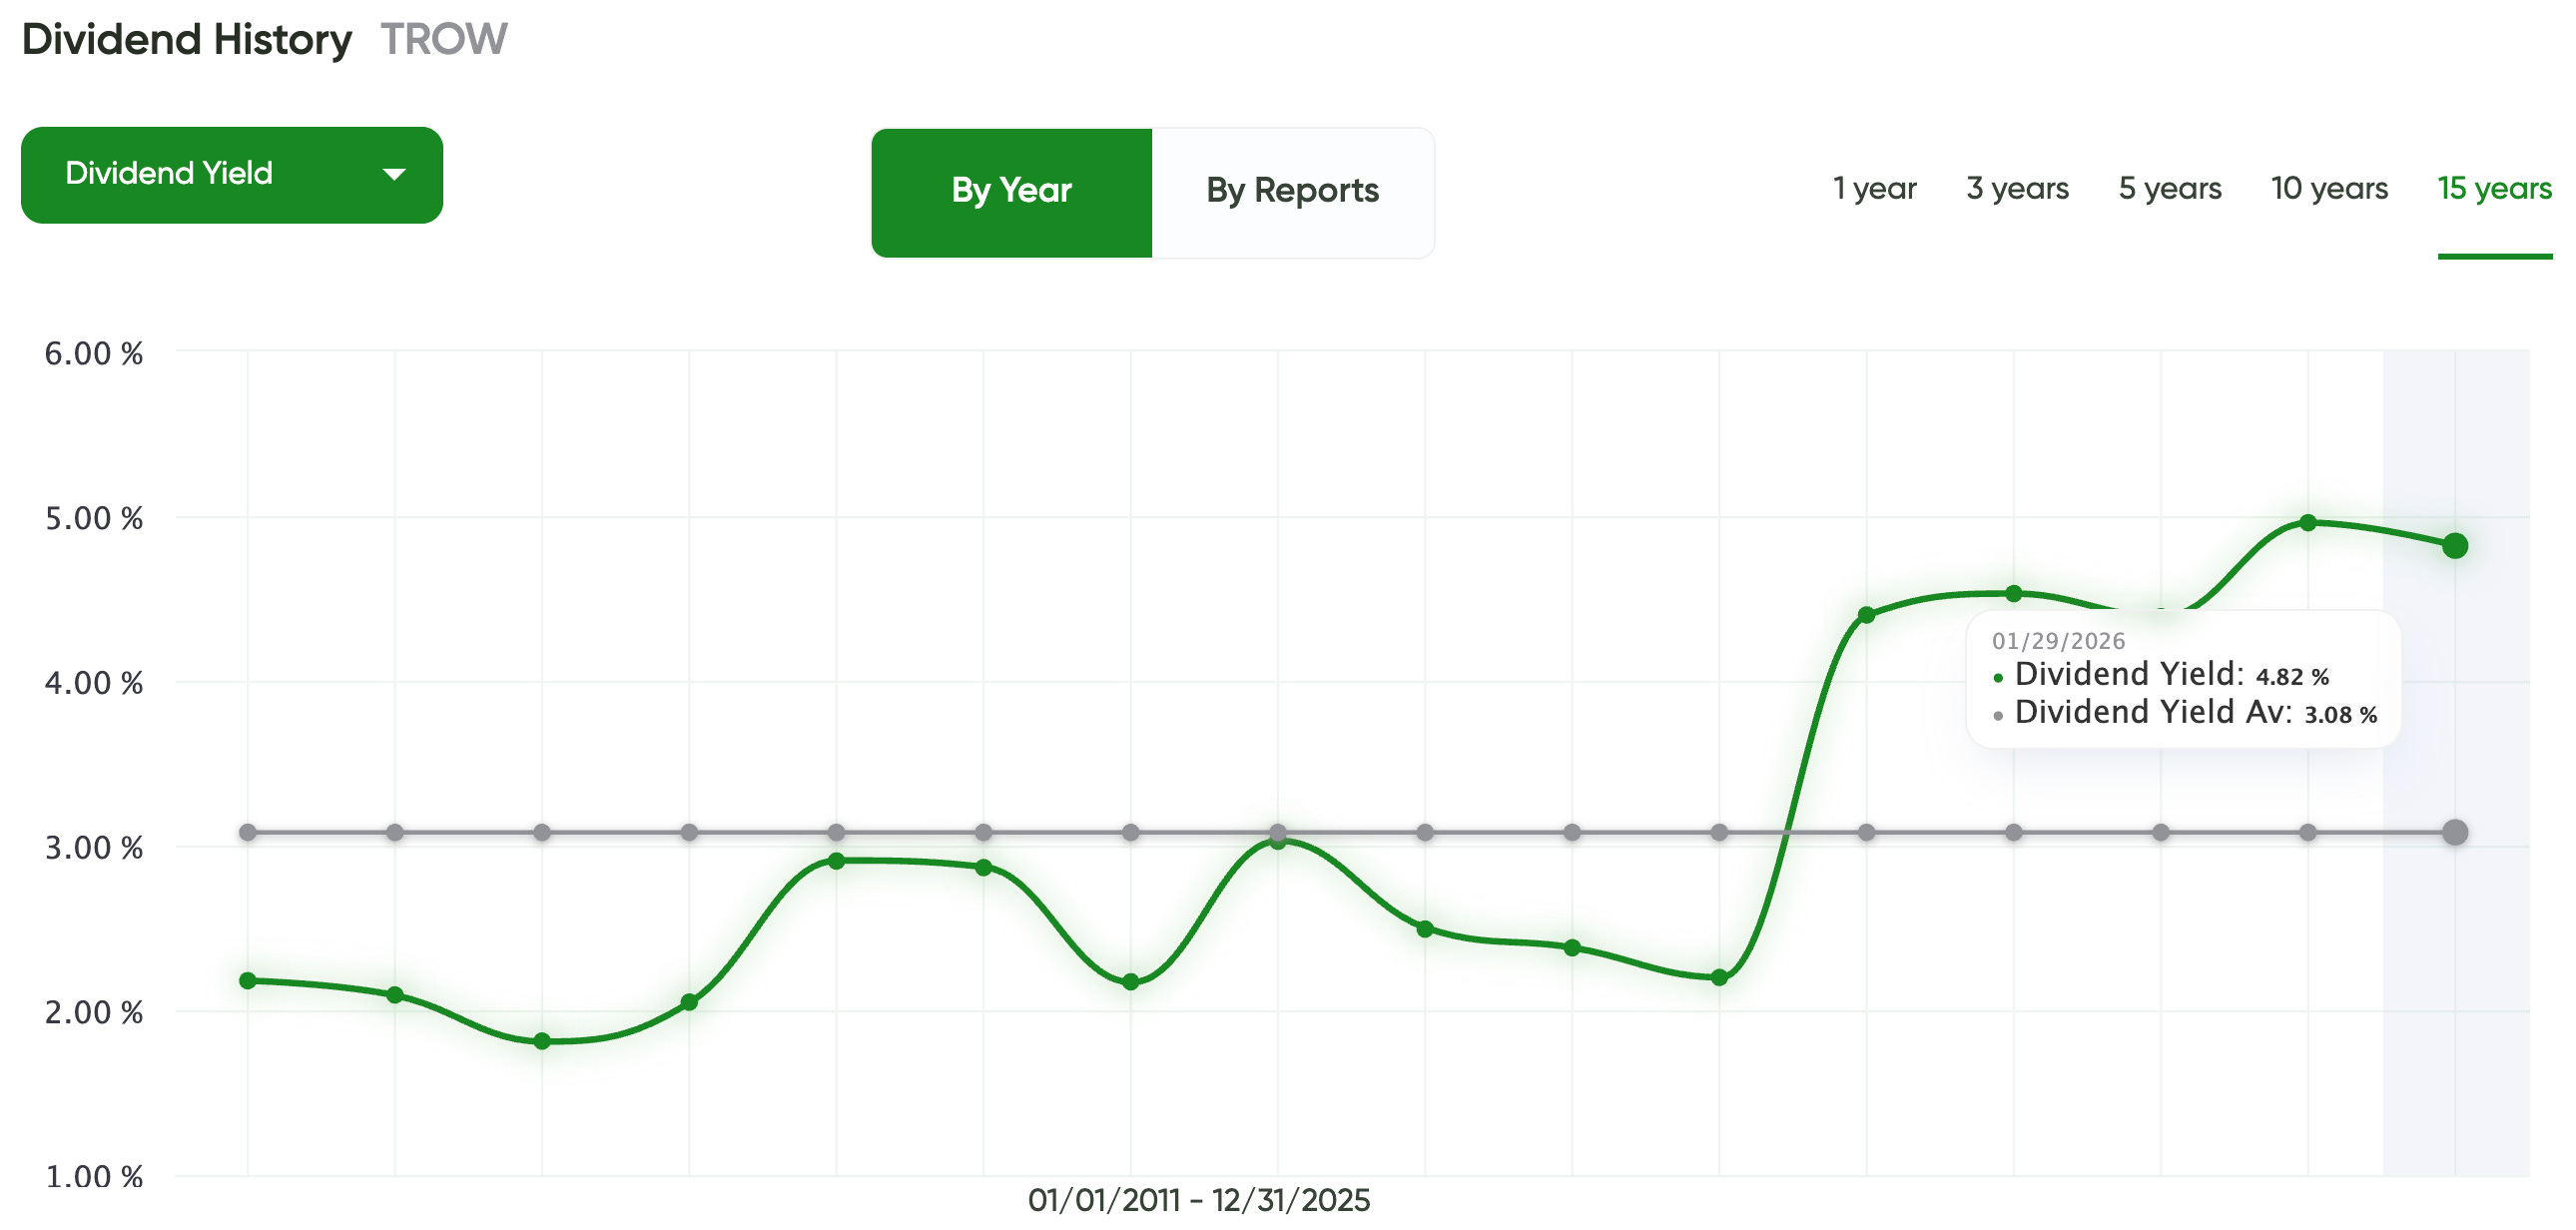
In plain English: you’re getting paid significantly more than usual to own this company today. For a financially strong Dividend Aristocrat-style payer with no debt pressure, that’s a real advantage — not just a cosmetic one.
Analyst Consensus
🟡 Analysts see limited upside — expectations are muted.
Based on coverage from 11 Wall Street analysts, T. Rowe Price Group currently carries a Sell consensus. The average 12-month price target is $105.82, very close to the recent price around $105.25, implying only ~+0.5% upside.
Targets are widely dispersed — from $80 on the low end to $128 on the high end — which signals uncertainty rather than conviction. In short, professionals are not expecting meaningful capital appreciation in the near term.
This setup fits a yield-and-patience story, not a momentum or rerating trade.
Is This One for Me?
Here’s how T. Rowe Price Group stacks up under the MaxDividends lens:
How This Company Makes Money?
Do I clearly understand how TROW earns its money — and does the business make sense?
🟢 Yes.
TROW is a global asset manager. It earns fees by managing mutual funds, retirement accounts, and investment strategies for individuals and institutions. Revenue is driven by assets under management (AUM), long-term client relationships, and investment performance.
It’s a clean, capital-light model — but cyclical. When markets fall, AUM and fee income usually follow.
Is This a Good Stock to Buy Long Term?
Has the company shown the kind of consistency and resilience I want to see?
🟢 Yes — from a financial strength perspective.
TROW carries a Financial Score of 97 in the MaxDividends App, has no long-term debt, strong margins, and a long history of dividend growth. The balance sheet is exceptionally conservative.
However, earnings are market-sensitive, so patience is required during weaker cycles.
Is the Stock Undervalued Today? 💵
🟢 Mostly favorable:
Vs peers: Undervalued
Vs its own history: Trading below its 10-year average P/E
Yield: ~4.8%, well above its long-term average (~3.1%)
This is not a growth bargain — it’s a cash-flow and yield opportunity created by market pessimism toward asset managers.
Does It Fit Your Plan?
Not every dividend stock has the same job.
With a high current yield, conservative payout structure, and slow-to-moderate dividend growth expectations, TROW sits firmly in the Income Builder / Defensive Yield bucket:
pays you a strong yield today
offers long-term dividend growth, but not at a fast pace
requires comfort with market-driven earnings swings
TROW fits best if your plan includes:
harvesting elevated income from high-quality companies
buying strong balance sheets during cyclical pressure
holding through market cycles, not trading analyst targets
It may be less ideal if you’re:
focused on short-term upside
looking for fast dividend growth
relying heavily on analyst sentiment as a buy signal
Used correctly, T. Rowe Price Group is a “paid-to-wait” dividend stock — a financially elite company offering above-normal income today, while markets remain skeptical.
Final Take
With a MaxRatio above 10, a near-5% dividend yield, and a payout ratio that leaves room for resilience, TROW is exactly the kind of income engine we love in MaxDividends portfolios. It delivers cash flow today while offering reasonable long-term durability — not a growth sprint, but a steady, reliable contributor to passive income.
Personally, I’m not looking for rapid capital gains with TROW. This stock is about collecting above-average dividends from a high-quality, low-debt company, even if markets wobble. Patience is key here. You’re paid to wait — literally.
At the core, my focus remains on businesses where dividends are structurally protected, and TROW fits that mold beautifully: financially elite, market-aware, and income-focused.
***
The same simple formula works for any stock. No hype, no noise — just clear steps that let you see whether a company truly fits your plan.
And the best part? This isn’t theory. It’s all already built into the MaxDividends app: the Financial Score, the MaxRatio, the Top Dividend Eagles list, and even my own personal shortlist. Everything in one place, ready whenever you are.
MaxDividends is a treasure chest for dividend investors of any size and focus. Whether you’re after growth, balance, or pure income, you’ll find the tools and the community to back you up.
This series of case studies is here to show you just how simple — and powerful — dividend investing can be. One stock at a time, you’ll see the clarity, the confidence, and the peace of mind that comes from building your own growing stream of passive income.
Everything you’ve just read about — the dividend intelligence, the quality filters, the structured selection process, the portfolio tracking, the income optimization — is fully integrated inside the MaxDividends App.
The App brings together the strategy, the screening logic, the risk controls, the Dividend Eagles lists, and the Income Assistant into one structured environment. It’s where analysis turns into decisions, and decisions turn into measurable income.
Everything works together in one place, designed to make disciplined dividend investing clear, manageable, and repeatable over time.
If you want access to the full system — it begins inside the platform.
🔓 Request Free Early Access to the MaxDividends App 🔓
Unlock instant 🎁 access to the MaxDividends Income System & App, featuring our top undervalued dividend picks and the most promising dividend ideas for 2026.
With respect for your well-being,
Max