


Dividend Score
MaxDividends Interim Study, 2023–2026
In late 2022, MaxDividends began recording and tracking our proprietary metrics within the project. Since then, we have collected data as the metrics are updated, building a history of scores recorded during our ongoing work.
We now have data covering the beginning of 2023 through October 2026. We used this history to conduct our Dividend Score study and plan to update it annually using the same methodology.
We set out to examine how Dividend Score relates to two outcomes that matter to dividend investors: payout stability and growth in dividend income.
The study has three sections: the U.S. market, global markets excluding the U.S., and combined results. Each section compares three groups: Dividend Score 90+, Dividend Score 80+, and Dividend Score 80−.
Dividend Score
U.S. Market
How We Conducted the Study
We selected U.S. companies that, based on the 2023 Consecutive Years metric in the spreadsheet, had increased their dividends every year for at least 10 consecutive years. Companies also needed Dividend Score data for all four years: 2023, 2024, 2025, and 2026.
The initial sample contained 395 companies.
For the comparison, we used three initial groups without rounding the scores:
Dividend Score 90+: companies with scores of 90 or higher.
Dividend Score 80+: companies with scores of 80 or higher.
Dividend Score 80−: companies with scores of 79 or lower.
Companies with scores of 90 or higher also belong to the 80+ group. We show them separately to examine whether a higher initial score is associated with different results. The company counts for these two groups should not be added together.
We then tracked regular dividends from January 1, 2023, through October 7, 2026: how many companies reduced or eliminated their payouts and how much their dividends grew.
We also accounted for changes in the score. If a company initially had a score of 80 or higher, its score subsequently fell below 80, and it later cut its dividend, we reassigned it to the 80− group. If that company’s initial score was 90 or higher, it was also removed from the final 90+ group.
After the adjustments, the Dividend Score 90+ group contained 202 companies, the 80+ group contained 312, and the 80− group contained 75.
What the Comparison Showed
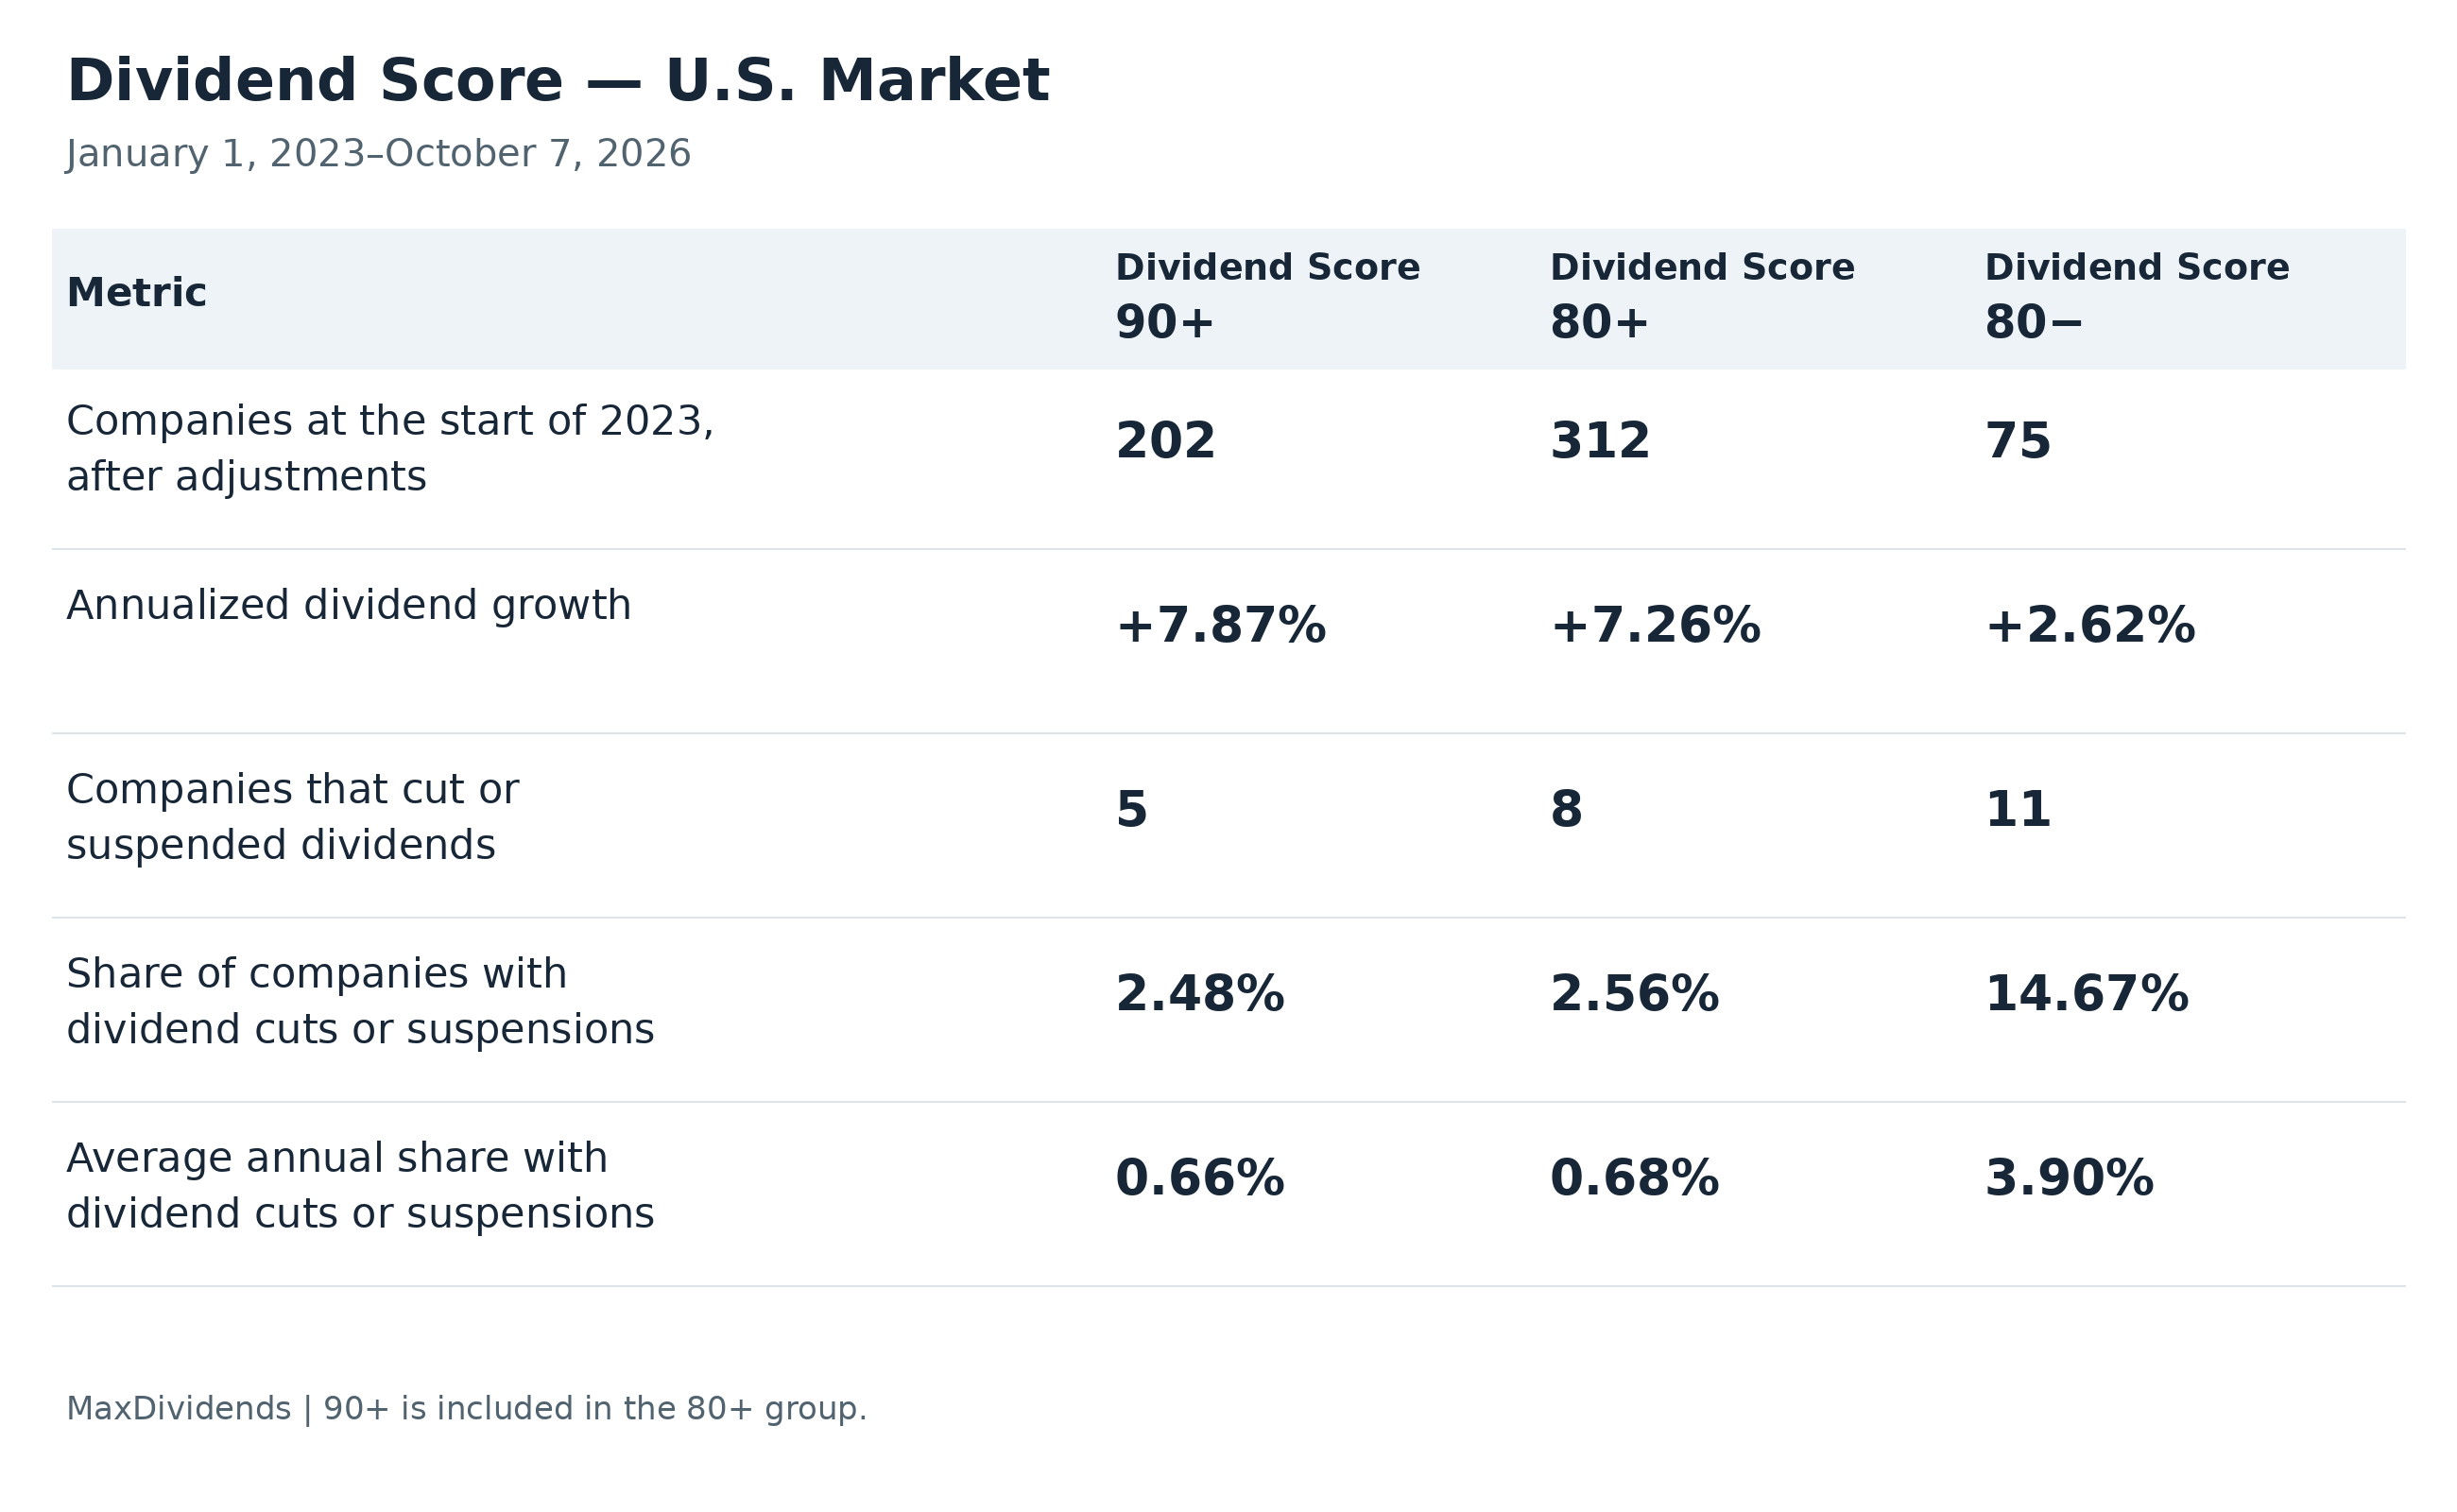
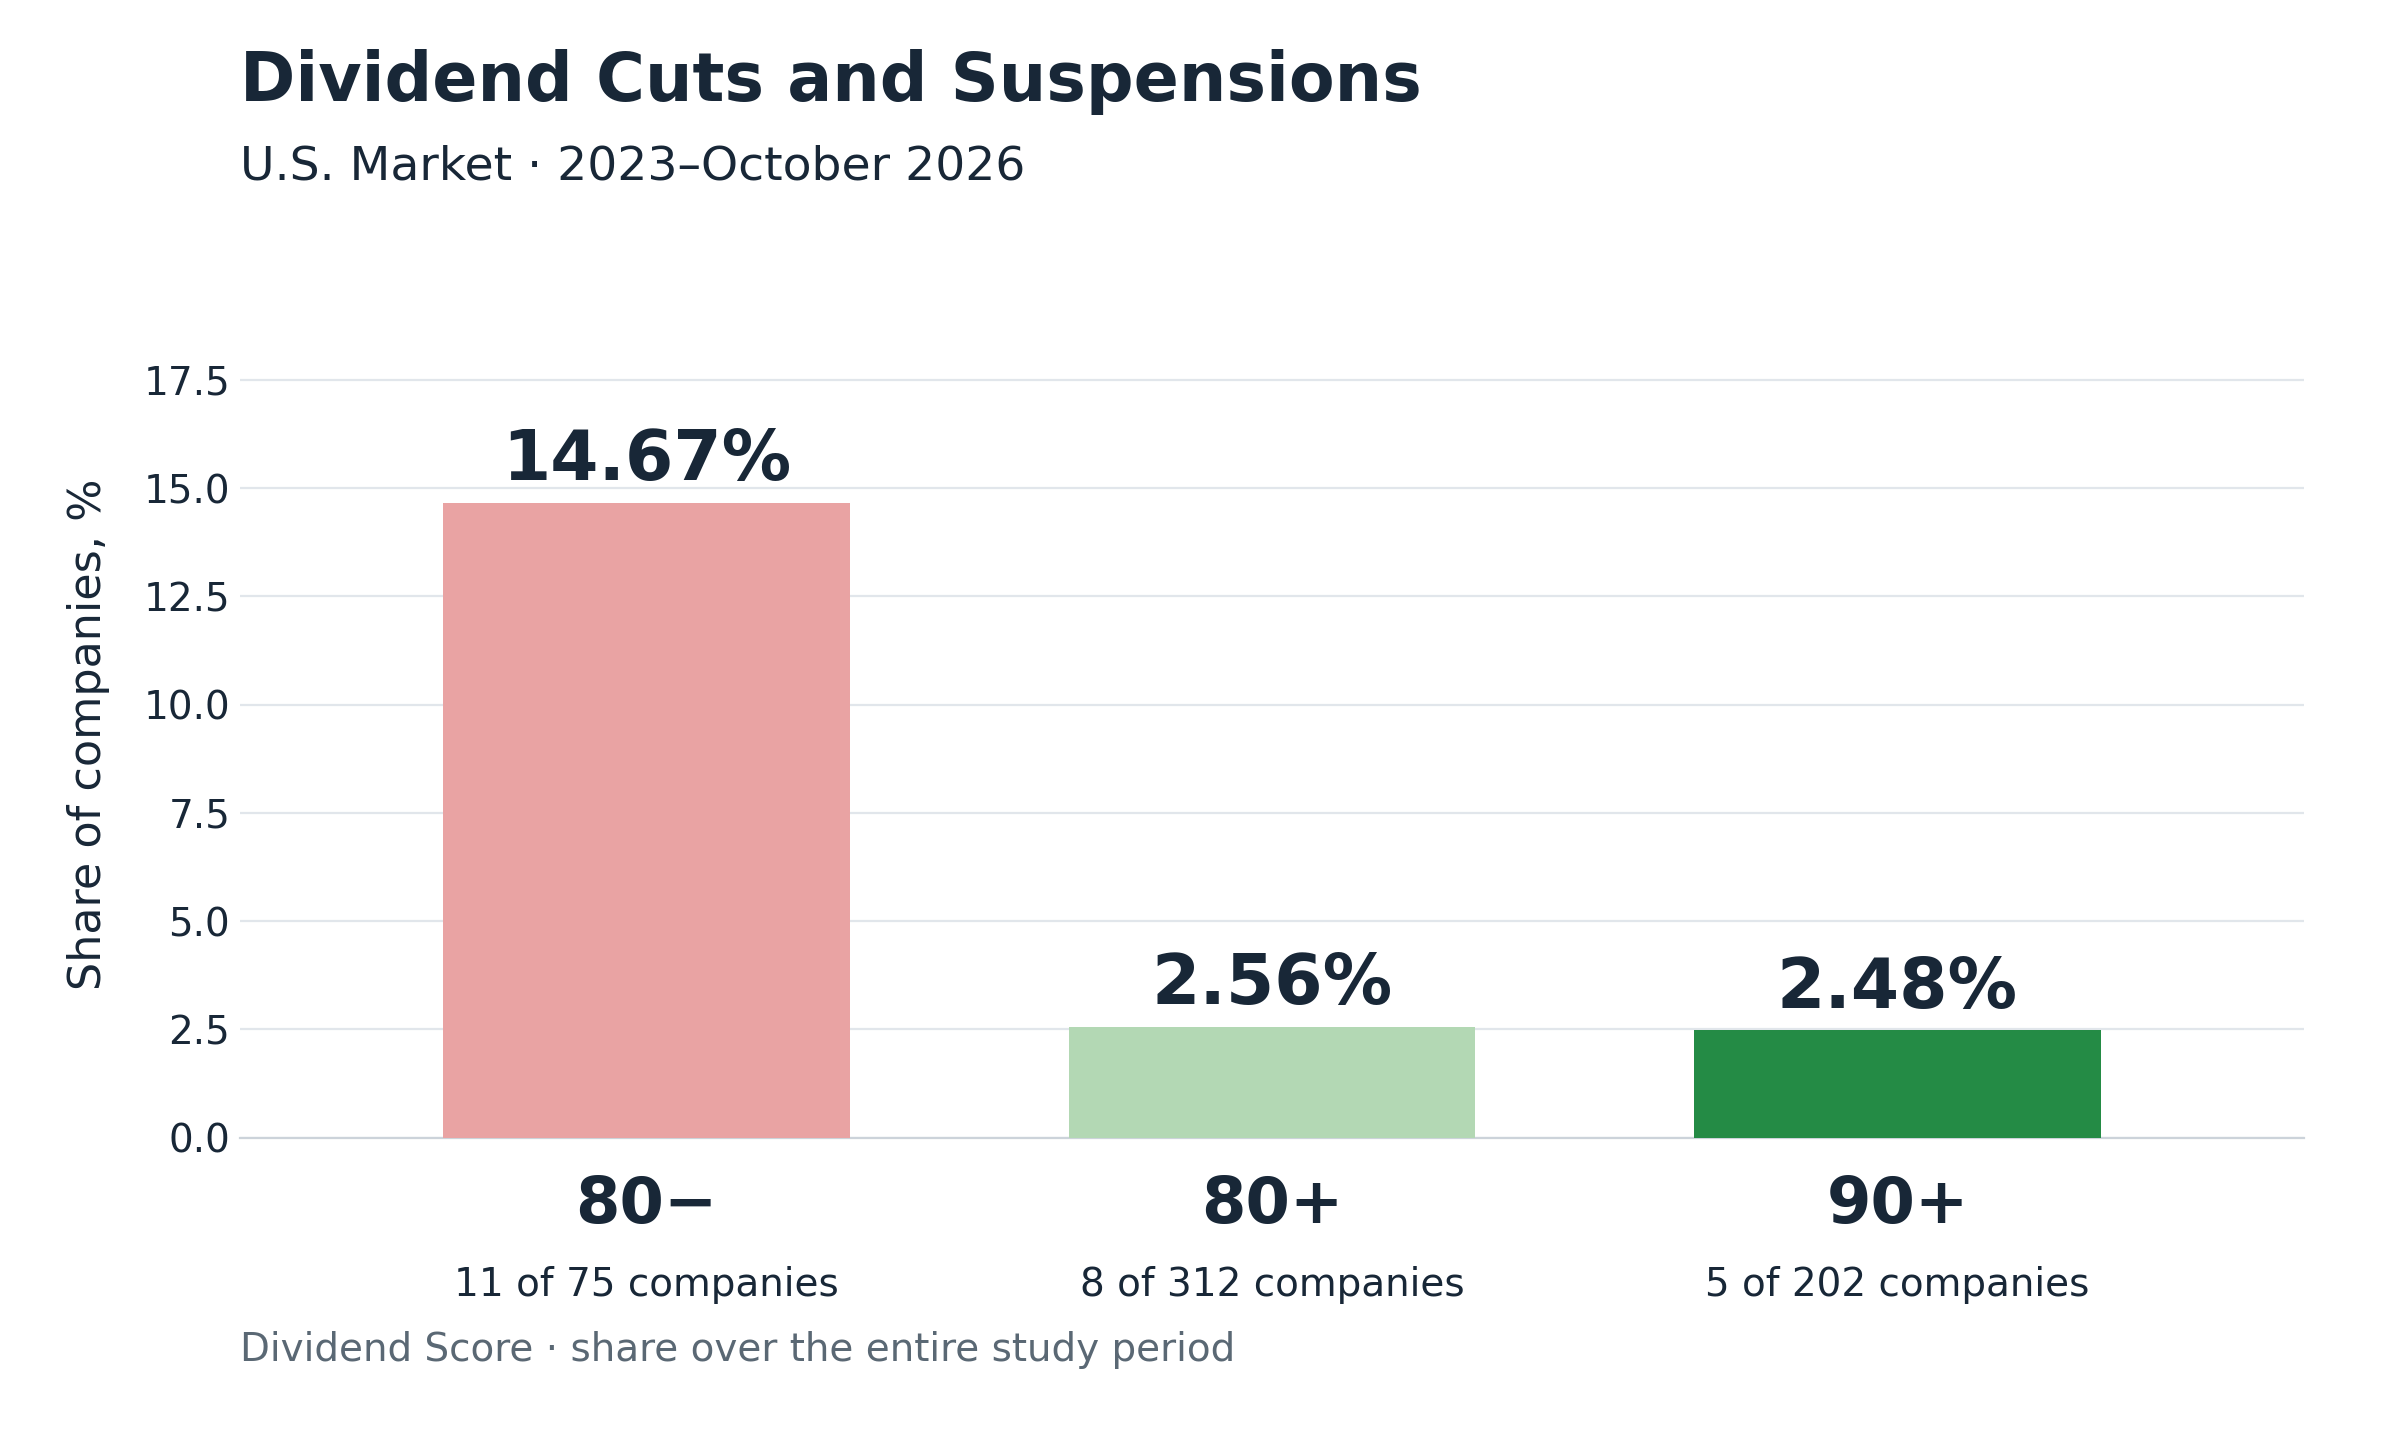
To make the difference easier to see, imagine 100 companies in each group. Over the entire study period of almost four years, approximately:
2–3 companies in the Dividend Score 90+ group would have reduced or eliminated their dividends;
3 companies in the Dividend Score 80+ group would have done so;
15 companies in the Dividend Score 80− group would have done so.
In the U.S. sample, the share of companies with dividend cuts or eliminations was similar in the 90+ and 80+ groups. The 90+ group, however, delivered somewhat faster dividend growth.
Dividend Cuts and Annual Income Growth
The first chart shows the share of companies that reduced or eliminated their payouts over the entire study period.
Dividend Score - U.S. Market
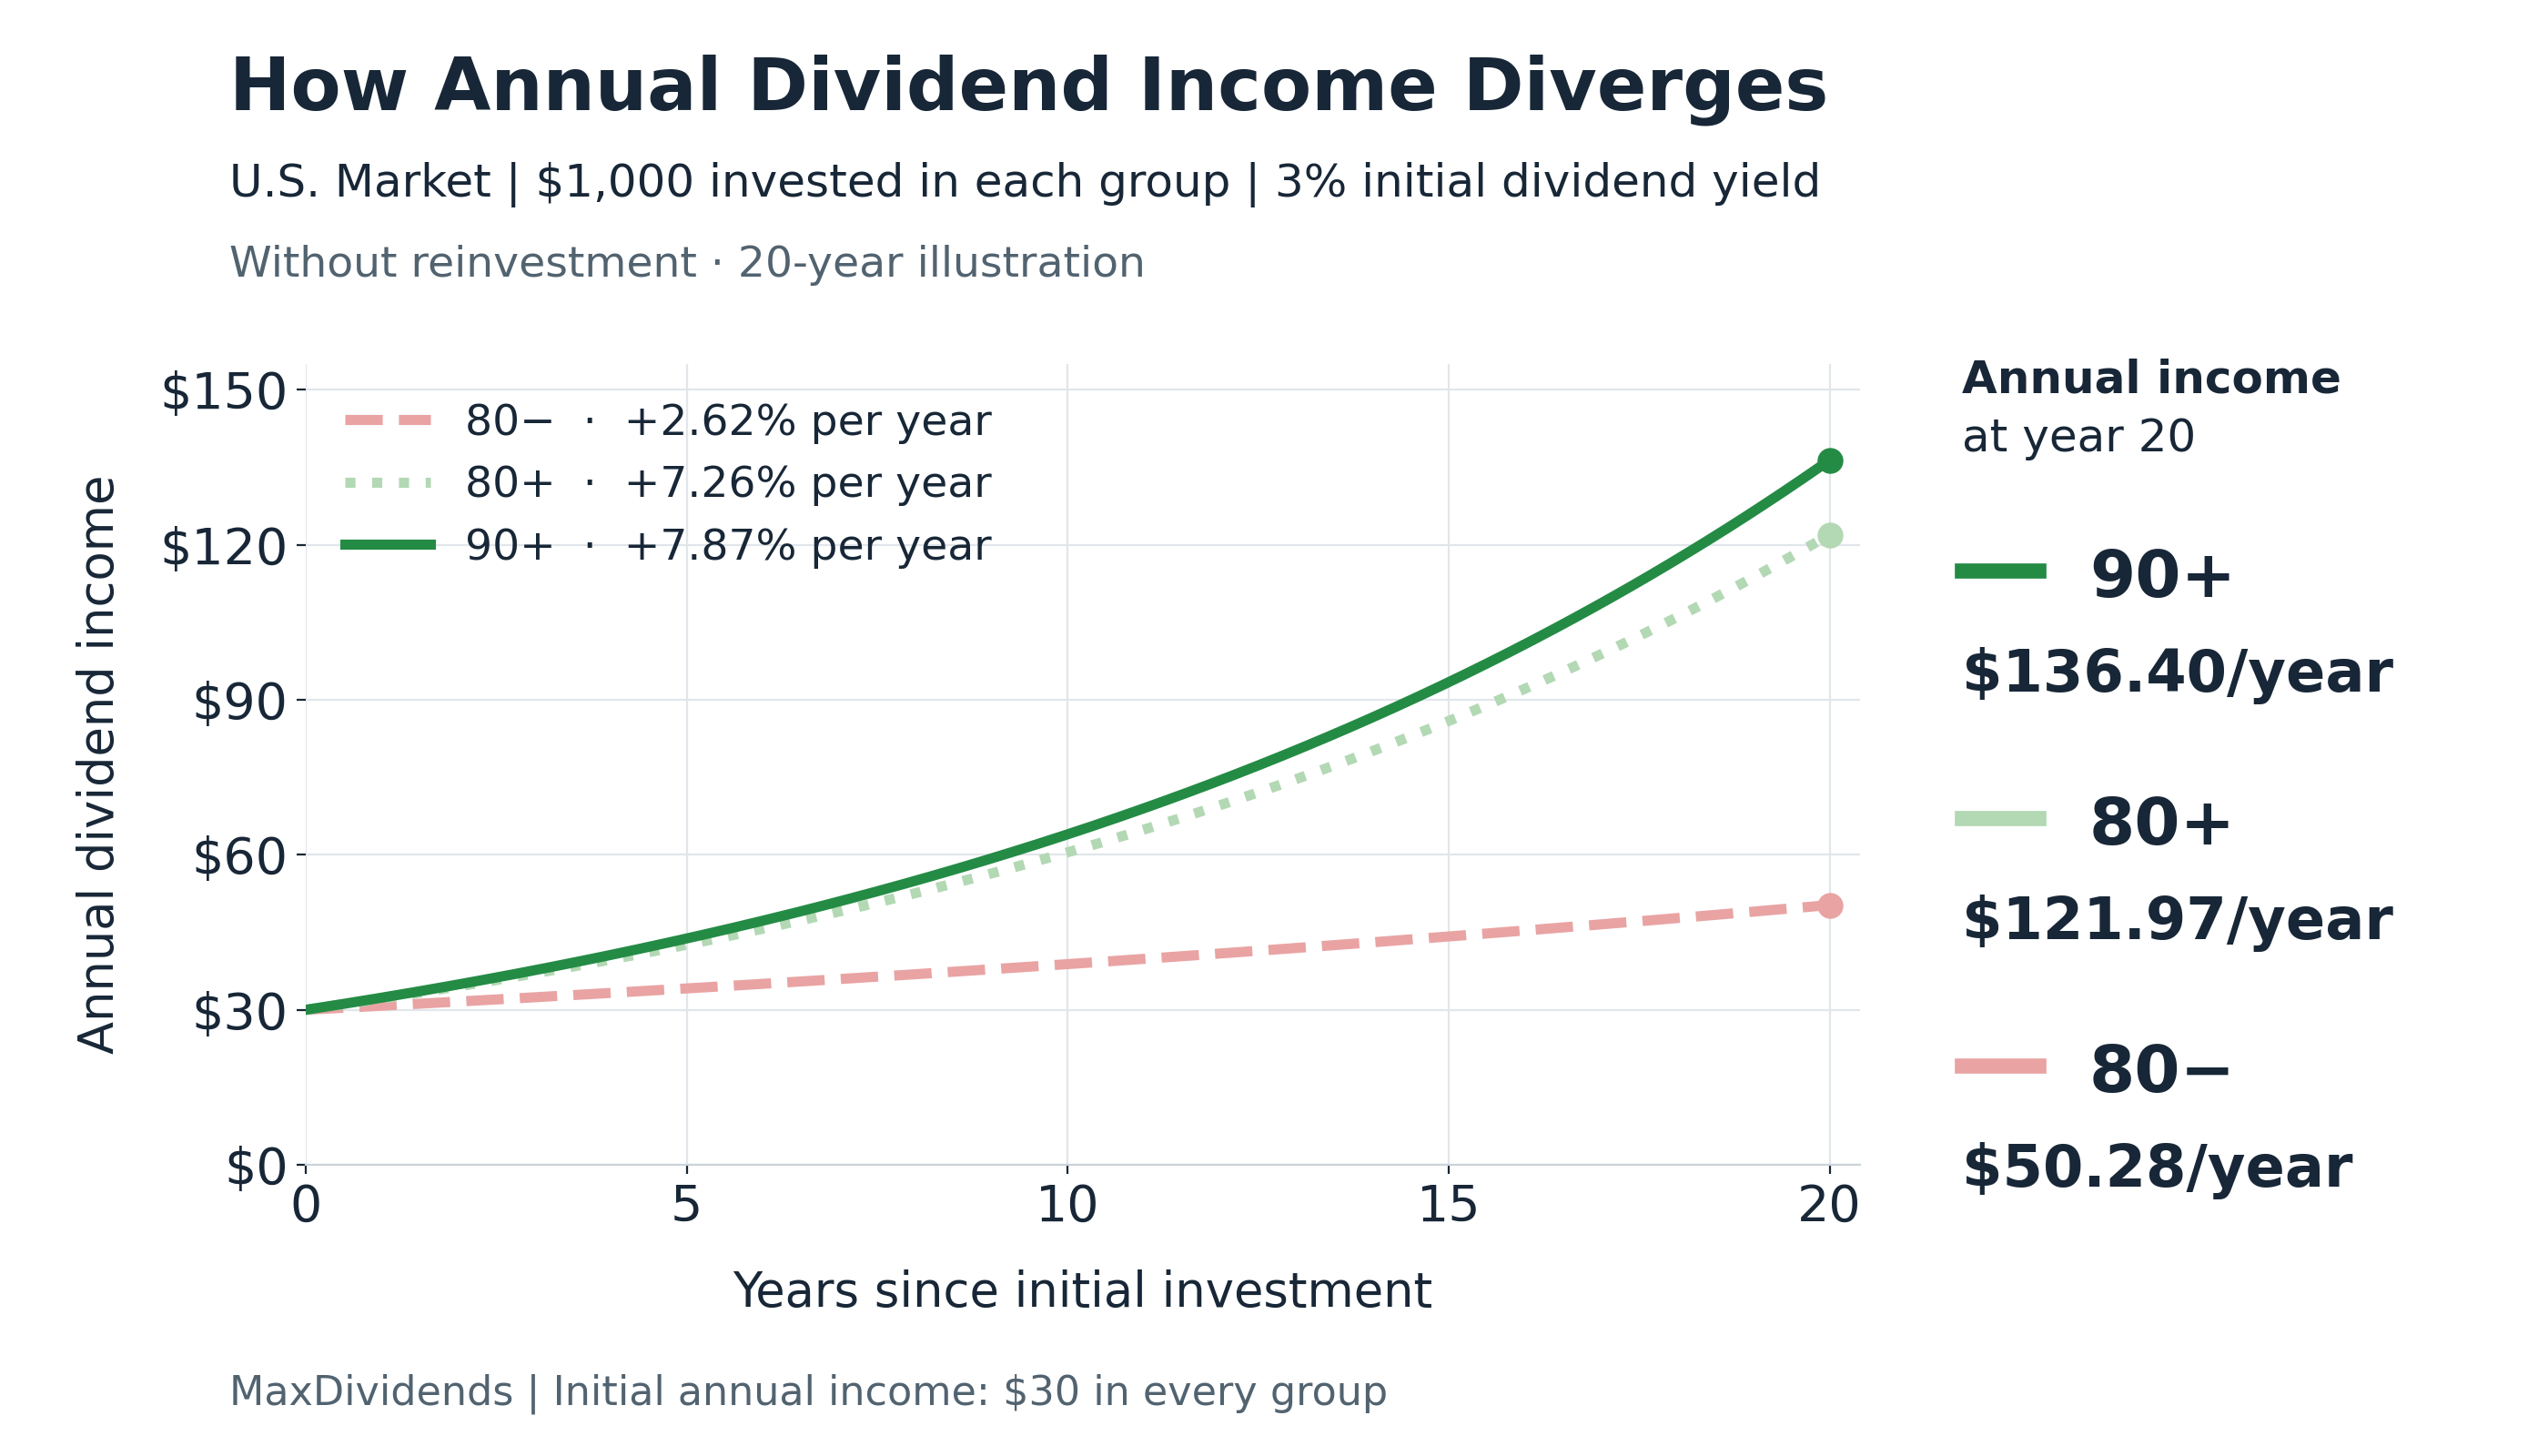
The second illustrates annual dividend income over 20 years, starting with the same initial investment.
How Dividend Growth Changes Investor Income
Imagine investing $1,000 in each group at the same initial dividend yield of 3%.
Each investment initially generates $30 a year. Payouts then grow at different rates: +7.87% annually for Dividend Score 90+, +7.26% for Dividend Score 80+, and +2.62% for Dividend Score 80−.
Let’s look at how annual income changes if these growth rates continue.
Dividend Score - U.S. Market
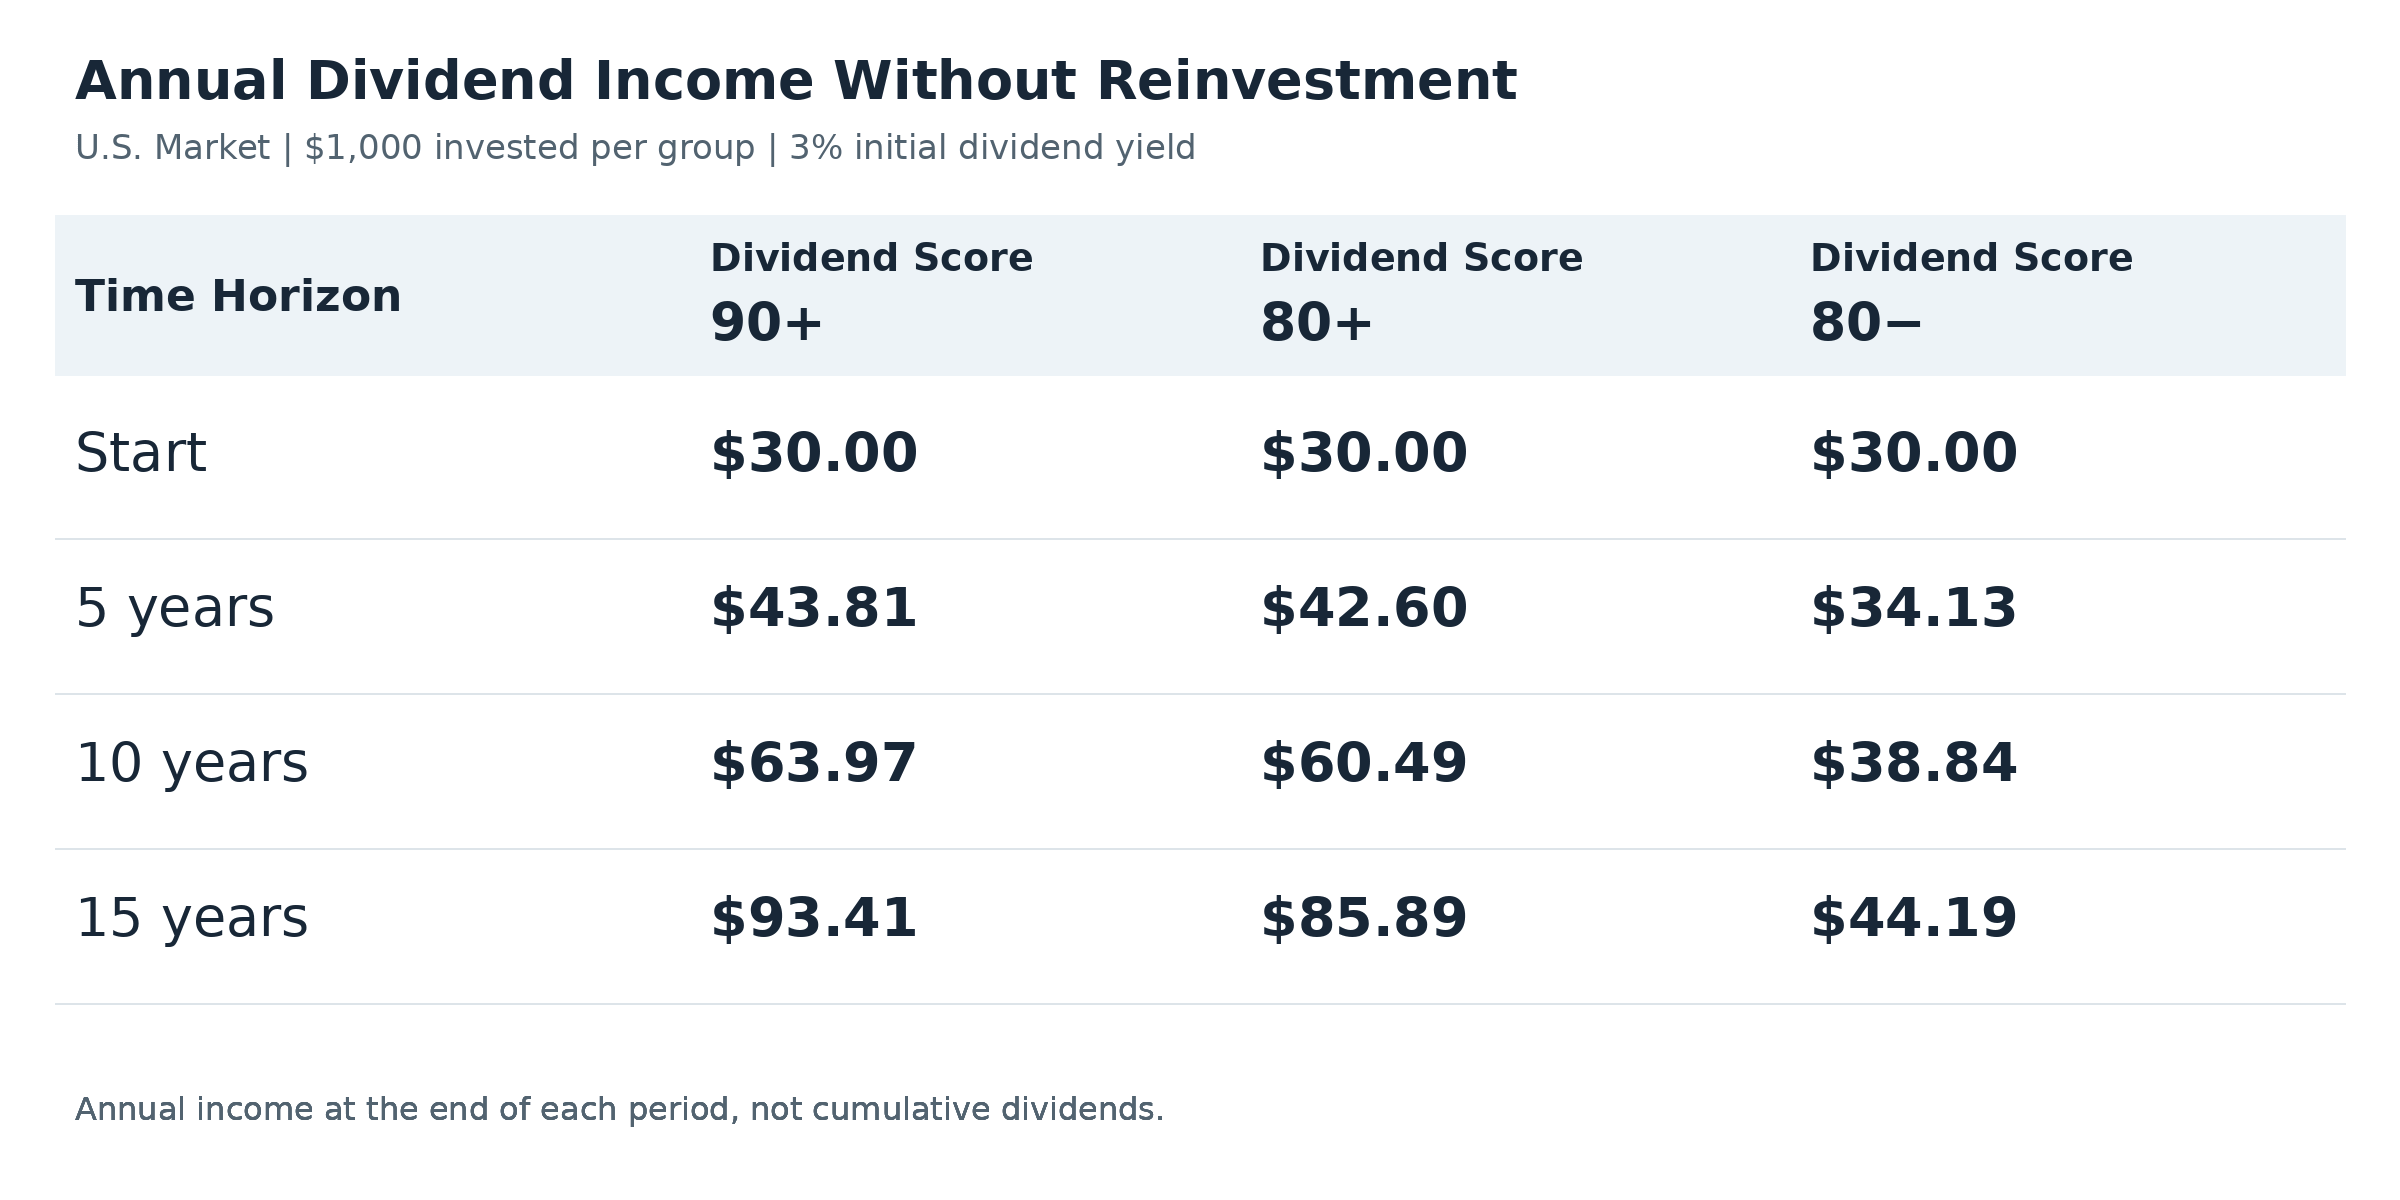
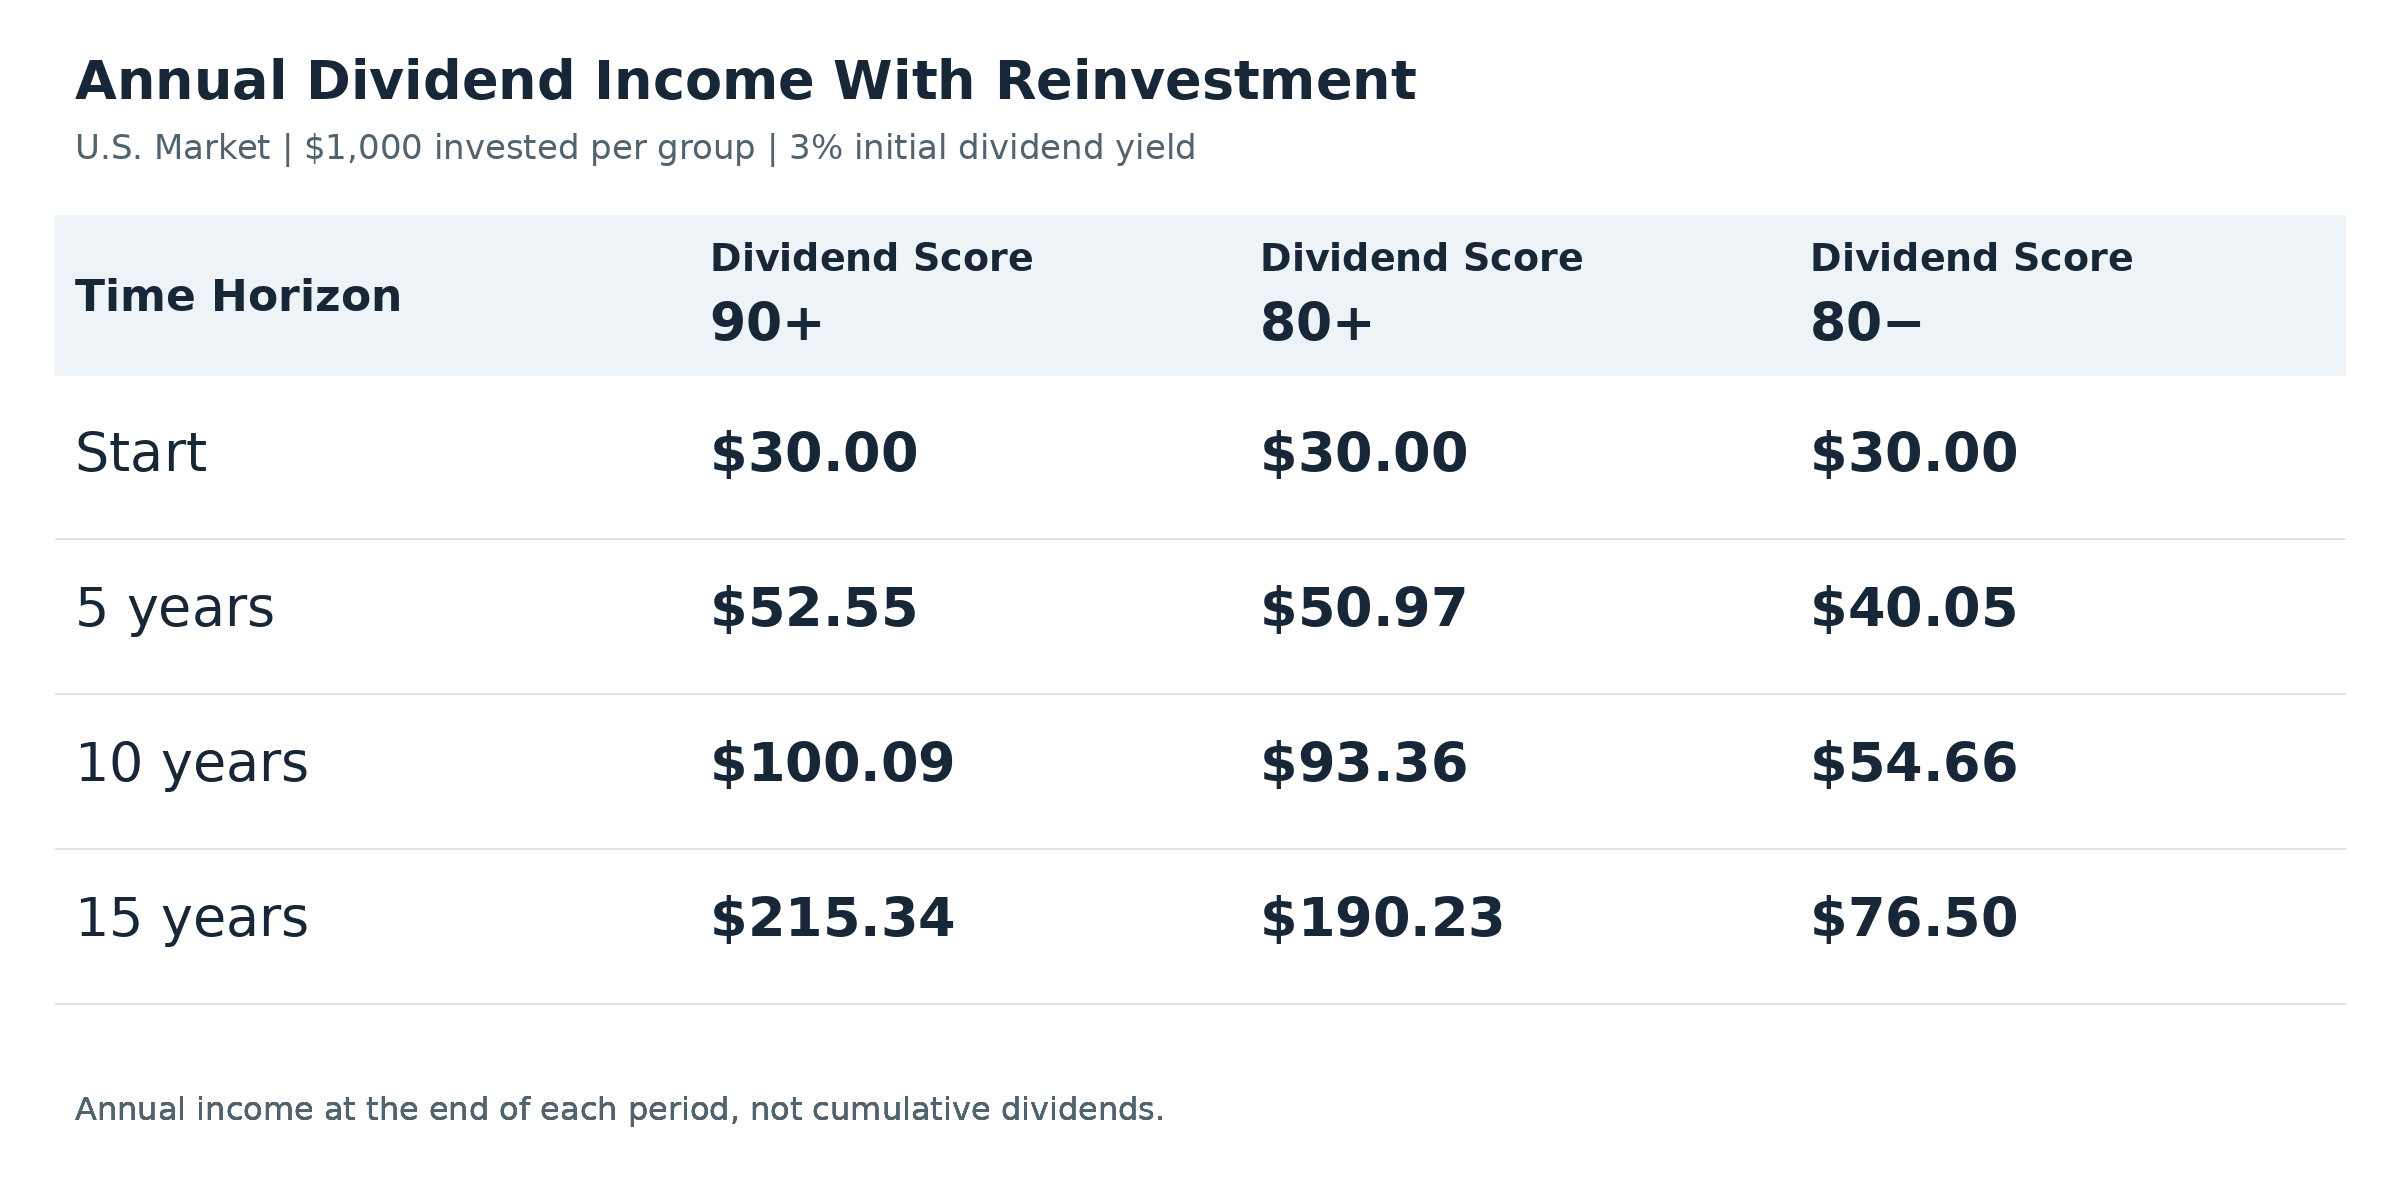
After 15 years, the investment in the Dividend Score 90+ group generates $93.41 a year without reinvestment, compared with $44.19 for the 80− group. With reinvestment, annual income reaches $215.34 versus $76.50.
Reinvestment amplifies the effect: dividends buy additional shares. Those shares also generate dividends, while the payout per share continues to grow.
Dividend Score
Global Markets (Excluding the U.S.)
How We Conducted the Study
We excluded U.S. companies and selected companies from other countries that, based on the 2023 Consecutive Years metric in the spreadsheet, had increased their dividends every year for at least 10 consecutive years. Companies also needed Dividend Score data for all four years: 2023, 2024, 2025, and 2026.
The initial sample contained 44 companies: 34 from Canada, four from Sweden, three from Finland, two from Norway, and one from Switzerland.
For the comparison, we used three initial groups without rounding the scores:
Dividend Score 90+: companies with scores of 90 or higher.
Dividend Score 80+: companies with scores of 80 or higher.
Dividend Score 80−: companies with scores of 79 or lower.
Companies with scores of 90 or higher also belong to the 80+ group. We show them separately to examine whether a higher initial score is associated with different results. The company counts for these two groups should not be added together.
We then tracked regular dividend payouts from January 1, 2023, through October 7, 2026: how many companies reduced or eliminated their payouts and how much their dividends grew.
We also accounted for changes in the score. If a company initially had a score of 80 or higher, its score subsequently fell below 80, and it later cut its dividend, we reassigned it to the 80− group. If that company’s initial score was 90 or higher, it was also removed from the final 90+ group.
After the adjustments, the Dividend Score 90+ group contained 17 companies, the 80+ group contained 28, and the 80− group contained 12.
What the Comparison Showed
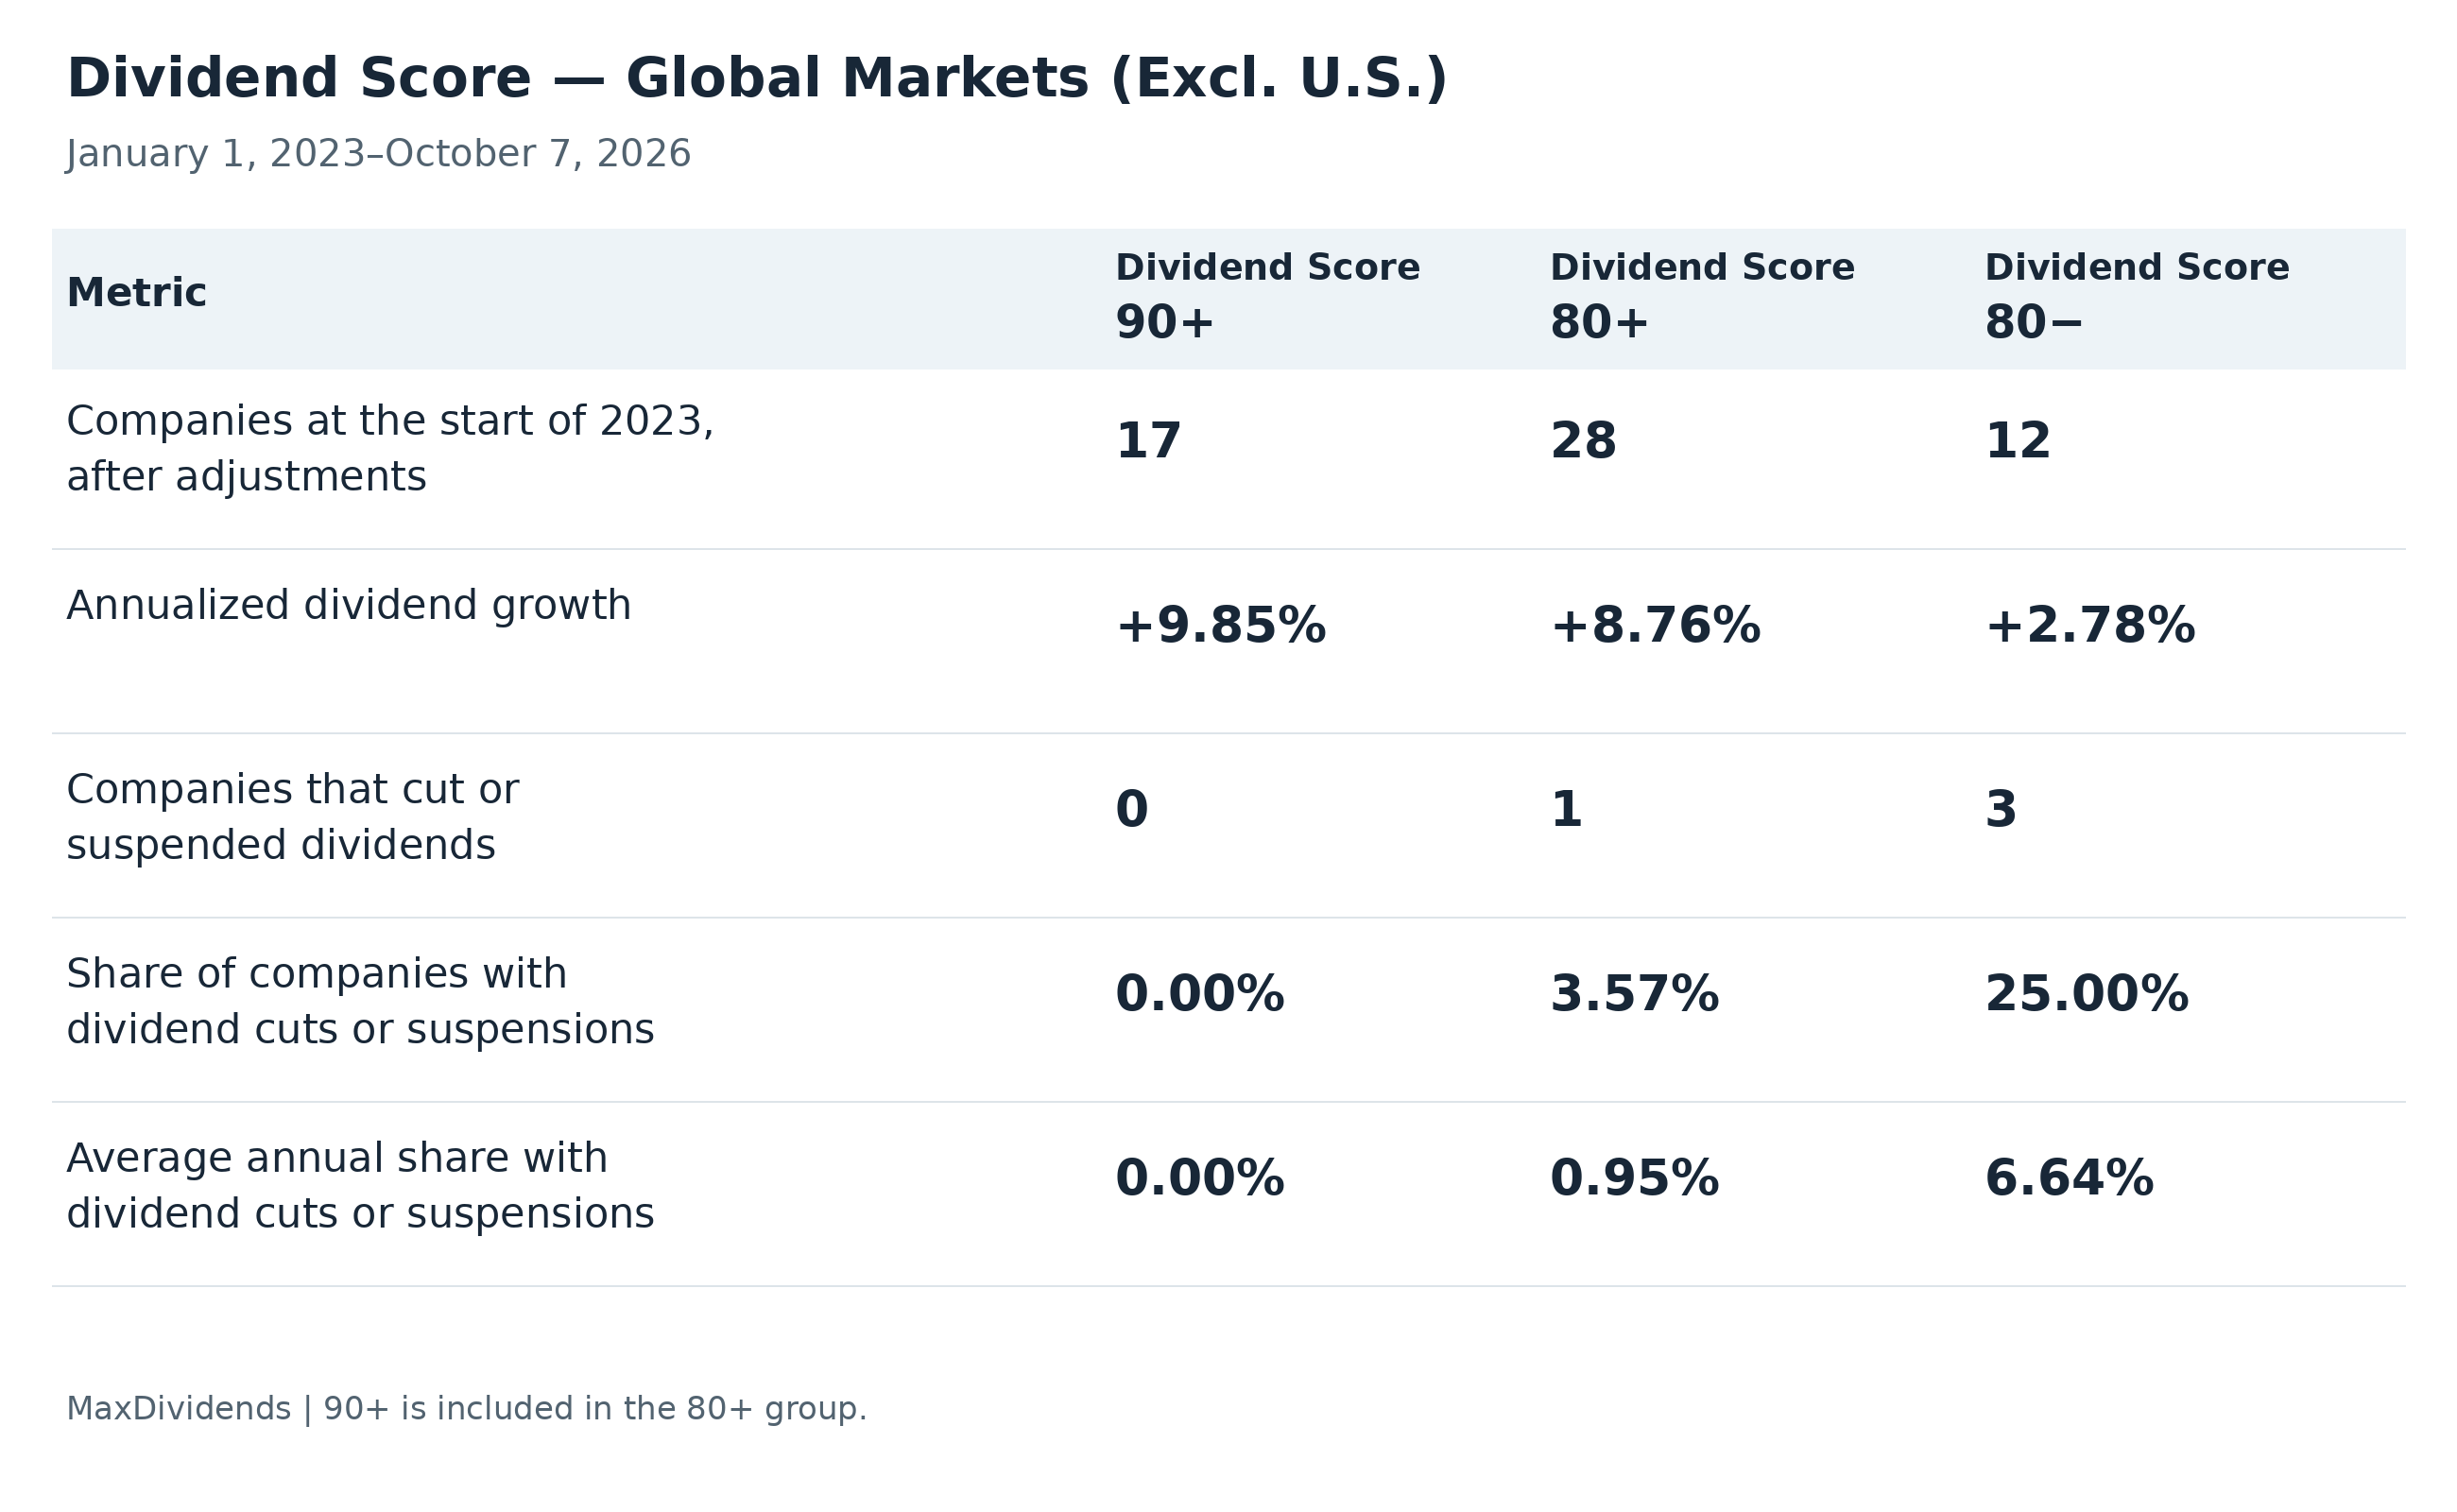
To make the difference easier to see, imagine 100 companies in each group. Applying the proportions observed in our sample, over the entire study period of almost four years, approximately:
0 companies in the Dividend Score 90+ group would have reduced their payouts;
4 companies in the Dividend Score 80+ group would have done so;
25 companies in the Dividend Score 80− group would have done so.
We found no dividend cuts in the final 90+ group. This result applies to the 17 companies that remained in that group after the adjustments.
Dividend Cuts and Annual Income Growth
The first chart shows the share of companies that reduced or eliminated their payouts over the entire study period.
Dividend Score - Global Markets (Excluding the U.S.)
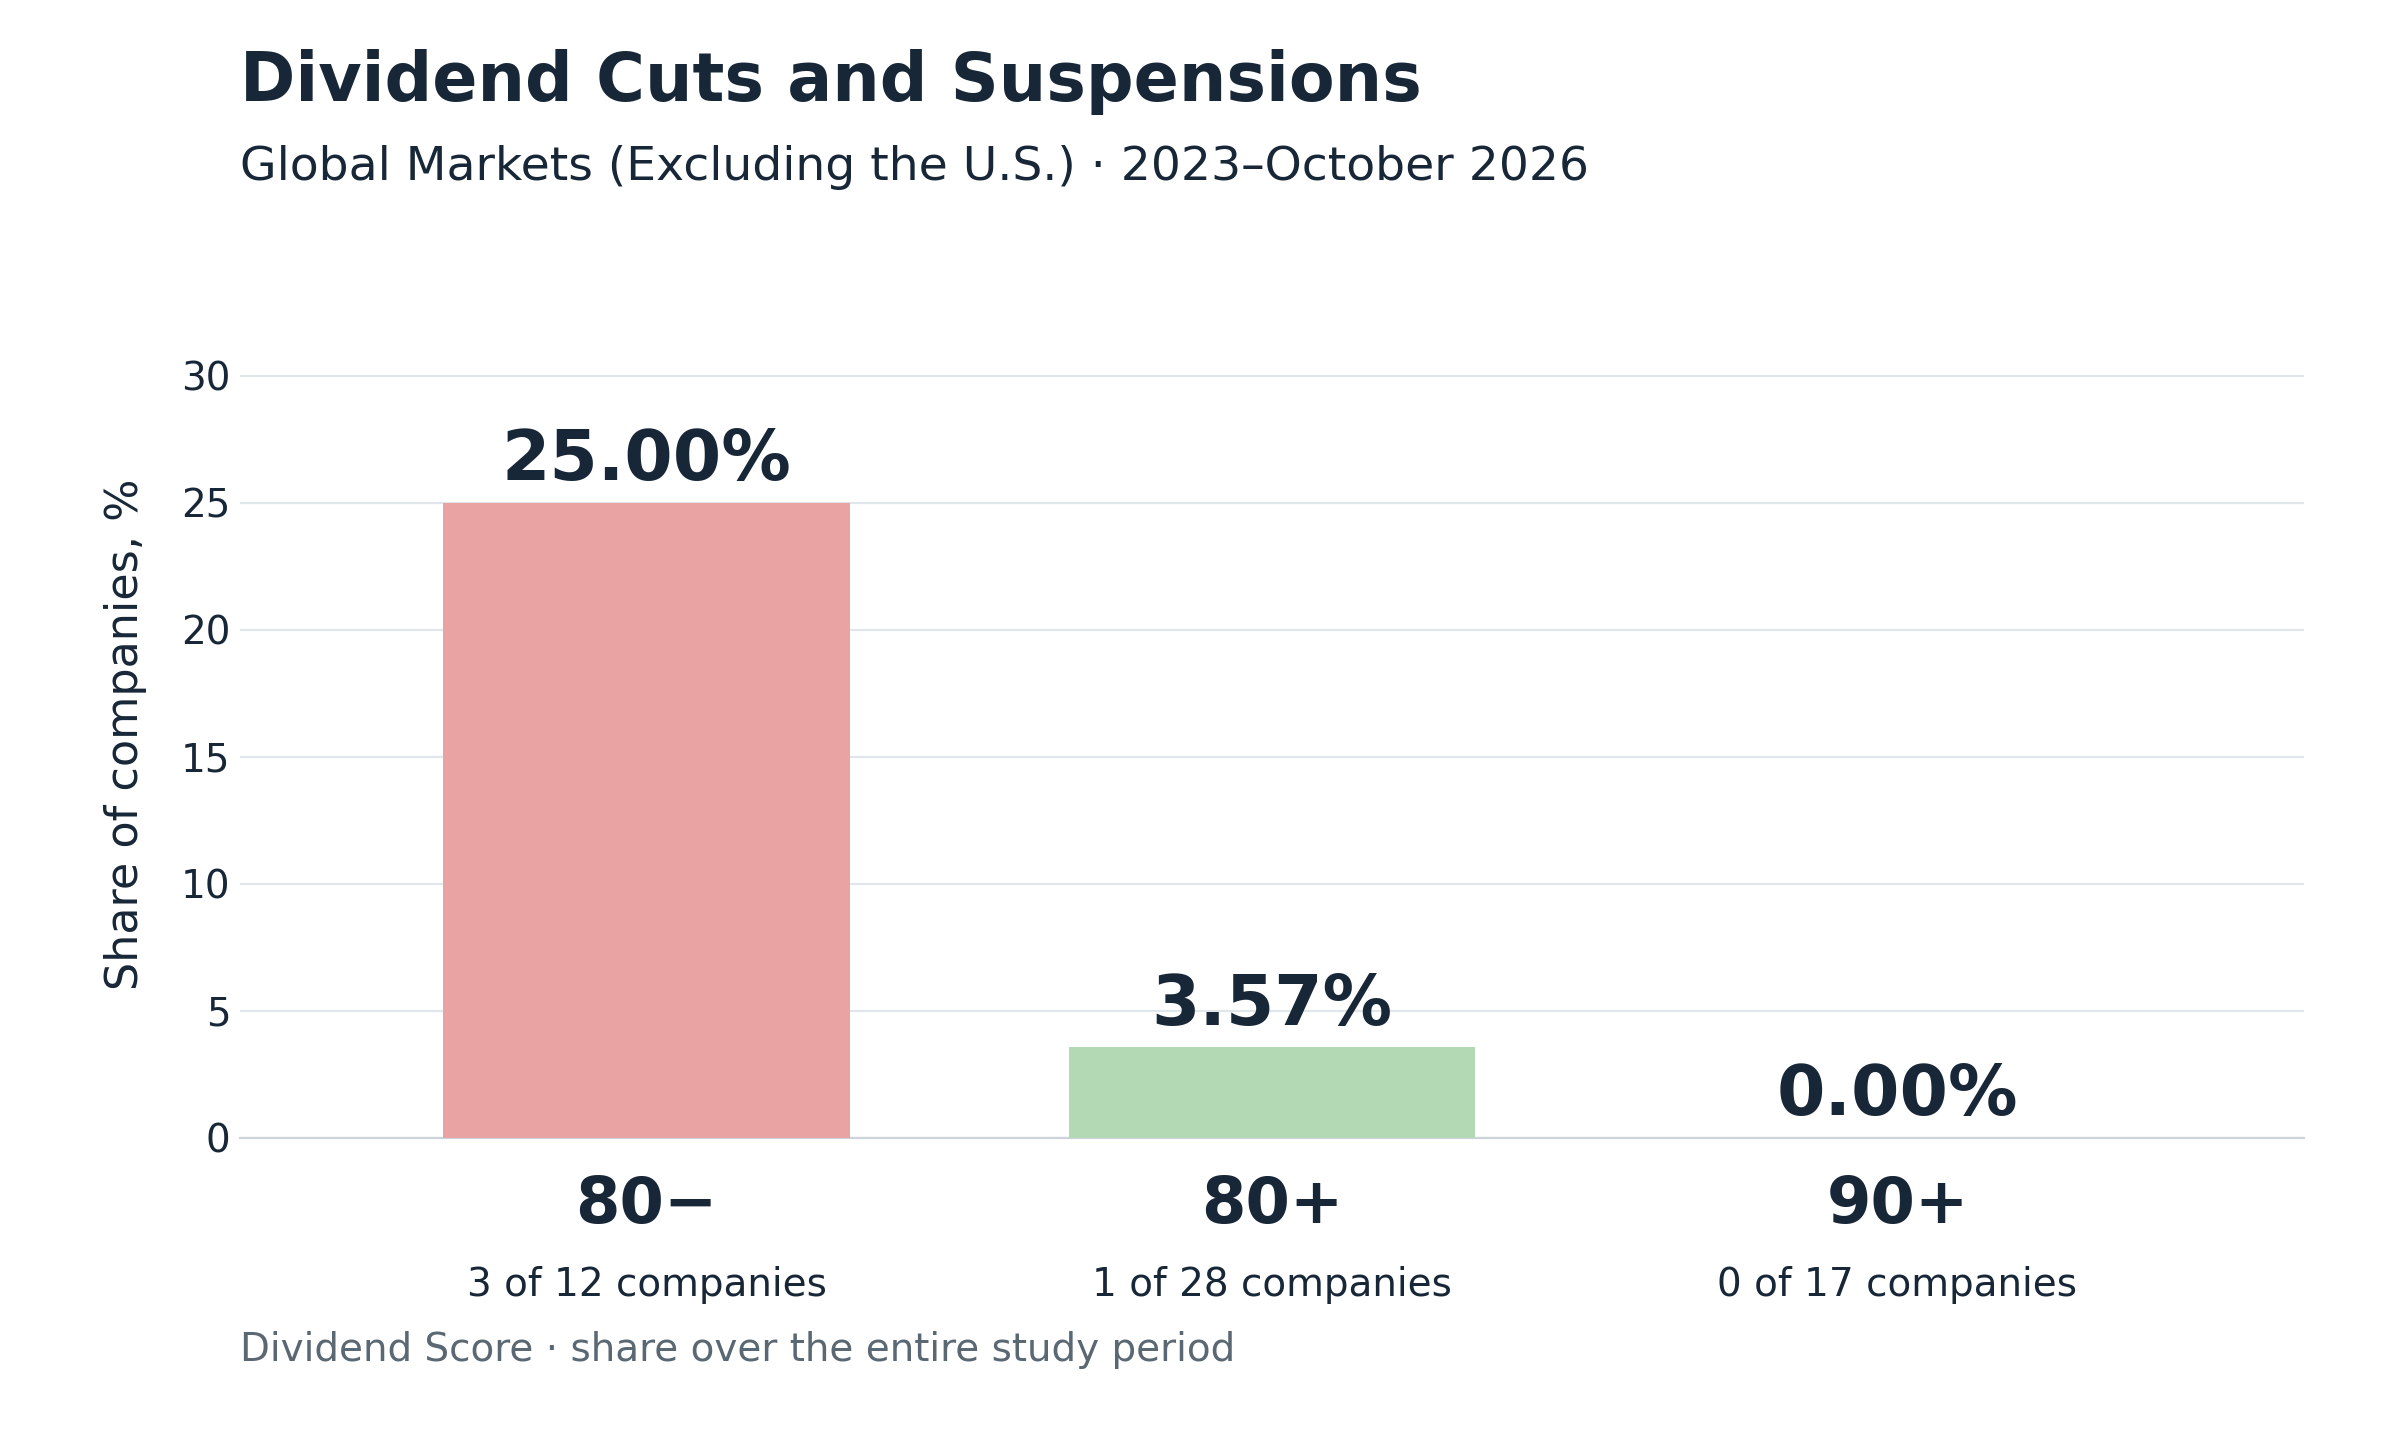
The second illustrates annual dividend income over 20 years, starting with the same initial investment.
How Dividend Growth Changes Investor Income
Imagine investing $1,000 in each group at the same initial dividend yield of 3%.
Each investment initially generates $30 a year. Payouts then grow at different rates: +9.85% annually for Dividend Score 90+, +8.76% for Dividend Score 80+, and +2.78% for Dividend Score 80−.
Let’s look at how annual income changes if these growth rates continue.
Dividend Score - Global Markets (Excluding the U.S.)
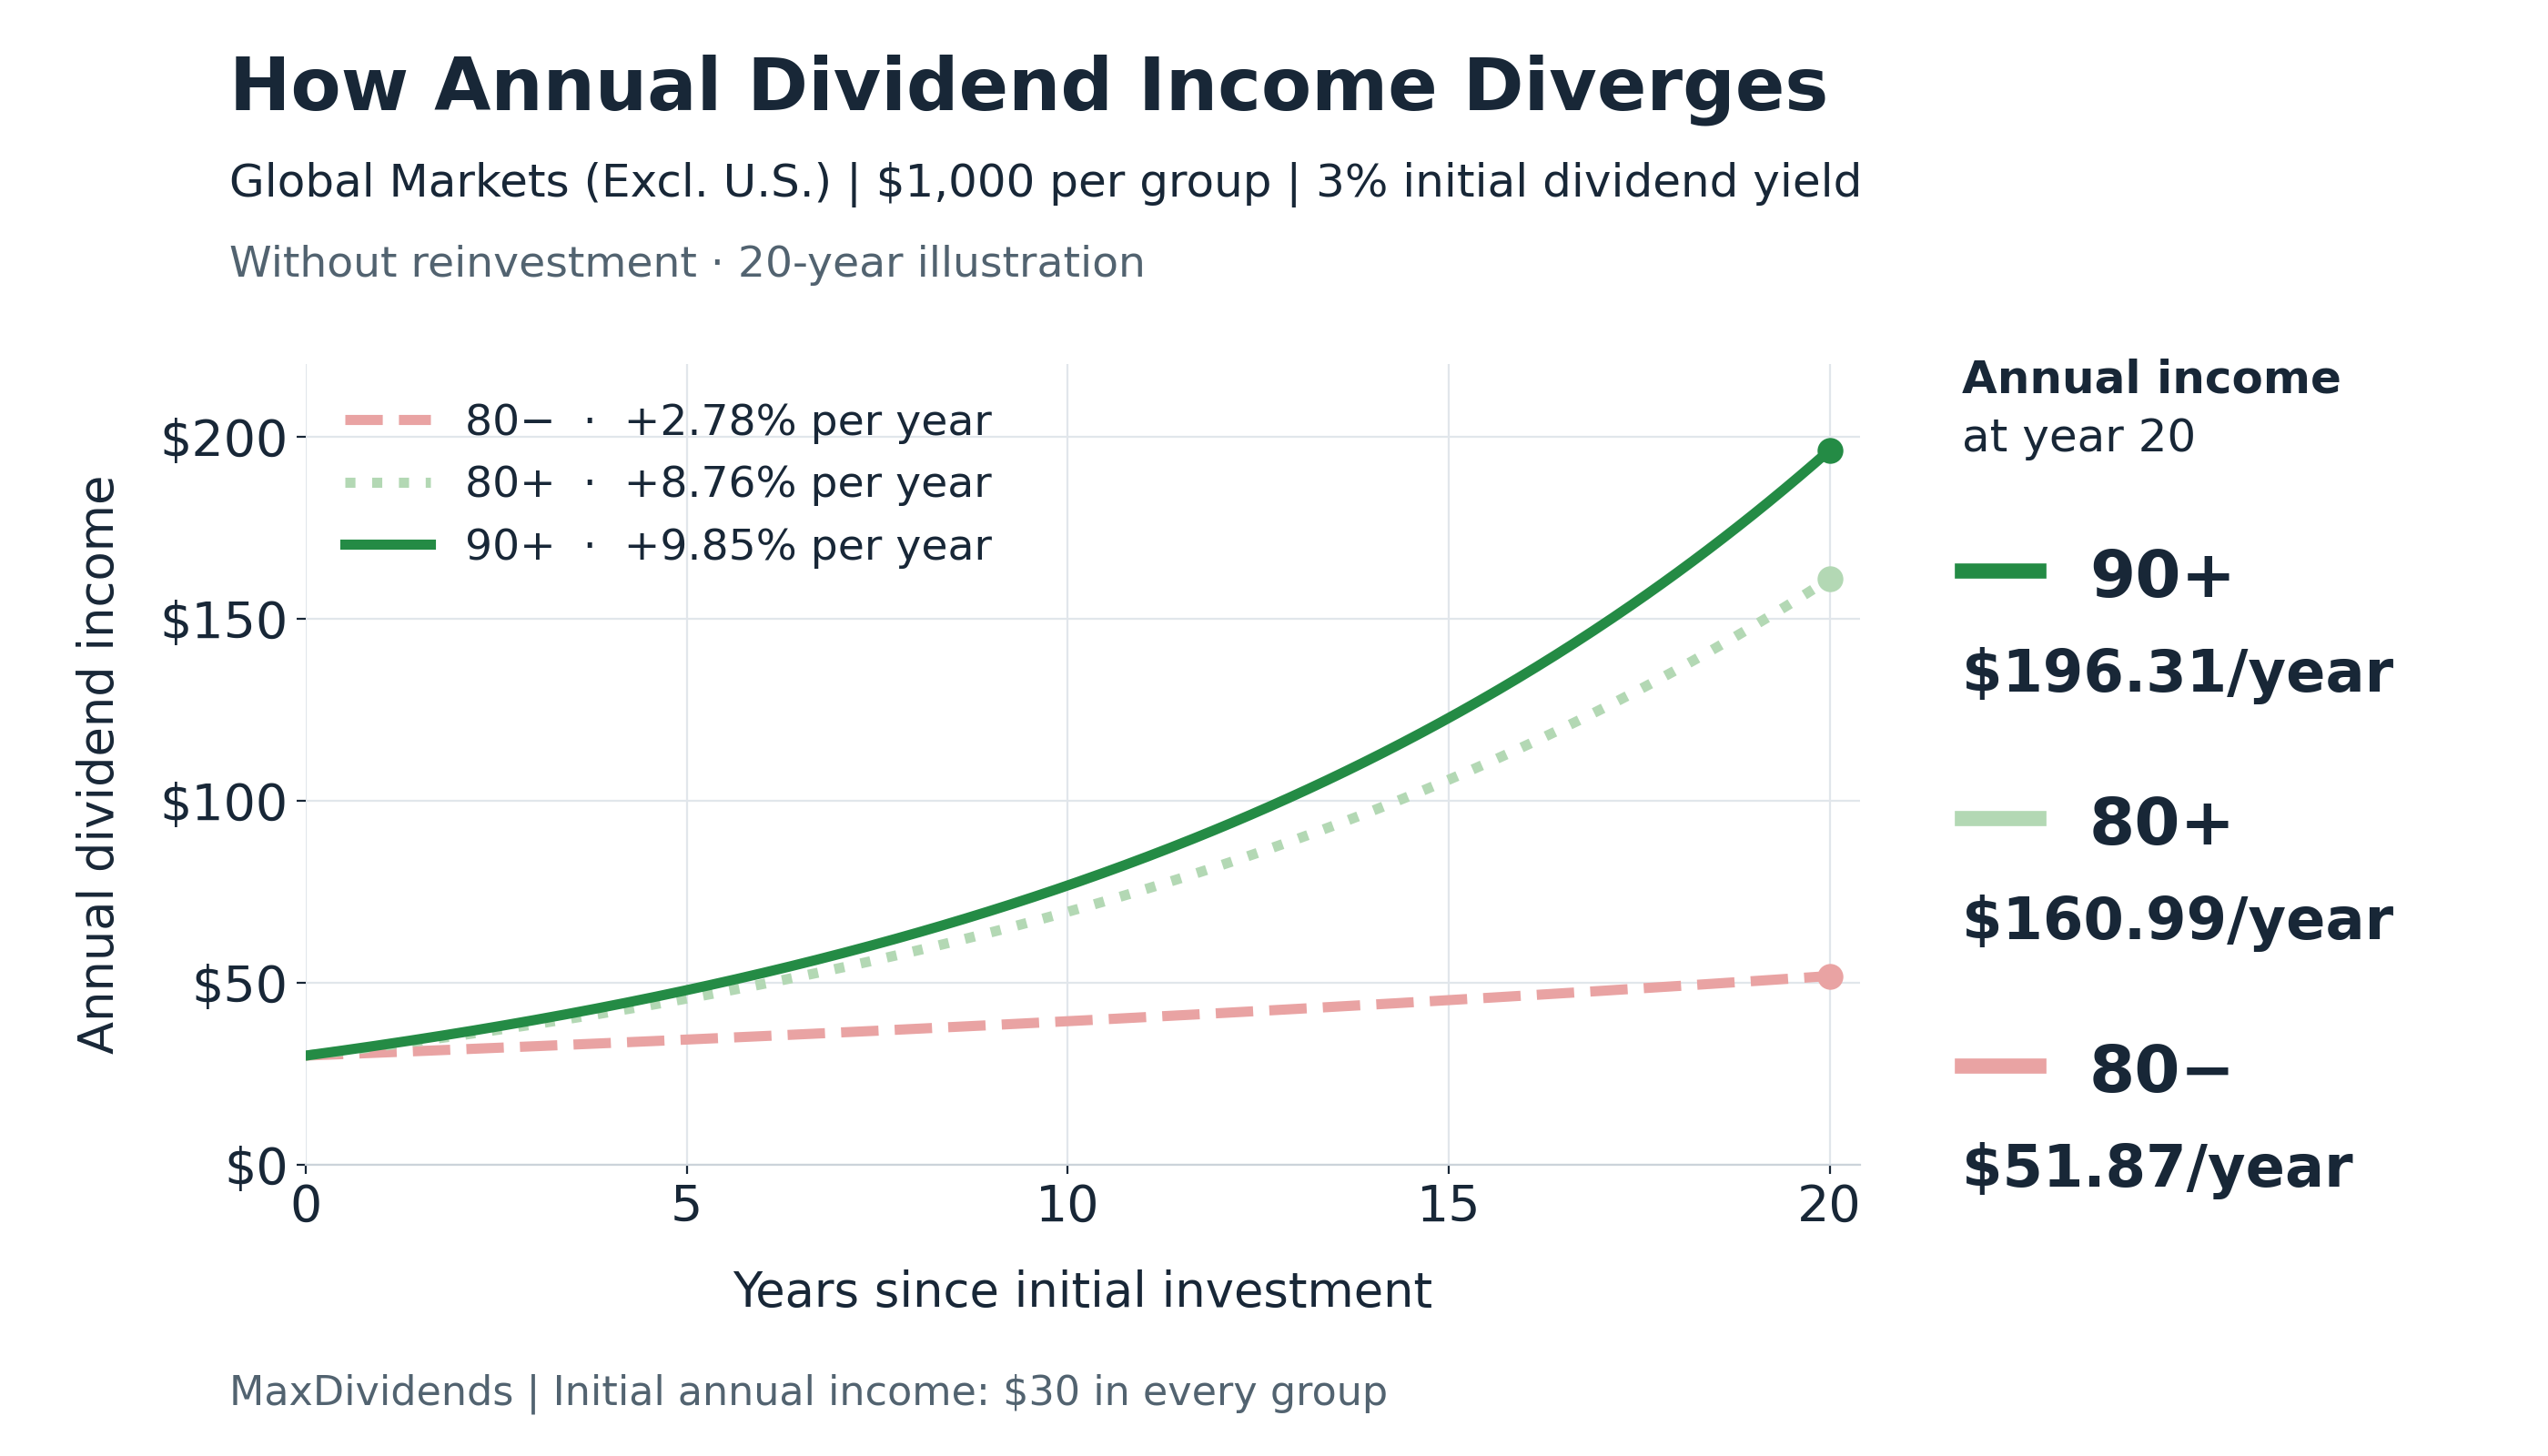
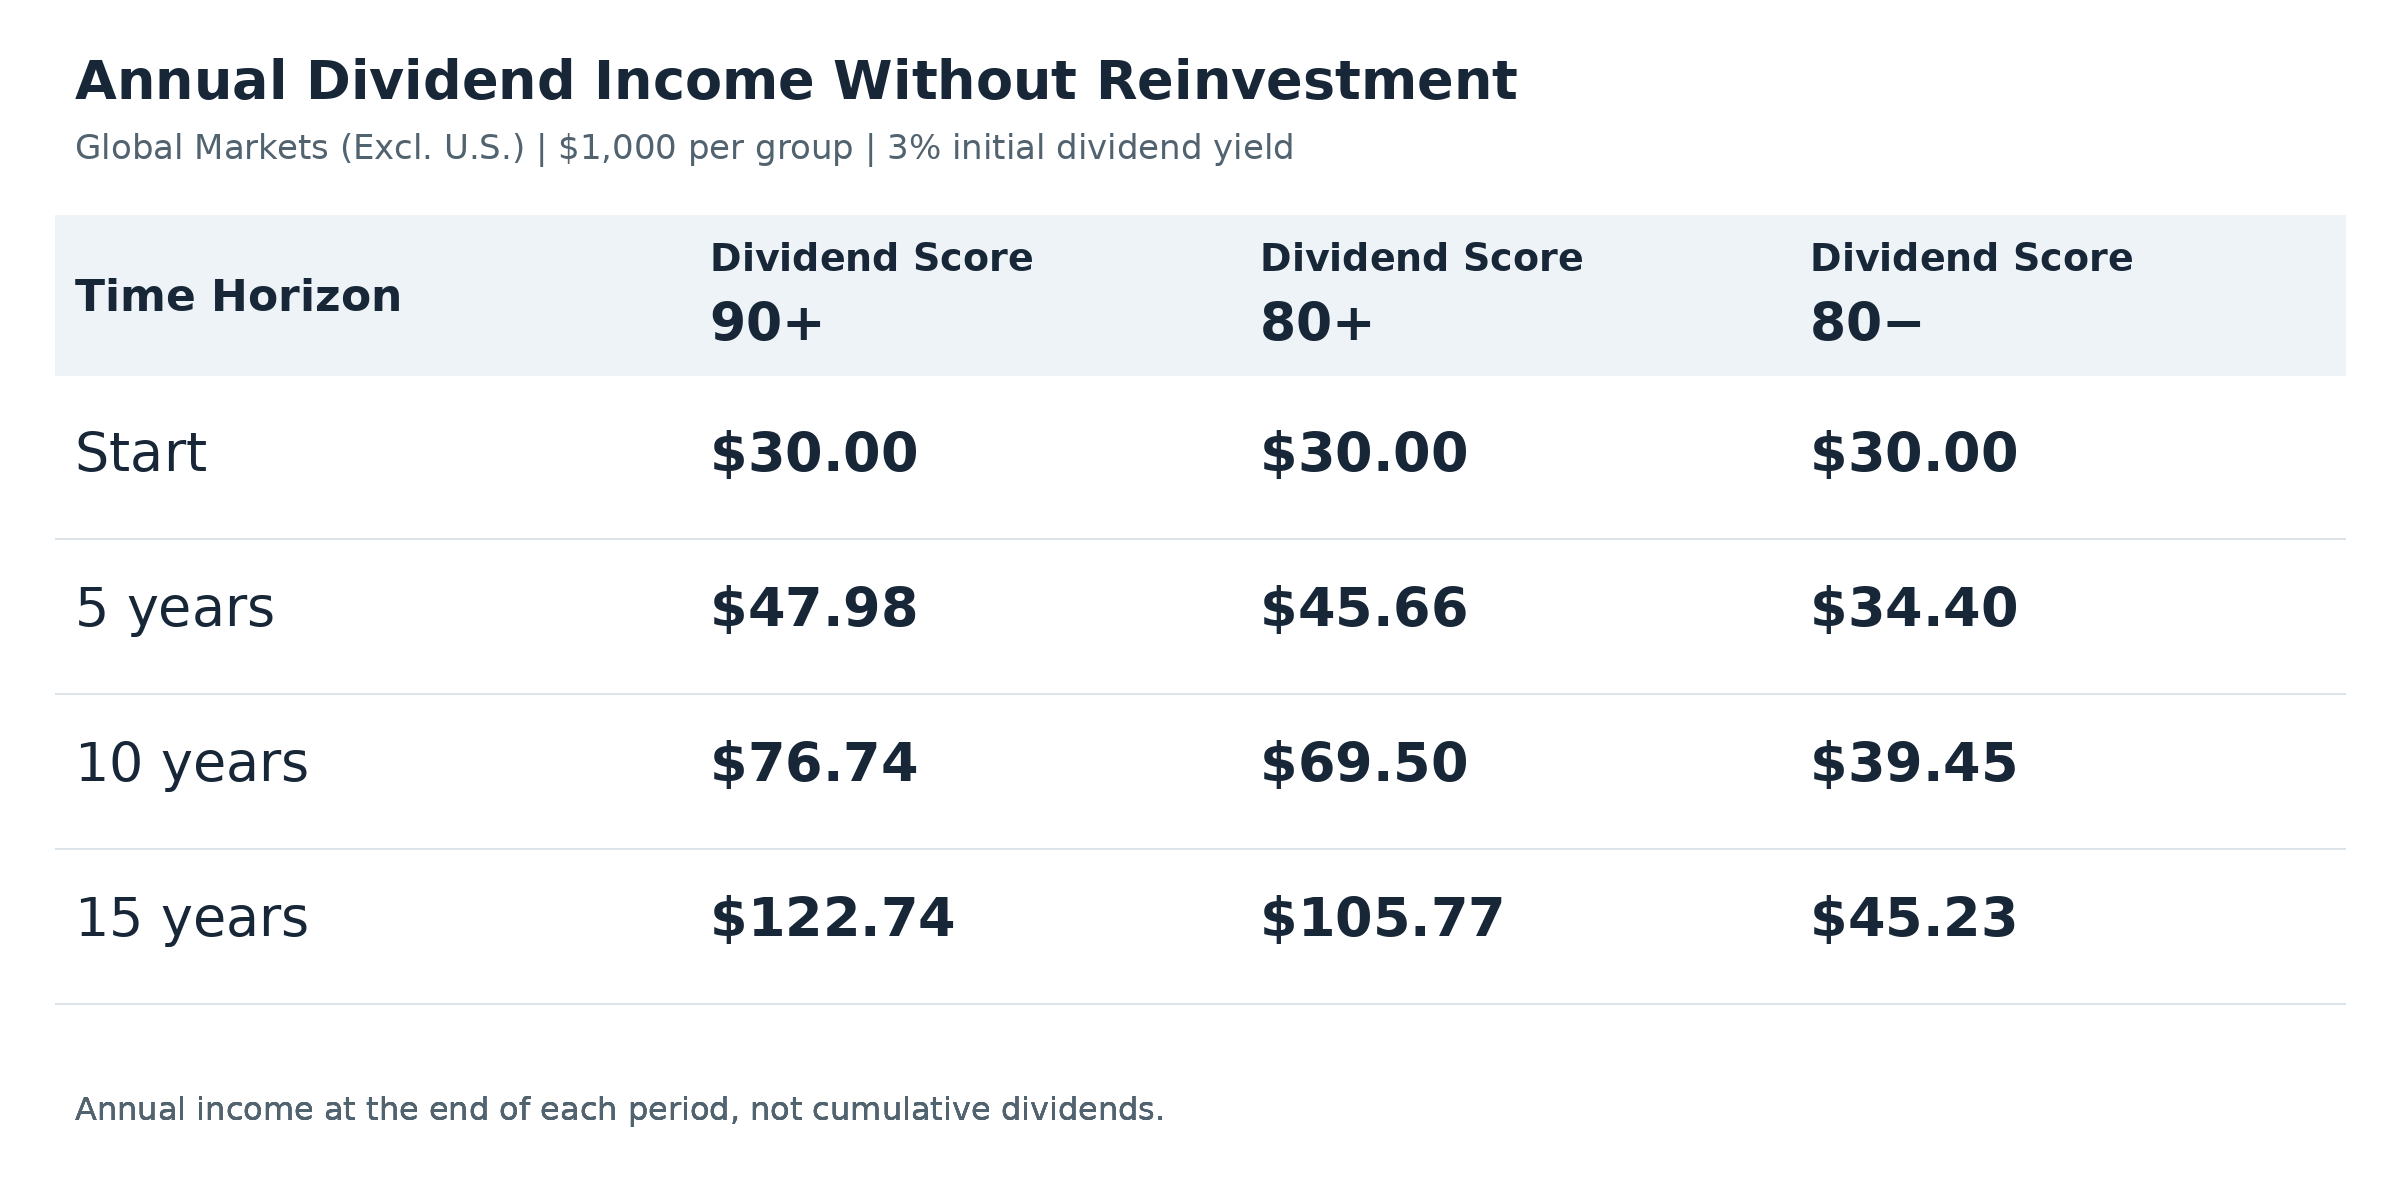
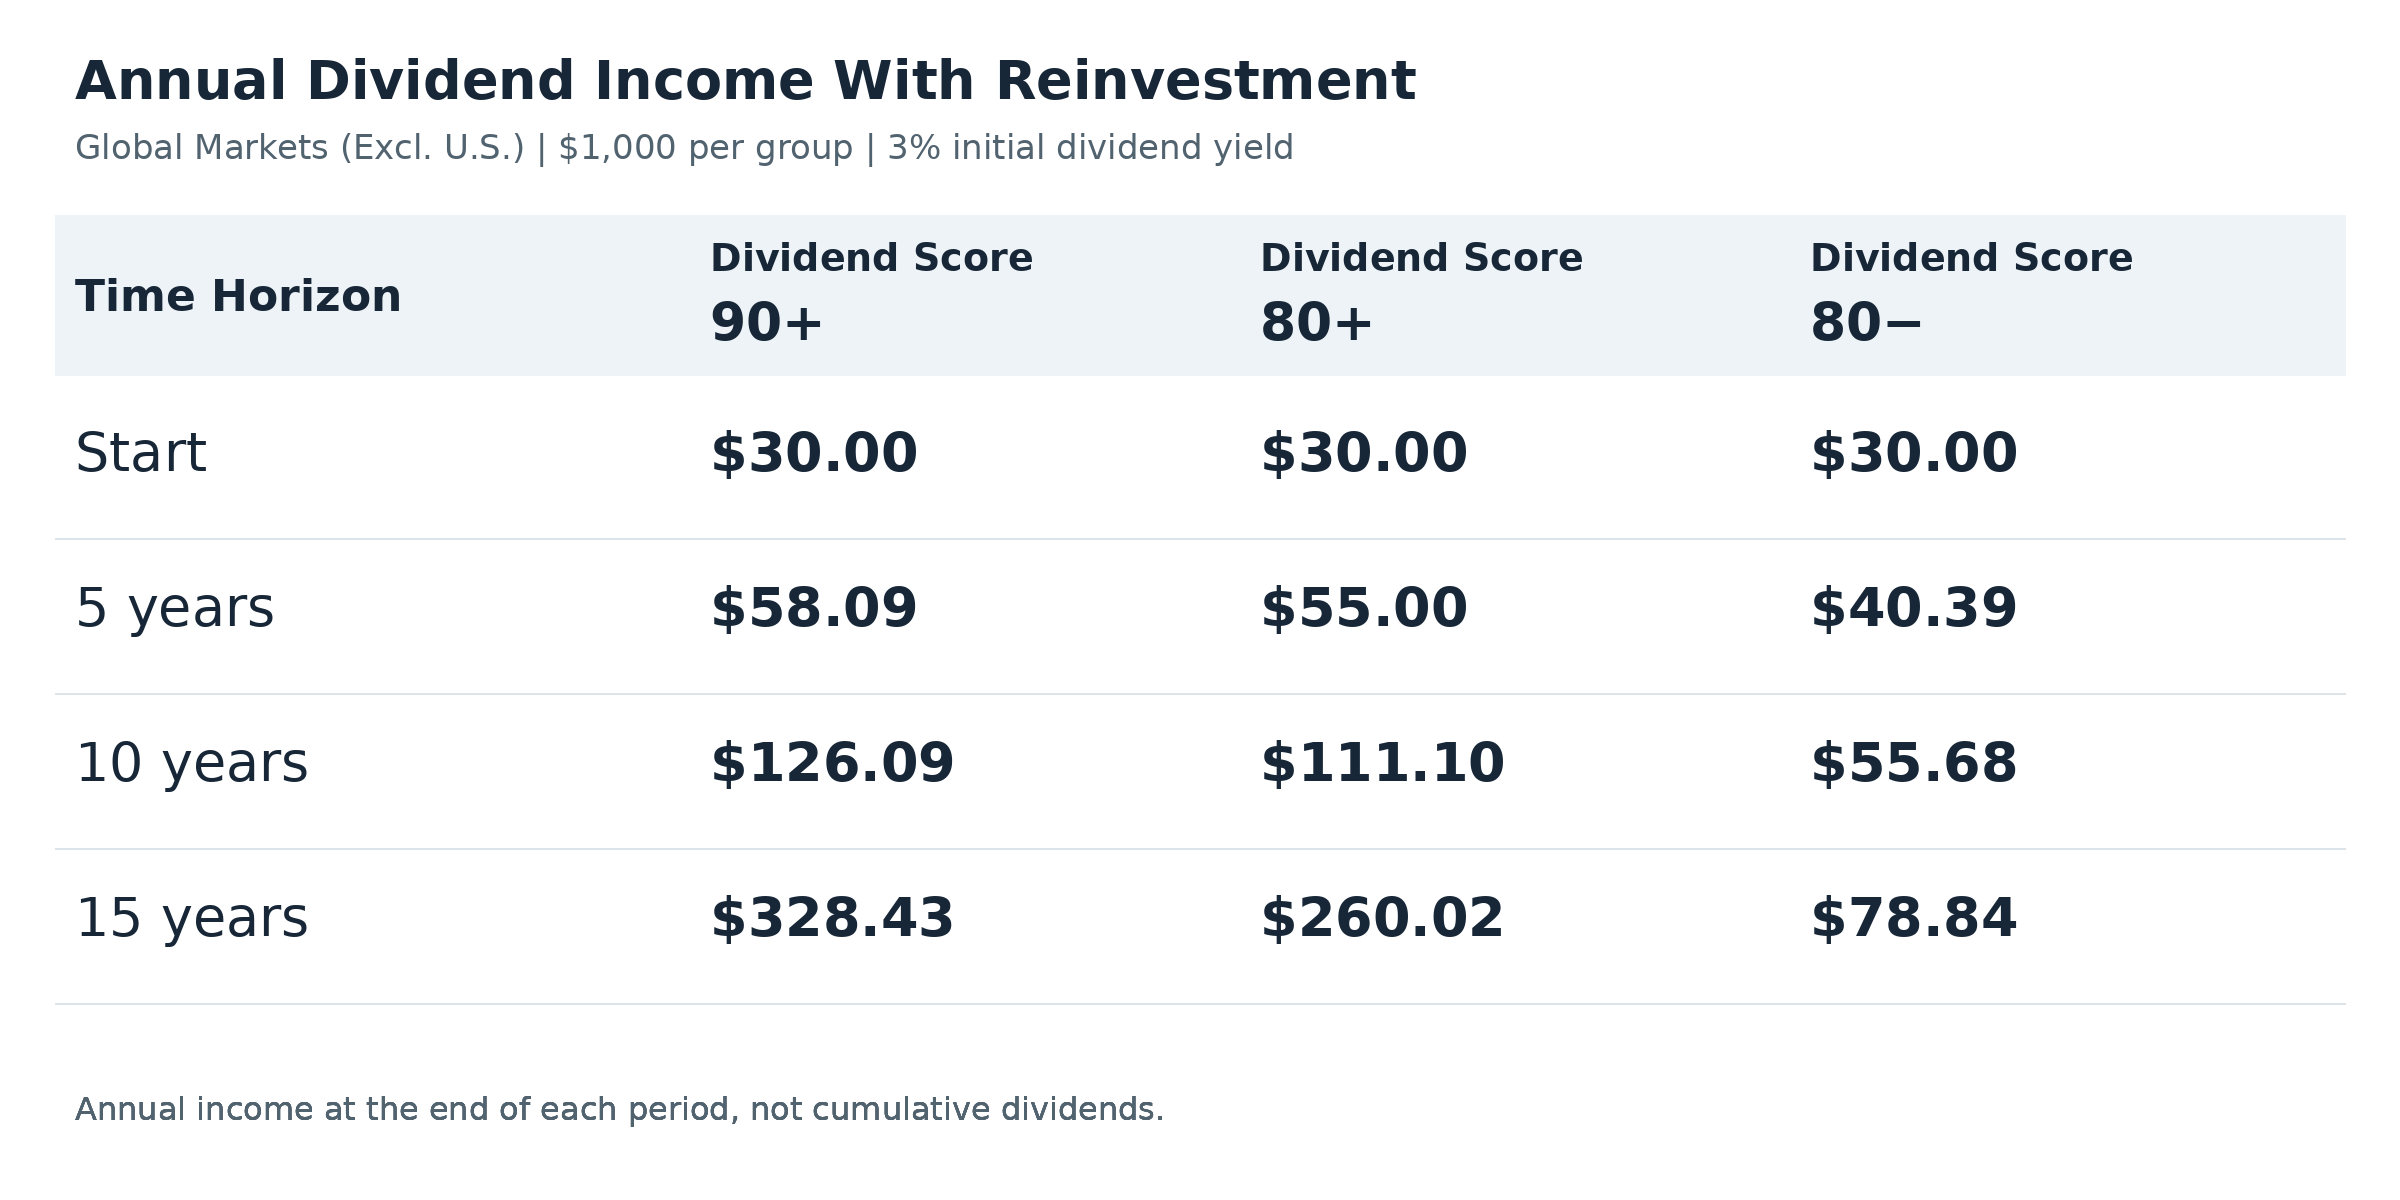
After 15 years, the investment in the Dividend Score 90+ group generates $122.74 a year without reinvestment, compared with $45.23 for the 80− group. With reinvestment, annual income reaches $328.43 versus $78.84.
Reinvestment amplifies the effect: dividends buy additional shares. Those shares also generate dividends, while the payout per share continues to grow.
Dividend Score
Combined Results: US + Global Markets
How We Conducted the Study
We combined the results for U.S. companies and companies from other countries.
The initial combined sample contained 439 companies. Based on the 2023 Consecutive Years metric in the spreadsheet, they had increased their dividends every year for at least 10 consecutive years and had Dividend Score data for all four years: 2023, 2024, 2025, and 2026.
For the comparison, we used three initial groups without rounding the scores:
Dividend Score 90+: companies with scores of 90 or higher.
Dividend Score 80+: companies with scores of 80 or higher.
Dividend Score 80−: companies with scores of 79 or lower.
Companies with scores of 90 or higher also belong to the 80+ group. We show them separately to examine whether a higher initial score is associated with different results. The company counts for these two groups should not be added together.
We then tracked regular dividend payouts from January 1, 2023, through October 7, 2026: how many companies reduced or eliminated their payouts and how much their dividends grew.
We also accounted for changes in the score. If a company initially had a score of 80 or higher, its score subsequently fell below 80, and it later cut its dividend, we reassigned it to the 80− group. If that company’s initial score was 90 or higher, it was also removed from the final 90+ group.
After the adjustments, the Dividend Score 90+ group contained 219 companies, the 80+ group contained 340, and the 80− group contained 87.
Combined average growth is calculated across companies: each company receives the same weight, regardless of its country.
What the Comparison Showed
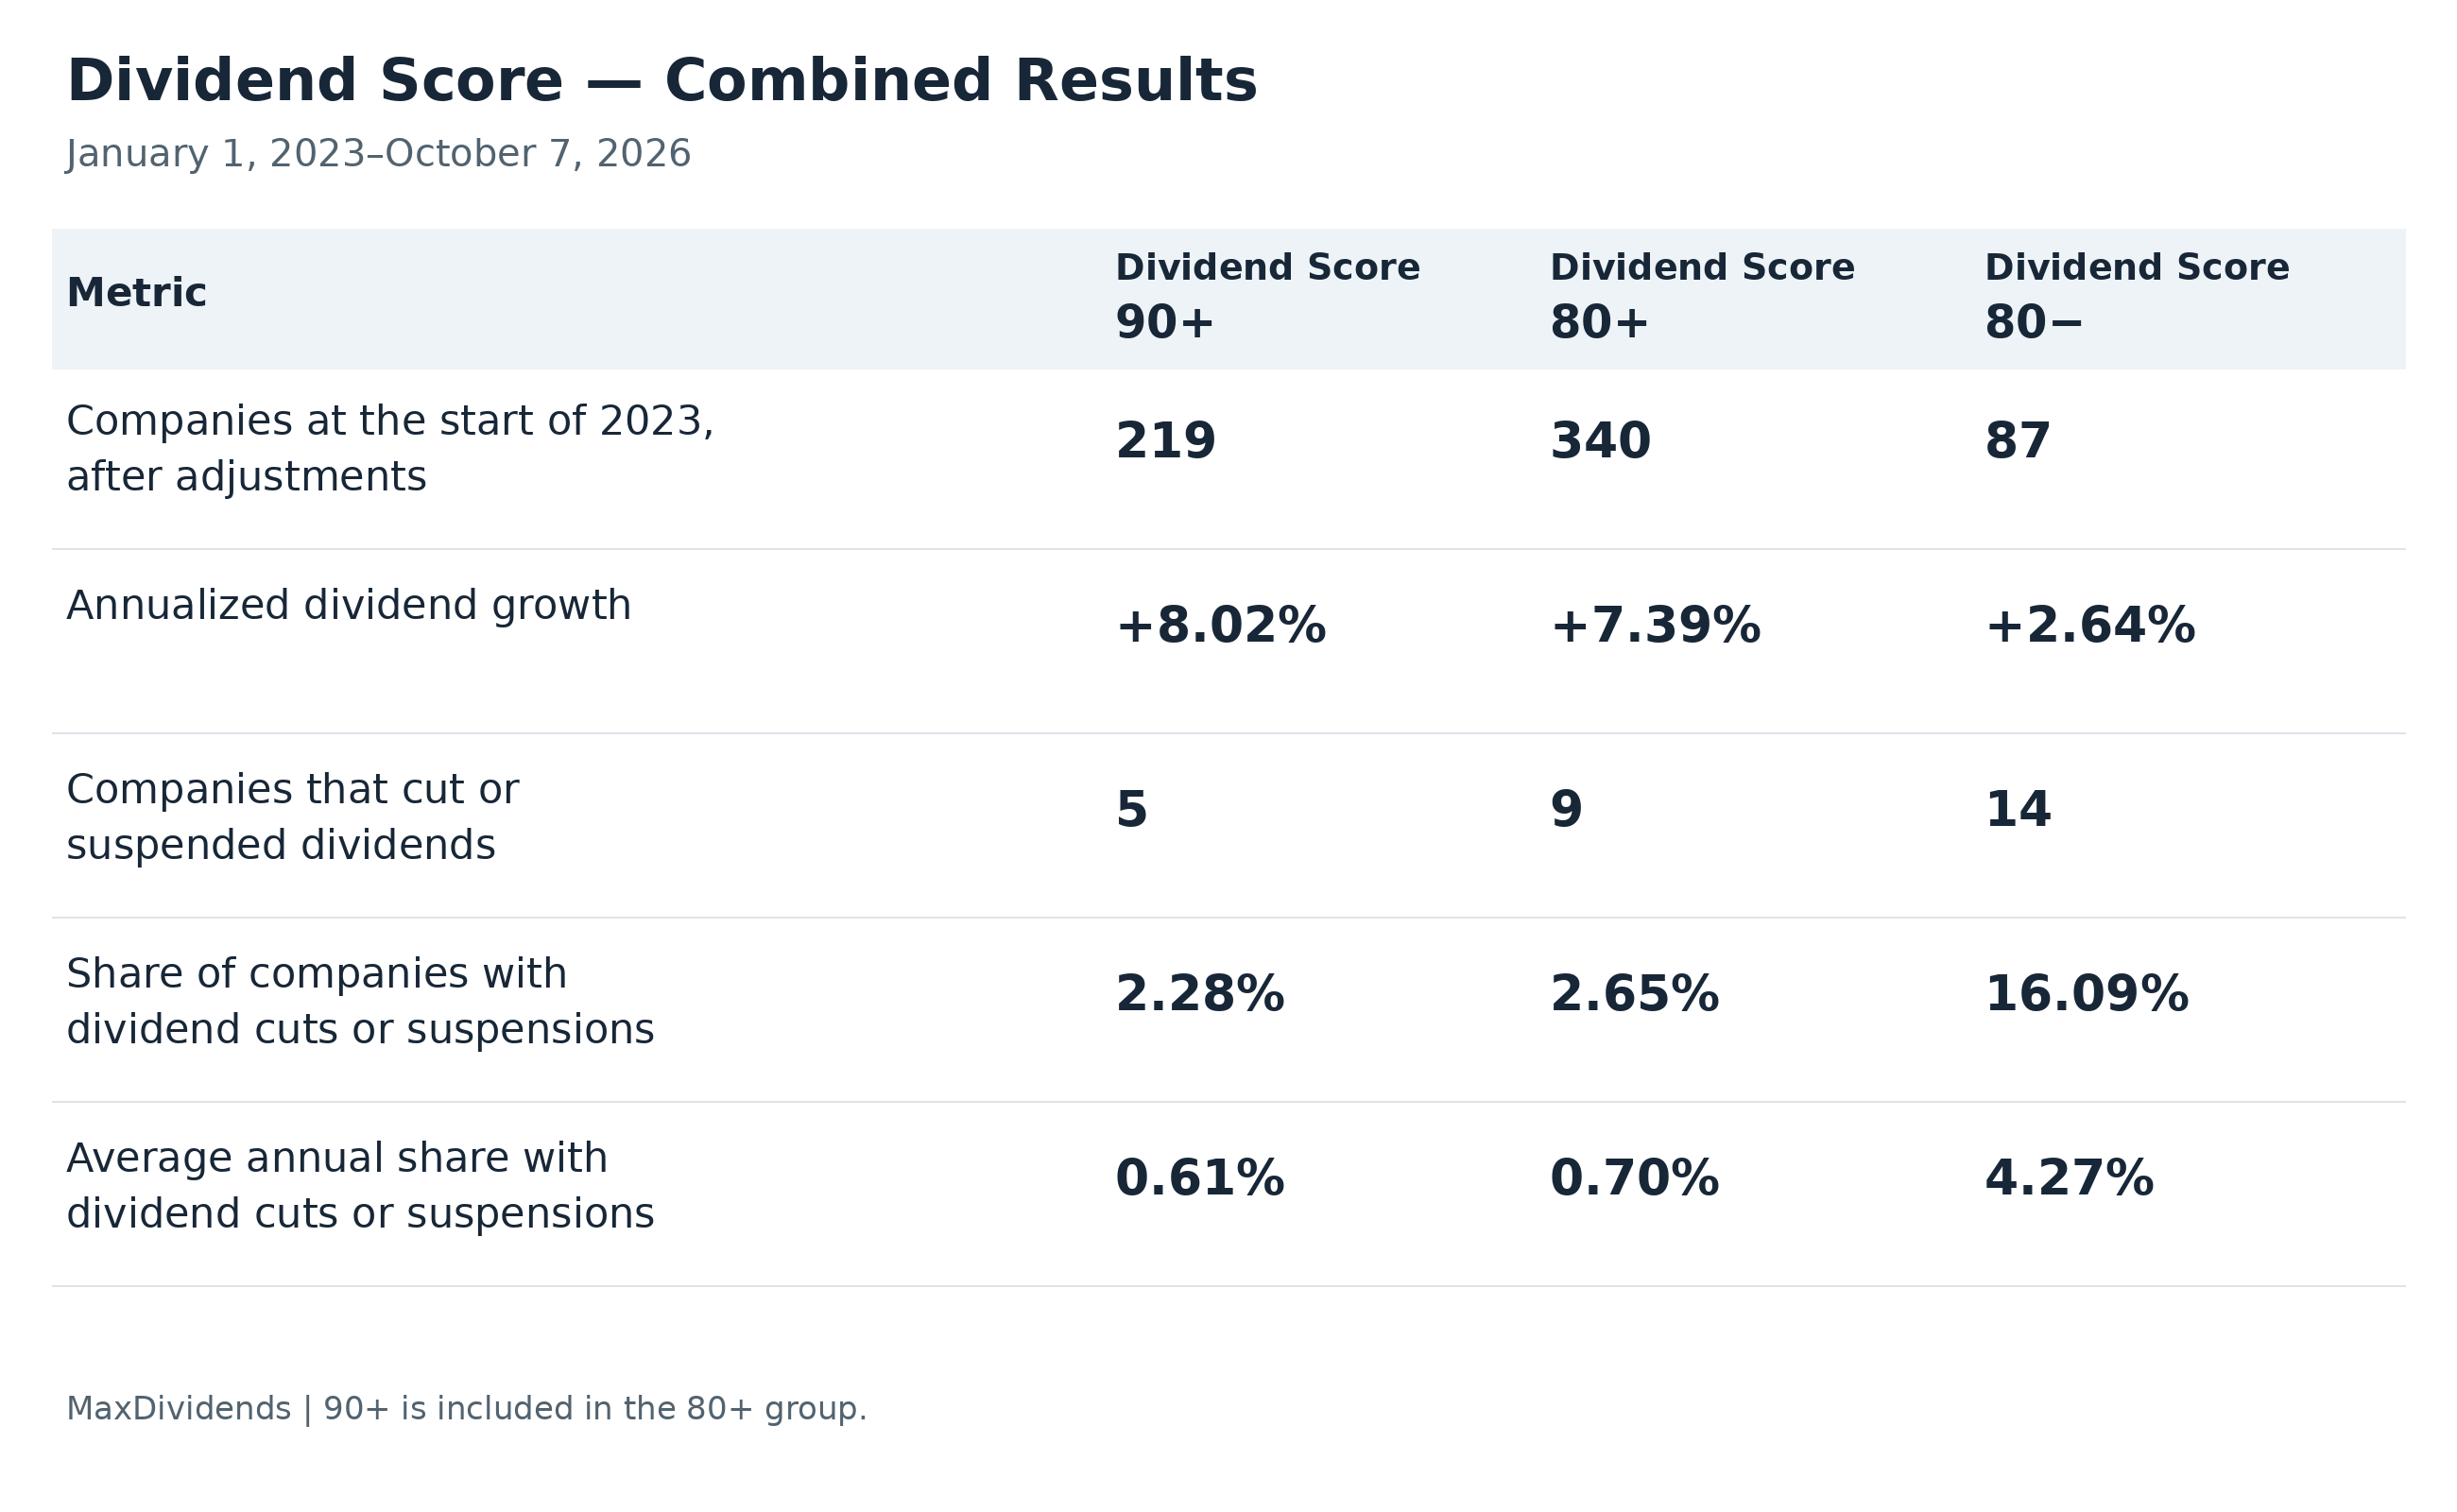
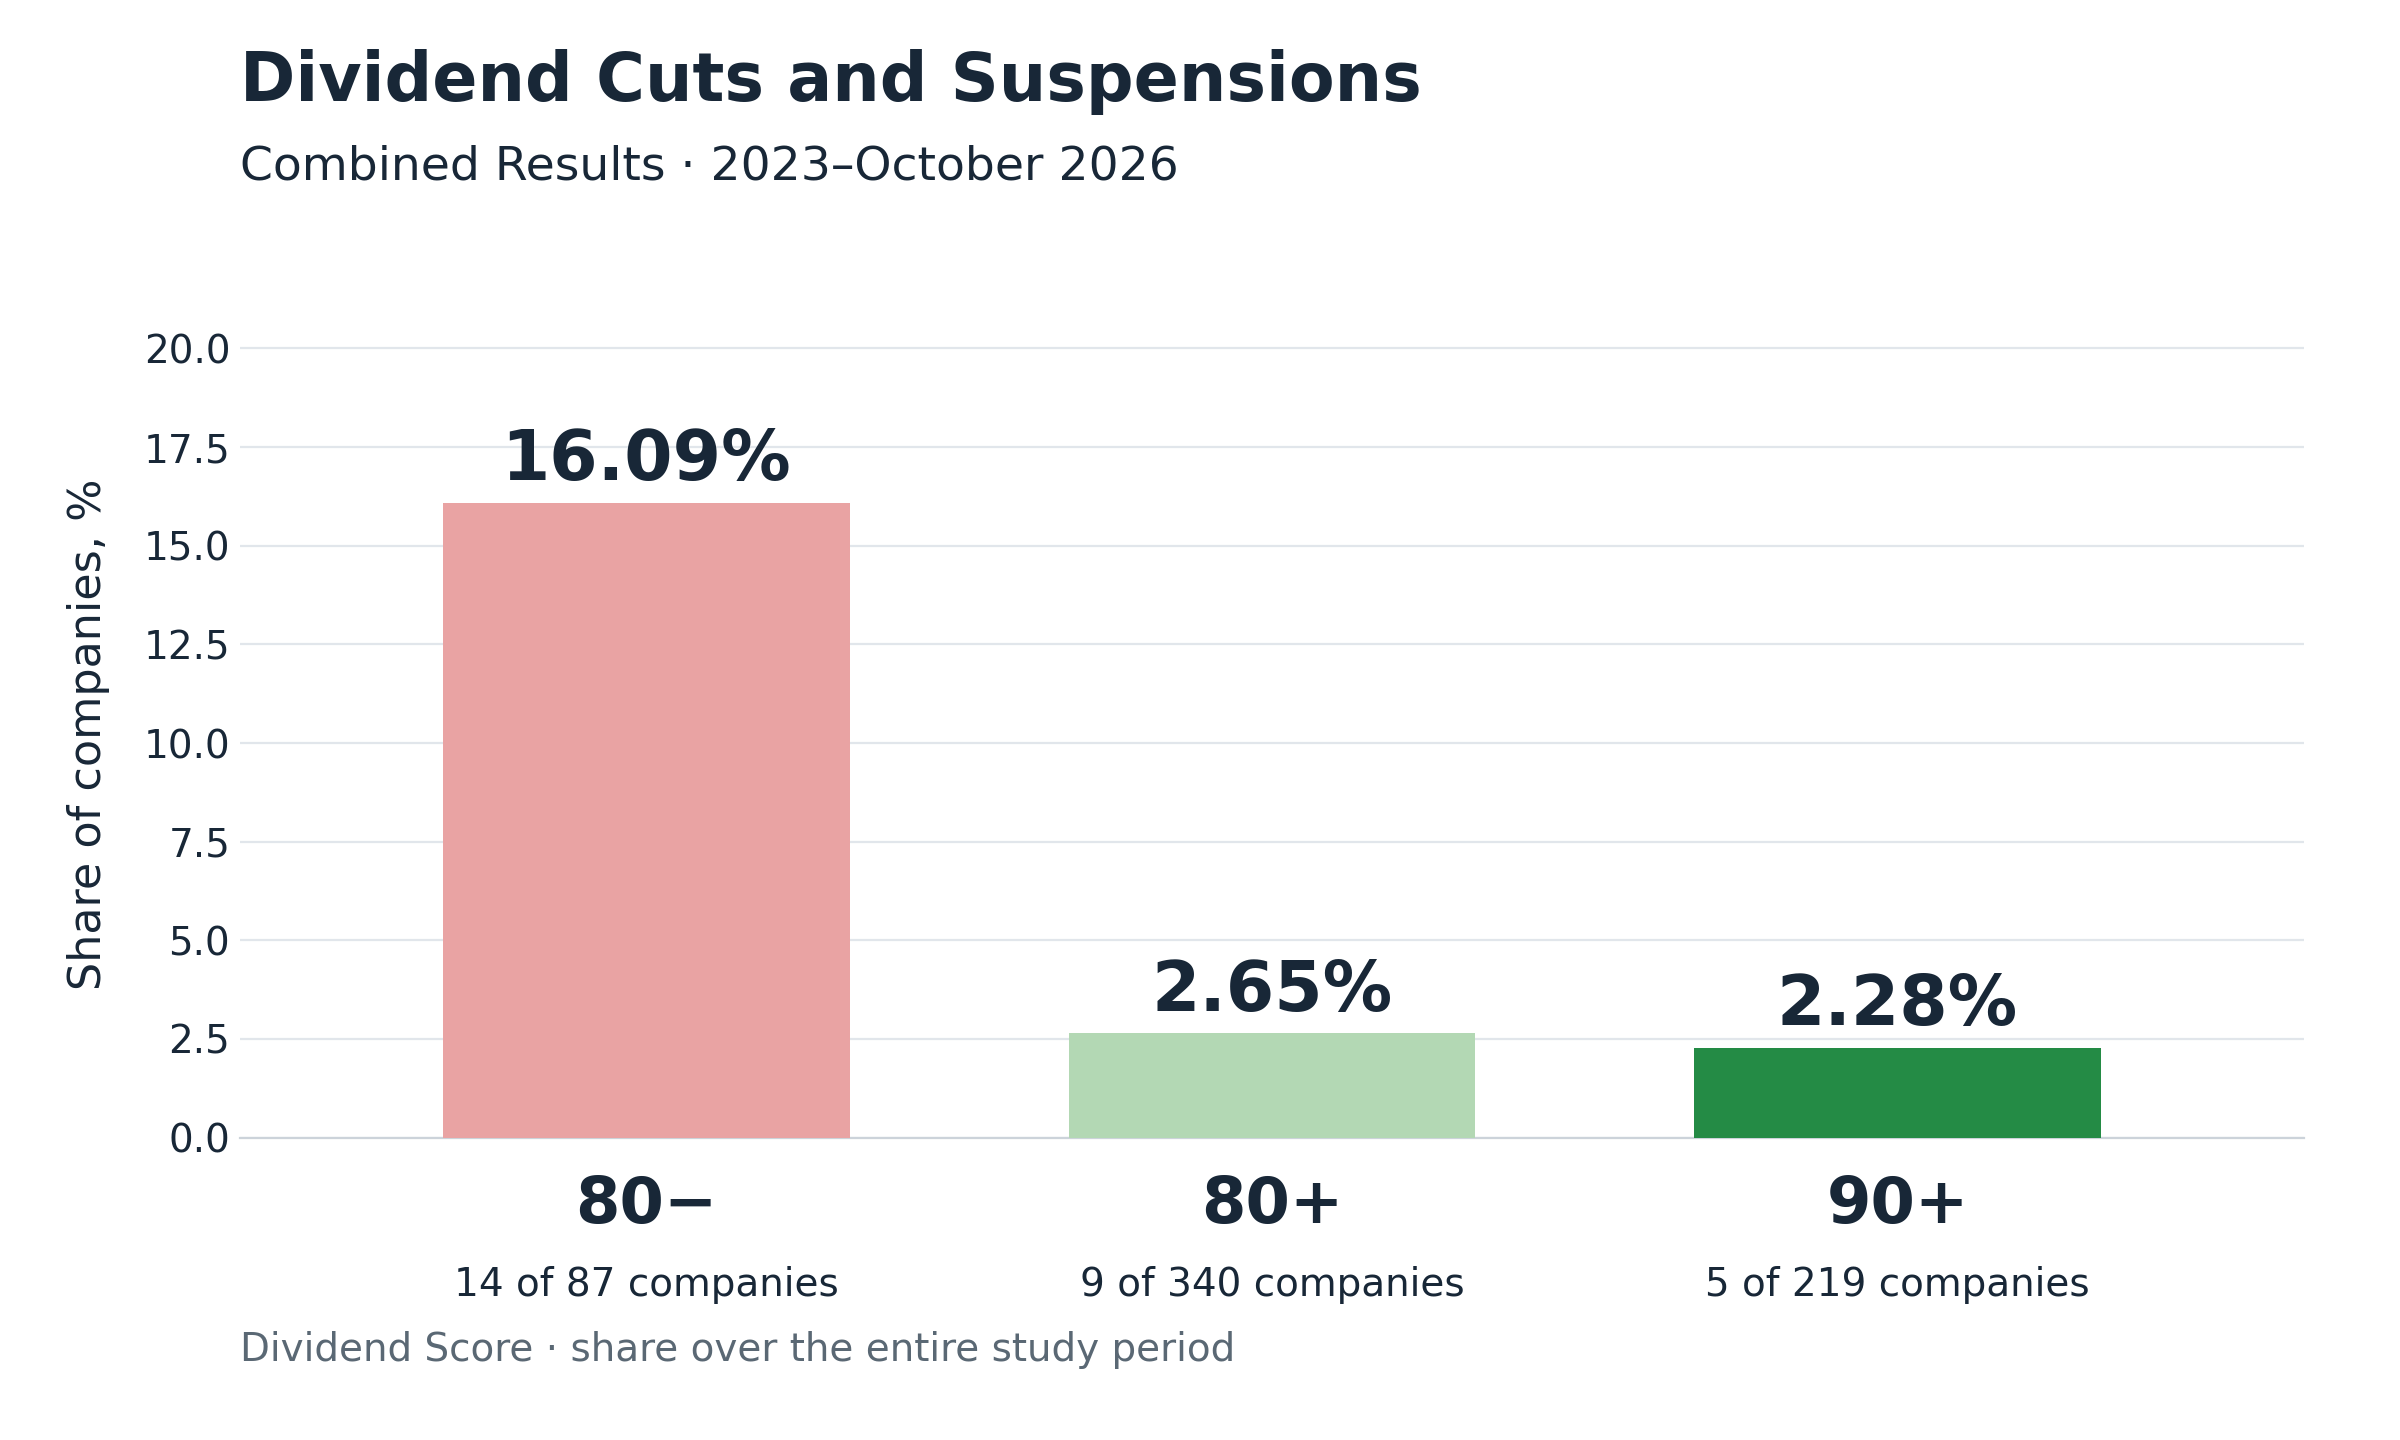
To make the difference easier to see, imagine 100 companies in each group. Over the entire study period of almost four years, approximately:
2 companies in the Dividend Score 90+ group would have reduced or eliminated their dividends;
3 companies in the Dividend Score 80+ group would have done so;
16 companies in the Dividend Score 80− group would have done so.
The share of companies with dividend cuts or eliminations in the 80− group was approximately 7.0 times as high as in the 90+ group and 6.1 times as high as in the 80+ group.
Annualized dividend growth was +8.02% for the 90+ group, +7.39% for the 80+ group, and +2.64% for the 80− group.
Dividend Cuts and Annual Income Growth
The first chart shows the share of companies that reduced or eliminated their payouts over the entire study period.
Dividend Score - Combined Results (US + Global Markets)
The second illustrates annual dividend income over 20 years, starting with the same initial investment.
How Dividend Growth Changes Investor Income
Imagine investing $1,000 in each group at the same initial dividend yield of 3%.
Each investment initially generates $30 a year. Payouts then grow at different rates: +8.02% annually for Dividend Score 90+, +7.39% for Dividend Score 80+, and +2.64% for Dividend Score 80−.
Let’s look at how annual income changes if these growth rates continue.
Dividend Score - Combined Results (US + Global Markets)
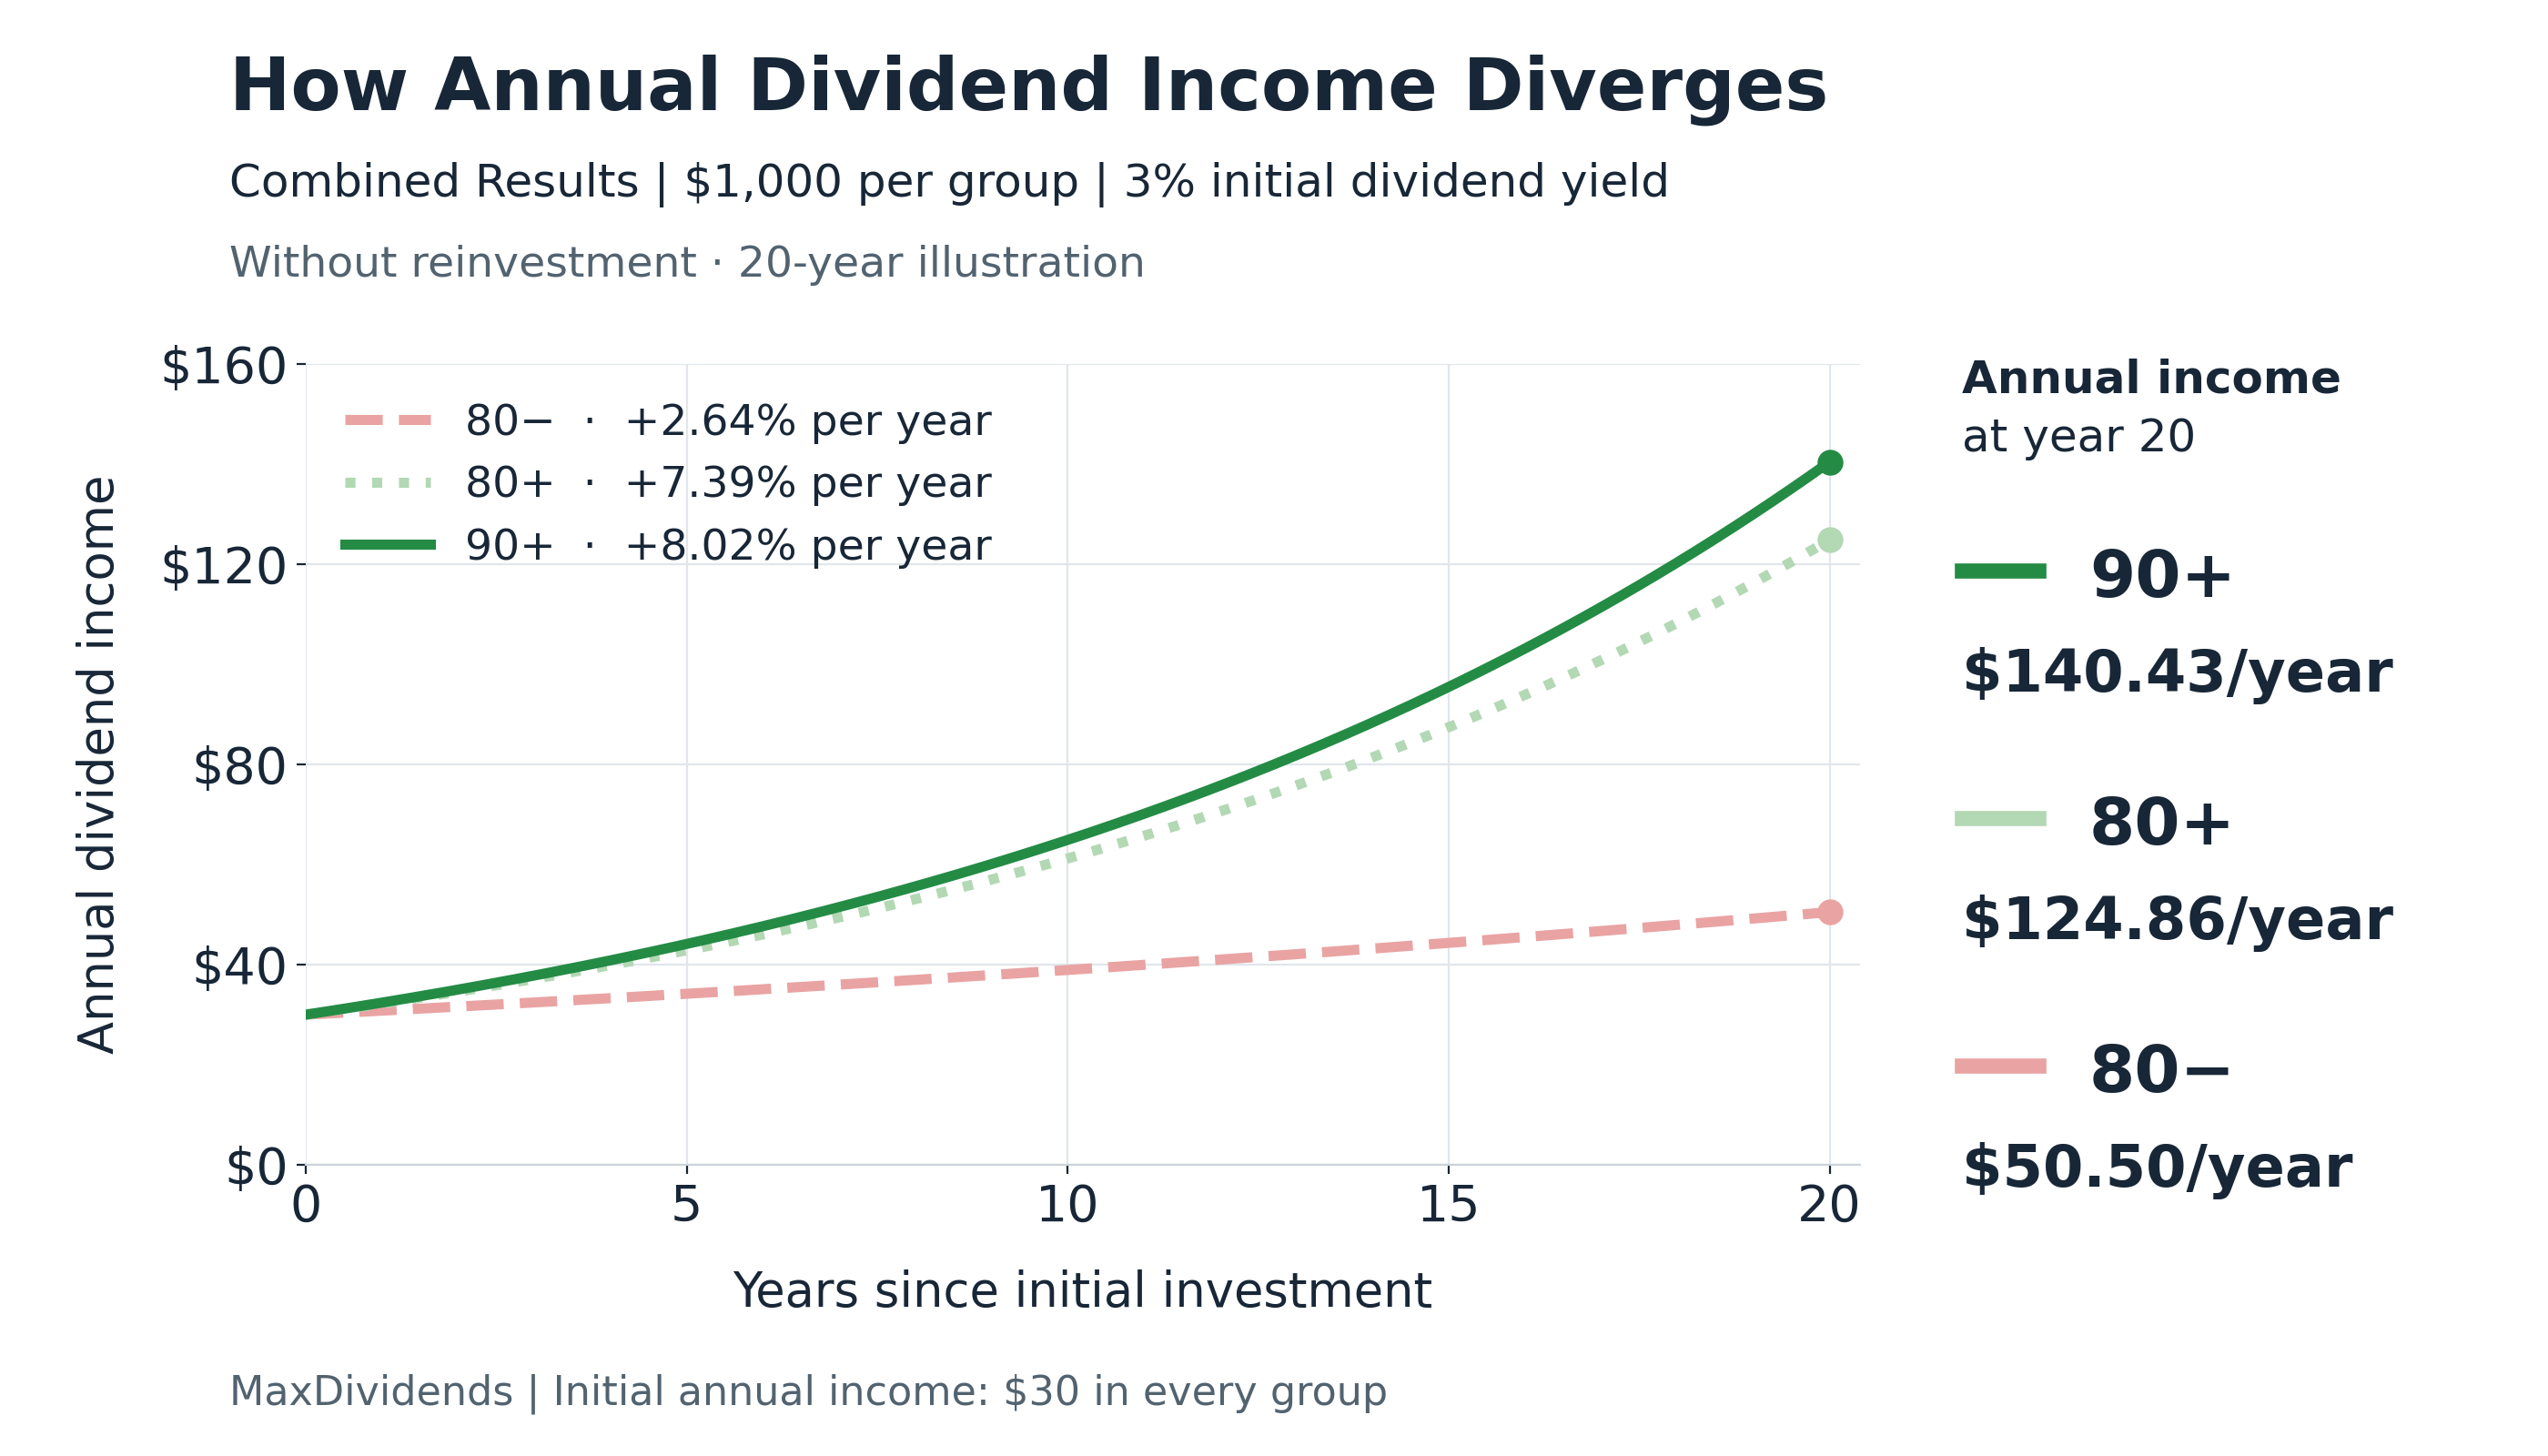
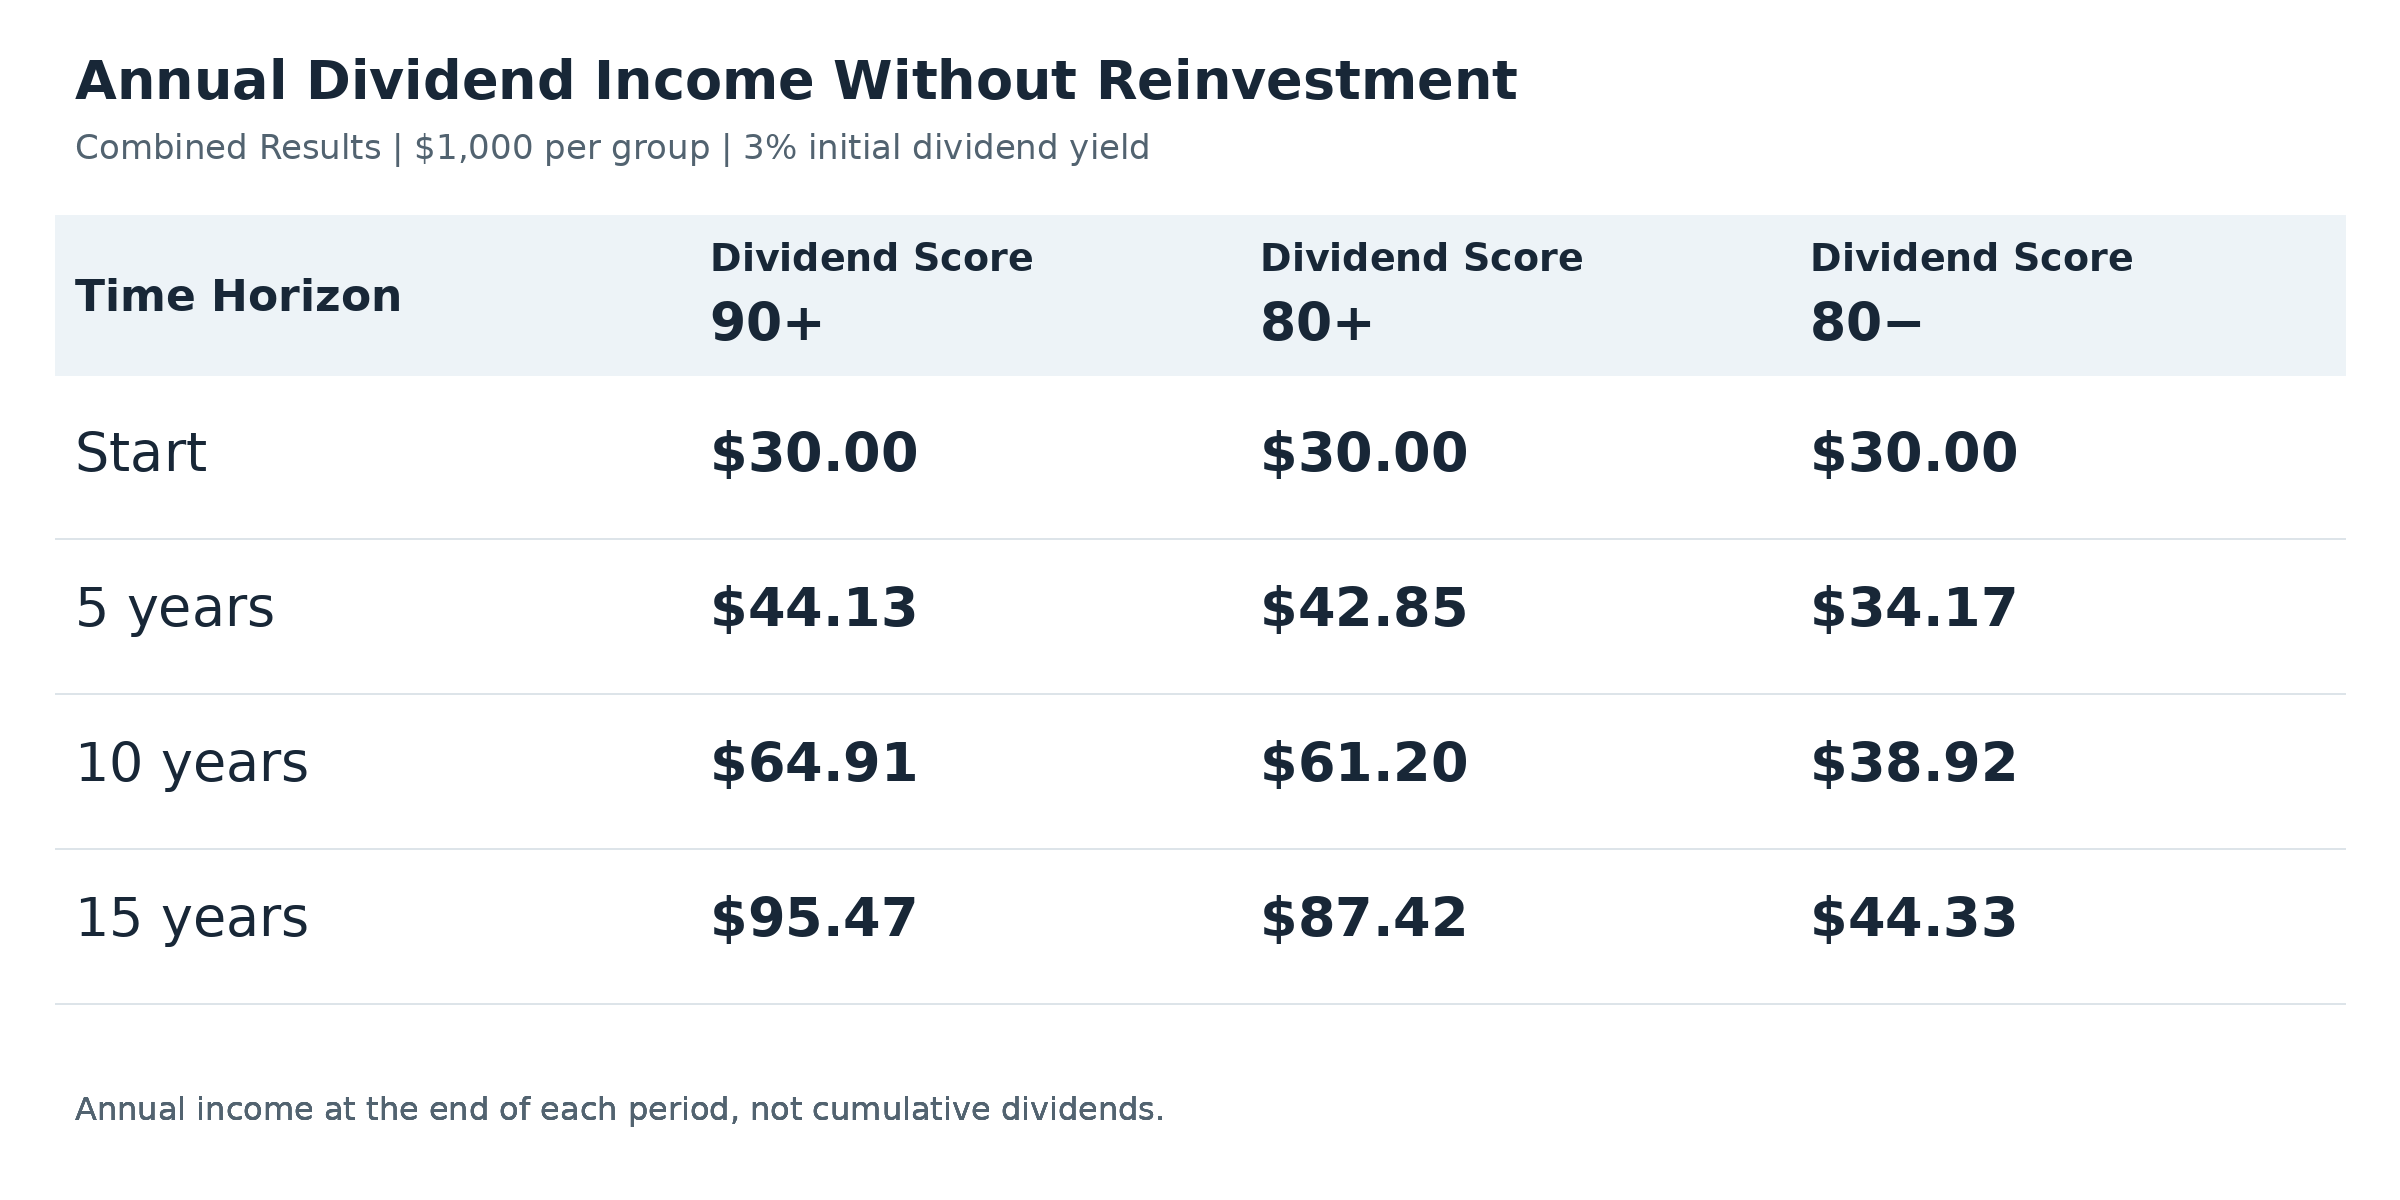
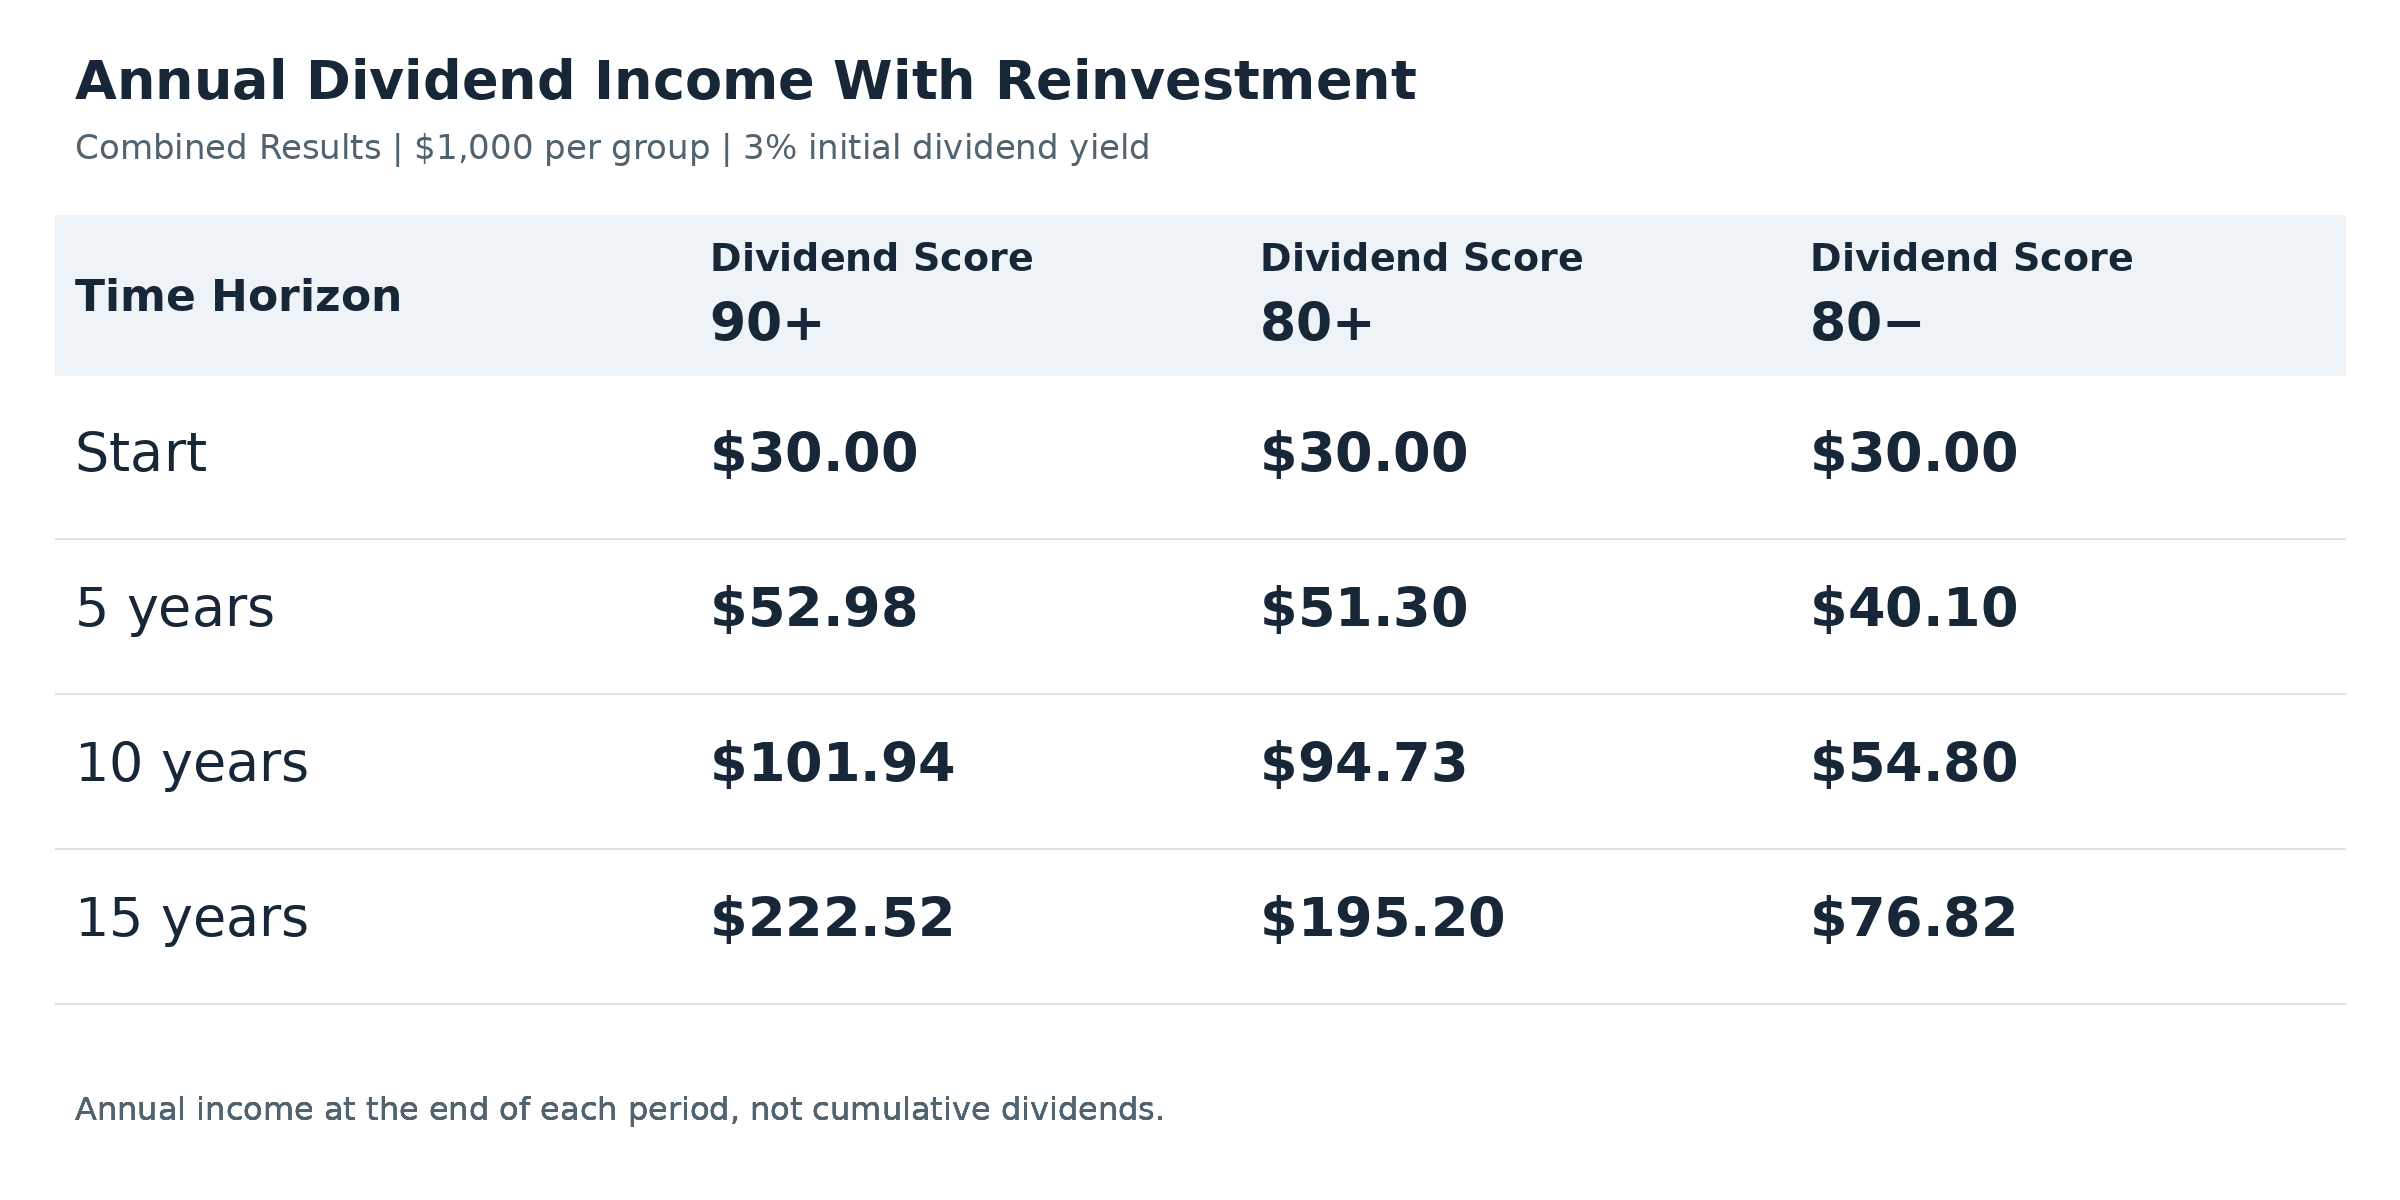
After 15 years, the investment in the Dividend Score 90+ group generates $95.47 a year without reinvestment, compared with $44.33 for the 80− group. With reinvestment, annual income reaches $222.52 versus $76.82.
Reinvestment amplifies the effect: dividends buy additional shares. Those shares also generate dividends, while the payout per share continues to grow.
— MaxDividends Team