


💿 Dividend Hike Alert — Starbucks Corporation (SBUX)
Good news for shareholders — Starbucks Corporation just boosted its quarterly payout from $0.62 to $0.63 per share, a 1.6% raise.
That marks 16 straight years of dividend growth.
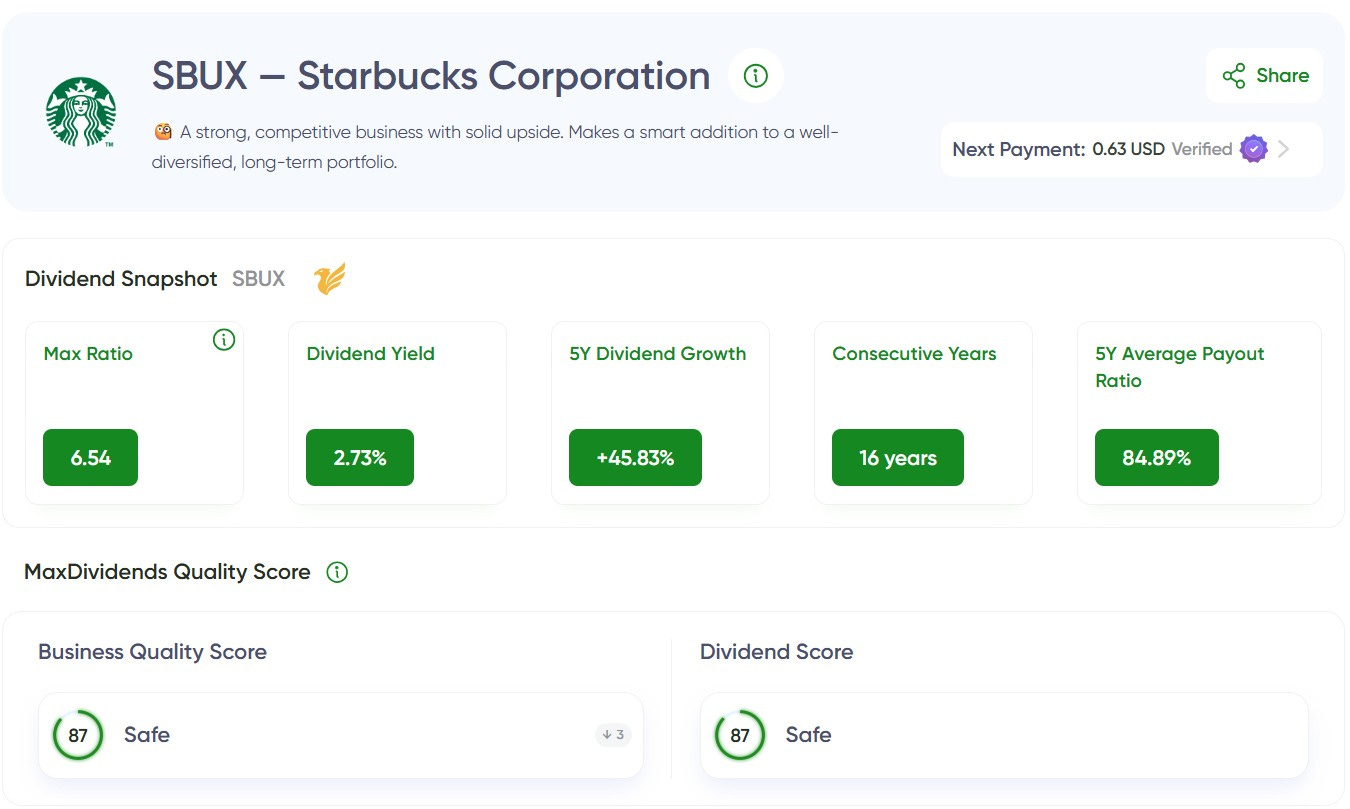
Steady, reliable, and still climbing — congrats to everyone holding this one.
A 1.6% bump sits oddly next to the +45.83% five-year dividend growth in the snapshot, which works out to roughly 7.8% a year. That is a sharp downshift. With the five-year average payout ratio near 85%, this reads more like protecting the 16-year streak while the turnaround absorbs cash. Does the Safe score weigh streak length more heavily than the size of recent raises?