
A 50% Dividend Cut and a 16% Slide — The Cost of Ignoring the Warning Signs
Real example. Real numbers. Real lesson.

MaxDividends Mission: Helping people build growing passive income, retire early, and live off dividends.
This series is part of the MaxDividends Academy — where we teach our proven secret Five-Pillar Formula in practice. Each lesson breaks down a real company, showing how to spot lasting dividend payers and avoid traps, step by step.
🔓 Request Free Early Access to the MaxDividends App
Learn Dividend Investing One Stock at a Time
🎓 MaxDividends Academy Case Study: LyondellBasell (LYB)
A real-world breakdown of how Financial Scores flagged the risk months before the damage was done.
Hey — Max here 💪
Today we’re breaking down what just happened with LyondellBasell Industries NV (LYB) — and why this matters if you care about building reliable dividend income.
For 14 straight years, LYB raised its dividend. Income investors trusted it. It looked stable. It paid well. And then on February 20, 2026 — the dividend was cut by 49.64%.
From $1.37 per quarter… to $0.69. Almost half your income — gone overnight. But here’s the part most investors miss.
The Real Damage Happened Before the Cut
Back in summer 2025, LYB was trading around $64 per share. At that time, inside MaxDividends, the company already had a weak Financial Score: 74.
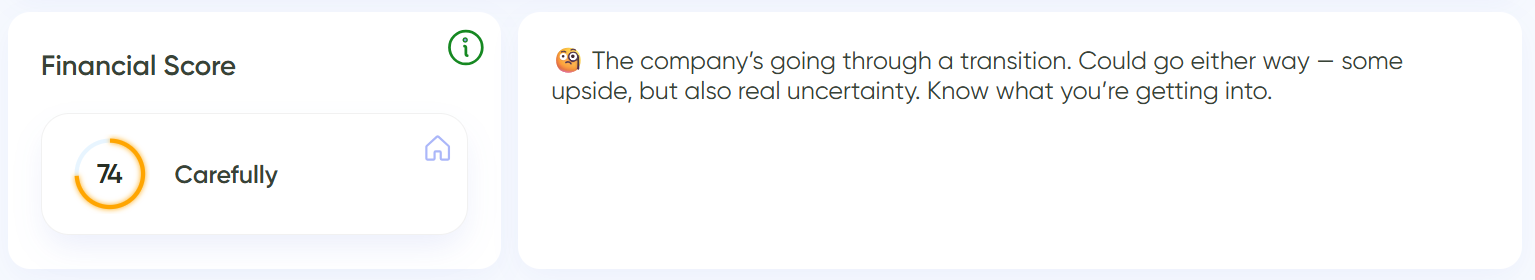
Our safety threshold is 80+. Strong companies usually sit above 90.
A 74 score means pressure is building. Margins. Cash flow. Cyclicality. Balance sheet risk. The warning signs were there. Fast forward to the dividend cut announcement — the stock was trading around $54.
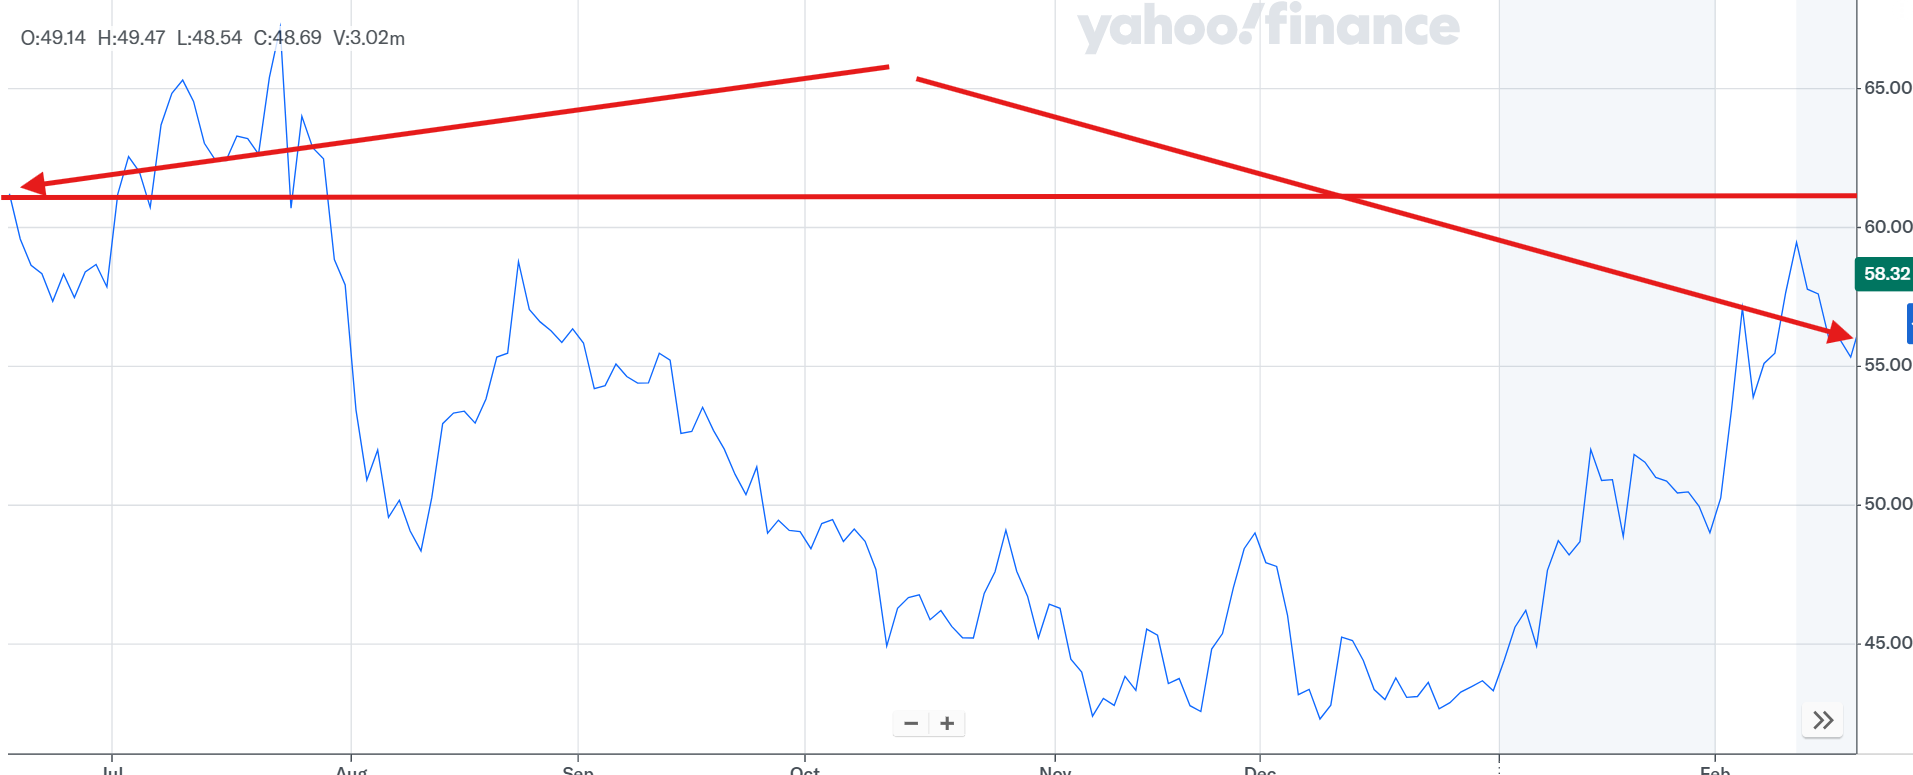
That’s a $10 drop per share. About 16% down before the dividend was even reduced.
Let’s Talk Real Money
Imagine you had $10,000 invested in LYB last summer. At $64 per share, that’s about 156 shares.
If you sold back then: 156 × $64 = about $10,000
If you held until the dividend cut: 156 × $54 = about $8,400
That’s roughly $1,600 gone. Sixteen percent of your capital — evaporated. And that’s before factoring in:
The 50% dividend income reduction
Any additional sell-off after the announcement
Now scale that up.
$50,000 position → about $8,000 lost
$100,000 position → about $16,000 lost
This is how small warning signs turn into five-figure damage.
What Could Have Prevented It?
A $199 per year MaxDividends subscription. That’s it.
If you had visibility into the Financial Score — and saw that 73.58 rating — you would’ve known the business was weakening. You could have rotated into a stronger 90+ rated dividend company.
Instead of losing $1,600… You would have paid $199. That’s not an expense. That’s risk management.
Dividend Investing Is About Protection First
Dividend cuts don’t come out of nowhere. They build slowly.
First earnings weaken. Then cash flow tightens. Then the payout becomes harder to support. Then management acts. Our Financial Score system is designed to catch that early deterioration. Not after the press release. Before it.
LYB wasn’t a surprise if you were watching the right numbers.
Since summer 2025, we’ve been systematically monitoring all U.S. companies that have paid dividends for at least 10 consecutive years without a reduction. Among those companies, we’ve recorded 235 dividend increases and 6 dividend cuts.
Here’s where it gets interesting.
The average Financial Score of companies that raised dividends is approximately 90.
The average Financial Score of companies that cut dividends is around 73.
That’s not coincidence. That’s a pattern.
When we look deeper, the difference becomes even clearer. Among 42 companies with Financial Scores below 80, we’ve already seen 6 dividend cuts. That’s about 15%. And we’re still early in our data collection.
Now compare that to the higher-quality group.
Among 199 dividend increases from companies with Financial Scores around 90, there has been only one announced dividend cut. That’s roughly 0.5%.
Fifteen percent versus half a percent.
That’s the gap between owning financially pressured businesses and owning financially strong ones.
The quality difference also shows up in dividend growth itself.
Companies with Financial Scores above 80 delivered an average dividend increase of 6.67%. Companies below 80 averaged 5.26%. Stronger companies don’t just cut less — they grow faster.
⚠️ If you are building a dividend portfolio, adding new positions, or designing a strategy to generate rising passive income and eventually live off dividends - the MaxDividends app with 19,000 companies and their Financial Scores inside, becomes a serious competitive advantage.
You can’t eliminate risk completely. This is not a 100% guarantee. No system can promise that. But we track the data in real time, and the statistics are very clear.
But you can stack the odds heavily in your favor.
And as LYB just demonstrated, avoiding even one 15–16% capital drop can mean thousands of dollars saved on a single position. That’s what MaxDividends is built for.
Protect capital first. Then grow income.
The Bigger Question
How many companies in your portfolio right now are sitting below 80?
How many are quietly sliding while you collect the yield?
Because the real cost of dividend investing isn’t missing upside. It’s holding the wrong business too long. One avoided 16% drop covers years of subscription. One avoided dividend cut protects your income stream.
This is exactly why MaxDividends exists — to help you protect and grow your passive income with discipline, not hope. Protect your capital first. Income comes second.
Get instant access to the MaxDividends Income System & App. Start living off dividends today - with a system you can trust.
— Max 💪